
 ?Mathematical formulae have been encoded as MathML and are displayed in this HTML version using MathJax in order to improve their display. Uncheck the box to turn MathJax off. This feature requires Javascript. Click on a formula to zoom.
ABSTRACT
During butter manufacturing, adulteration of animal and plant fats is one of the major issues in dairy industries. In dairy products, there is a huge potential in spectroscopic techniques such as Fourier transform infrared spectroscopy (FTIR) for the rapid determination of various adulterants. These spectroscopic techniques are reliable, rapid, and accurate as compared to traditional methods. Therefore, the aim of this study was to measure the potential of FTIR spectroscopy along with mathematical modeling for the detection of vegetable oil in butter samples. In this study, different levels of vegetable oil were added to the butter. FTIR spectra of different samples were collected and processed using principal component analysis (PCA) as well as partial least square (PLS) regression. PCA results postulated that 98% of the total variance was accounted by the first two principal components (PC) with a predominance of PC 1 (85%). PLS regression analysis showed values of R2 for calibration as 0.95 and R2 for validation as 0.90 which described good prediction efficiency of vegetable oil adulteration through FTIR data. The present work summarized that Fourier transform infrared spectroscopy along with multivariate analysis can be used to measure the adulteration in butter.
Introduction
Food adulteration is one of the major issues in present times around the globe, particularly in developing or underdeveloped countries. To increase product quantity, food adulteration involves the addition of less-expensive ingredients (for the sake of high profit) which are very harmful and injurious to consumer health or lack nutritious substances.[Citation1] Malpractices or adulteration of food has been performed for a long time and has become more sophisticated in the last few years. High-value food products and ingredients are most susceptible to adulteration. So, determining food authenticity and detecting adulterants have become important for effective control of food quality and safety.[Citation2]
Globally, dairy products have been widely consumed and are easy targets for adulteration. Adulteration is a very serious issue in the marketing of dairy products due to a wide range of prices for different milk-based products in the market. Among various dairy products, butter is being consumed worldwide in various food products as an ingredient.[Citation3] Butter is produced from pure milk which comprises 80% milk fat as defined by Codex Alimentarius Commission Standard (1973). It is an important macromolecule of milk fat, which affects the texture and nutritional value, flavor, and shelf life of the final product. “Butter” is directly obtained from cream which is derived from milk. It is one of the most expensive fats having high quality. The European community has established strict standards to detect butter quality and has narrated that butter should only be obtained from milk or cream.[Citation4]
Butter is being produced since prehistoric times and has become a globally traded product since the fourteenth century. It contains proteins, calcium, fatty acids, phosphorus, vitamins (A, D, E, and K), lactones, and methyl ketones. Butter has many health benefits due to its high nutritional value. For example, it contains antioxidants, which protect the body from free radicals especially selenium. Moreover, butter also offers pleasant taste and aroma to the foods. Due to the high nutritional profile of butter, its cost is also high as compared to other lipids such as fats and oils. Adulteration is one of the common practices found in butter due to its high cost. In order to increase profit, people mix margarine with butter.[Citation5] The addition of vegetable oils and removal of natural milk fat from butter lead to quality deterioration and loss of nutrients. Adulteration of butter with vegetable and animal fats is mainly attributed to resemblance in terms of fatty acid configuration. Therefore, the non-milk fats detection in butter is highlighted, and different studies have been performed currently by numerous research groups to establish analytical approaches for this drive.[Citation6]
Presently, several techniques are in practice for detecting adulterants in milk and milk-based products. The most commonly employed techniques include butyro-refractometer reading, apparent solidification time test, fat determination, and color test. However, the major disadvantage of these classical methods is that they are very time-consuming and do not provide immediate results. To overcome this problem, there is a need for rapid and advanced techniques or systems for determining the quality of milk and milk products.[Citation7] Numerous modern analytical techniques have been studied for the detection of adulterants in milk such as electronic noses, isotopic ratio mass spectroscopy, nuclear magnetic resonance, vibrational spectroscopic methods, and thermal analysis.[Citation8] All these advanced techniques have also been studied for the identification of adulteration in olive oil, honey, and meat products.[Citation9–11] Recently, Fourier transform infrared spectroscopy (FTIR) application has been seen as an effective and useful technique in food analysis for rapid identification of adulteration in edible fats and oils.[Citation12] Additionally, it does not need special sample preparation for analysis compared to other techniques.[Citation13]
FTIR spectroscopy is a rapid, simple, and highly sensitive instrument in food analysis and quality control. It has been used to determine the composition, relation to texture, sensory, shelf-life, quality control, seasonal variability, and different biochemical changes in foods during processing, storage, and spoilage through molecular fingerprinting. FTIR spectroscopy is the type of atomic absorption spectroscopy which is based on the principle of the atomic vibrations of the molecules after absorbing particular frequencies and energies in the infrared region. The molecules are detected and classified based on their specific molecular signatures. FTIR has become a popular analytical technique due to its advanced data processing and programming technology that makes it easier to manipulate spectral information and the development of multivariate analysis techniques. This technique can also be used for the exploration of milk-based products, such as butter. Various studies have confirmed the potential of FTIR spectroscopy for the characterization, classification, and authenticity detection of edible fats and oils.[Citation14] In this regard,[Citation15] used FTIR spectroscopy to detect palm oil adulteration in butter. For this purpose, they added different concentrations of palm oil in butter (up to 50%) and revealed that FTIR spectroscopy can be used with chemometric tools for the detection of palm oil adulteration ranging from 4% to 44%. They also described the detection limit of FTIR spectroscopy as 3% addition of palm oil in butter samples. Similarly, Koca et al.[Citation16] used mid-infrared spectroscopy (MIR) for the detection of margarine adulteration in butter and concluded that MIR spectroscopy can be used for rapid detection of adulterants in dairy products.
On industrial level, the new developments in chemometrics make FTIR spectroscopy an appropriate technique for quality control of the dairy products. In authorization of dairy products, FTIR technique has the potential to categorize the thermal treatment of skim milk powders and examination of skim milk, cream, cottage cheese, milk powder, and butter using dissimilar wavelengths in combination with several mathematical modeling methods. Therefore, the current study is designed to assess the possibility of FTIR spectroscopy as a fast and rapid technique for measuring the adulteration in butter.
Materials and methods
Procurement of raw material
Different samples of butter were obtained from the dairy farm of University of Agriculture, Faisalabad, Pakistan, and low-priced vegetable oils were procured from local market.
Experimental plan
Pure butter samples were mixed with vegetable oil at different concentrations. For this purpose, the butter samples were subjected to sauteing to remove the moisture which facilitates the mixing of vegetable oil in the butter. After melting, the butter was settled on low heat followed by the addition of experimental ratios of vegetable oil as depicted in and storage at refrigerated temperature (4 ± 1°C).
Table 1. Study plan for adulteration of vegetable oil in butter.
Traditional methods to determine fat adulteration in butter
Apparent solidification time (AST): For the measurement of fat adulteration, AST method was performed according to the technique proposed by Kumar et al.[Citation17] In a test tube, completely melted sample of fat (3 g) was poured and maintained for 5 minutes at 60°C. After that, sample was placed at 18 ± 0.2°C in a water bath and observed constantly until the solidification of fat sample occurs. At this stage, the time for solidification was recorded for the apparent solidification of fat.
Color test for the determination of fat adulteration: Color test was performed for the detection of fat adulteration as described by Seo et al.[Citation18] For that purpose, 3 ml of melted butter sample with equal quantity of hydrochloric acid was added in a stopper test tube along with a pinch of sugar. Mixture was shaken and kept for five minutes in test tube stand. Appearance of crimson color in lower (acid) layer showed presence of adulterant.
FTIR analysis: FTIR spectrophotometer (BRUKER TENSOR 27) with absorption mode was used for the detection of adulteration in butter samples. Spectra were taken in Mid Infrared (MIR) region having wavelength range 4000 and 800 cm−1 at 4 cm−1 resolution on FTIR using OPUS software. The butter samples having various concentrations of vegetable oil were placed on the ATR (attenuated total reflectance) top which is made of ZnSe4 crystal and pressed with gripper for spectroscopic measurement. A background spectrum was analyzed before each scanning. The sample spectra were subtracted against background spectrum. One minute was the running and collection time for each sample spectrum. Each time, an average of 16 scans was taken from FTIR spectrophotometer, so in total 96 spectra (16 spectra on same sample × 2 measurement on each sample × 3 independent samples = 96) for each treatment were collected. As there were total eight treatments, therefore, in total, 768 (96 × 8 = 768) spectra were collected for this study. Additionally, prior to each run, sample reference spectra from clean crystal were also collected. After running each sample, crystal was washed with ethanol and desiccated before scanning the next sample. By measuring the background spectrum and comparing with the previous spectrum, the cleaning of the crystal was confirmed. The spectra were measured as absorbance values at each data point.
Mathematical modeling
The collected spectra were subjected to mathematical modeling by applying chemometric analysis through which the raw spectra were processed for baseline correction using the Unscrambler X 10.5 software. The details are provided here.
Pretreatment of spectra
The raw spectral data, taken from a spectrometer, are not inevitably appropriate for succeeding chemometric treatment. The pretreatments are intended for refining the signal and data reduction.[Citation19] Among the pretreatments used, baseline adjustment for FTIR spectra is very important. After the optical inspection, the detection of irregular spectra was accomplished by Hostelling’s T2, which shows that how a sample spectrum is different from the average spectrum in the set.[Citation20] An example with a Hostelling’s T2 of standardized units from the mean spectrum was defined as a global H outlier and that outlier may eradicated from the population.
Principal component analysis (PCA)
PCA was used to get an outline of all statistics information present in the dataset. It computed new variables, called principal components (PCs) which was in linear groupings of initial variables. PCA allowed the use of the whole spectrum for the quantitative investigation and provided a synthetic explanation of large datasets with minimum loss of information. This statistical multivariate treatment made it probable to draw parallel maps of the samples.
Partial least square (PLS) regression
In the X space, to find the multidirectional direction, a PLS model was developed, that clarified the maximum multidimensional variance direction in the Y space.
Root mean square error
Spectral collection was determined by root mean square of validation (RMSEV), root mean square error of calibration (RMSEC), and coefficient of determination (R2) of calibration and validation. Two division of the spectral collection was done: one-third of the samples were used for validation set while two-thirds were used for the calibration set.
Results
Apparent solidification time test
Total eight samples were prepared for AST determination. Results stated that the AST was significantly different among samples with varied concentrations of vegetable oil adulteration in the butter. For the pure butter sample, the recorded average AST was 2 min and 40 s, whereas for T1 (100% vegetable oil), the AST was 1 min 48 s. For all the other samples, the AST values were decreased as the percentage of mixed vegetable oil was increased in the butter (). It was revealed from the results that pure butter had apparently higher solidification time because of more saturated fatty acids as compared to vegetable oil. It was concluded from the findings that the AST technique can be successfully used to determine the levels of adulterants in the butter.
Table 2. AST and color test results of butter with different levels of vegetable oil adulteration.
Color test
Butter samples were also tested for adulteration for crimson color. Only T0 (100% butter) was not adulterated and showed negative result while all the other treatments showed positive results due to the addition of vegetable oil ().
FTIR spectral results
Typical pure butter and vegetable oil FTIR spectra with baseline correction are shown in . Spectra of pure butter (T0) were collected using FTIR in mid infrared range. Peaks were observed from 4000 to 800 cm−1. The vibrations at 1600–1500 cm−1, assigned to O–H groups, were observed which correspond to water. Similarly, absorptions were also observed at 2900 and 2800 cm–1, respectively. Moreover, some other peaks were also observed at 2911 cm−1, 1637 cm−1, and 1497 cm−1. Mid infrared spectra for pure vegetable oil (T1) were also taken and absorption bands in the region of bands 3014, 2931, 2874, and 2851 cm−1 were recorded. Further, FTIR spectra for adulterated butter with 10% vegetable oil (T2) were also collected and results revealed that strong absorption of bands for butter fat was observed in the region of 3500–2800 cm−1. At 3374 and 3244 cm−1, spectral bands of butter fat showed maximum absorbance. The FTIR spectra of adulterated samples showed difference in bands at ∼3244 cm−1. For butter, maximum absorbance of this band was at 3374 cm−1, while for vegetable, the band shifted to 3680 cm−1. At 1643 cm−1, higher band intensities were observed for vegetable oil samples whereas it was negligible for butter. Major variations were collected between vegetable oil and butter spectra in the regions of 1500–1050 cm−1.
Figure 1. Typical FTIR spectra for butter (100%), vegetable oil (100%), and adulterated butter samples with different levels of vegetable oil.
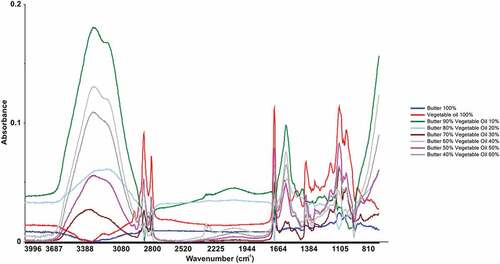
For T3 (butter adulterated with 20% vegetable oil), a peak of high absorbance at 1633 cm−1 was observed whereas pure butter sample had lower absorbance at 1637 cm−1. Likewise, variations were recorded in the absorbance and position of peaks at 1484 cm−1, but in pure butter sample, peaks were observed at 1497 cm−1. Similarly, deviation in the peak position from 2888 cm−1 (pure butter) to 2874 cm−1 (butter adulterated with 20% vegetable oil) was also observed. Correspondingly, shift in the peak position was also recorded from 2911 cm−1 (pure sample) to 2921 cm−1 (adulterated sample). In addition, when spectra of T4 (butter adulterated with 30% vegetable oil) were compared with T0 (100% butter), it was noticed that a peak was obtained at 3234 cm−1 for pure butter while no peak was developed at this point for adulterated samples. Alike, the range from 1000 to 1500 cm−1 was also significantly affected by this treatment and a little bit increase in absorbance was noticed at different points.
FTIR spectra for butter adulterated with 40% vegetable oil (T5) showed strong intensity at 1627 cm−1. Furthermore, peak generated at 2891 cm–1 had lower absorbance as compared to pure butter samples. Peak at 1627 cm–1 also had strong intensity in comparison with the spectra collected from 100% pure butter. Similarly, the finger print region (1400–600 cm−1) also had high absorbance as compared to the T0 (100% butter). FTIR analysis for the butter samples adulterated with 50% vegetable oil (T6) also had high absorbance values at functional group region (4000–1500 cm−1) while finger print region (1400–600 cm−1) had lower absorbance values. Strong intensity was observed at 1743 cm−1 whereas a weak signal was recorded at 2884 cm−1. In addition, a new peak was developed at 968 cm−1. Spectra collected in mid infrared range for T7 (40% butter and 60% vegetable oil) showed broad signal at 3357 cm−1 and another strong peak was developed at 1740 cm−1.
Multivariate analysis
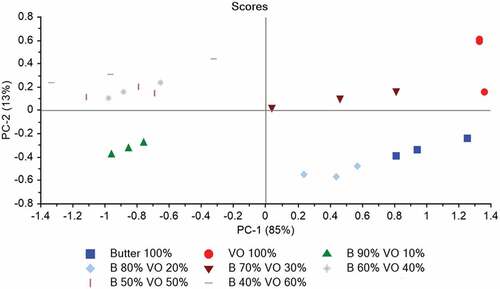
Principal component analysis: PCAs were performed on the data-set of FTIR spectra recorded on vegetable oil, butter, and adulterated samples to investigate the potential of FTIR spectroscopy to discriminate these samples as a function of adulteration and to retrieve additional information from spectra. After the visual inspection, the detection of anomalous spectra was accomplished using Hostelling’s T2 which shows how much a sample spectrum is different from the average spectrum of the set (). The PCA similarity maps defined by the principal components 1 and 2 for FTIR spectra are shown in . These findings depicted that the first two principal components (PCs) accounted for 98% of the total variance with a predominance of component 1 (85%). A discrimination of butter, vegetable oil, and adulterated samples was observed according to PC 1 and PC 2 for the dataset.
Figure 2. Hostelling’s T2 map for FTIR spectra of butter, vegetable oil, and adulterated samples.
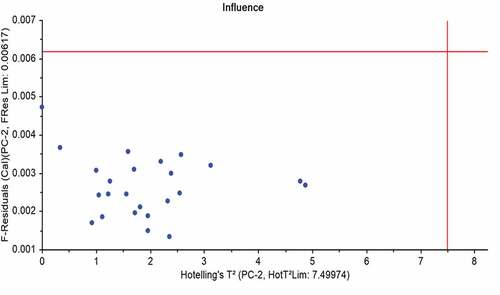
Figure 3. PCA similarity map defined by PC1 and PC2 for the FTIR spectra of butter, vegetable oil, and adulterated samples (VO: Vegetable Oil, B: Butter).
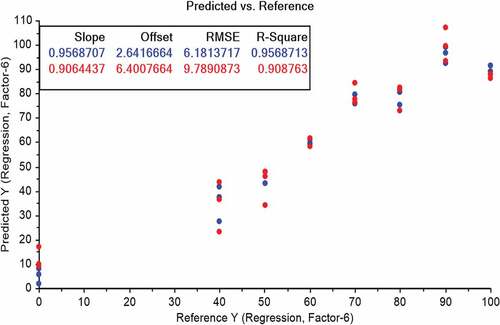
PLS regression analysis: For prediction of vegetable oil adulteration into butter, PLS regression method was applied between two-dimensional spectral data of FTIR and percentage of vegetable oil into the butter. In first model of PLS regression, full range of FTIR spectra (4000 to 800 cm−1) was used (). The results obtained by PLS model showed the values of R2 equal to 0.88 for calibration and 0.68 for validation using three PLS factors. Root mean square error of prediction was 17.46. Second PLS regression model was fitted using a smaller portion of FTIR spectra (). Only small range of FTIR spectra (2800 to 3000 cm−1) was used knowing the fact that the acyl-chain is mainly responsible for the absorption observed between 3000 and 2800 cm−1. The FTIR spectra in 3000–2800 cm−1 range collected for the samples showed values of R2 for calibration as 0.95 and R2 for validation as 0.90. A PLS model with six factors was used to carry out this validation. Lower values of RMSEC and RMSEV were obtained for region of 3000–2800 cm−1 than for the previous model.
Figure 4. PLS regression-based prediction model developed by FTIR spectra (4000–800 cm−1) obtained from butter, vegetable oil, and adulterated samples.
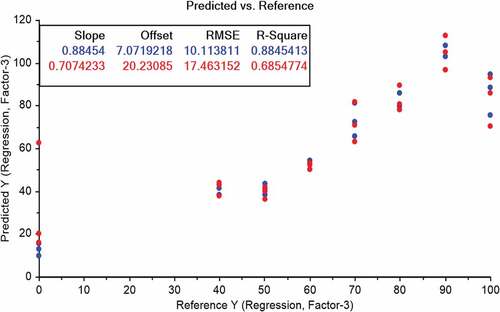
Figure 5. PLS regression analysis of FTIR spectra (3000–2800 cm−1) obtained from butter, vegetable oil and adulterated samples.
Discussion
Detection of butter adulteration with traditional methods
The apparent solidification time (AST) of the fat sample can be defined as the time taken by the melted fat sample at a particular temperature to get solidified apparently. In butter sample, the presence of foreign fat may be suspected when the AST differs from the prescribed limit of variability. The findings regarding AST are well supported by the findings of Williams et al.[Citation20] who used fractionation technique followed by AST test for detection of foreign fats and oils mixtures in butter. Similarly, results regarding the color test are in harmony with the findings of Kumar et al.[Citation21] who examined adulteration in butter samples collected from locations (Delhi-West Delhi, South Delhi, East Delhi, and North Delhi) and observed the presence of vegetable oils in butter samples.
Interpretation of original FTIR spectra
FTIR spectra were collected for all the samples and observed based on the development of peaks in different regions. For pure butter samples (T0), the observed peaks (1600–1500 cm−1) can affect the amide I signal at about 1650 cm−1 Likewise, the peaks observed at 2900 and 2800 cm–1 mainly describe the C–H (CH2 and CH3) stretching vibrations. The peak obtained at 2911 cm−1 is associated with –C=C–H stretching groups of cis-unsaturation. At 1637 cm−1, another strong peak was recorded, which is mainly associated with – C=O stretching vibrations of acids and esters. The peak at 1497 cm−1 and the next arising from N–H bending vibration are most likely associated with the amide I and amide II bands of proteins. In the last part of the bands (1300–1000 cm−1), the peaks showed stretching vibrations of the C–O bond of esters and bending vibrations of methylene group.
The absorptions for T1 (100% vegetable oil) are characteristic to the symmetrical and asymmetrical vibrations (C-H) of the CH2 and CH3 aliphatic groups from the alkyl triglycerides, which are found in large quantities in vegetable oils. Absorption near 2931 cm−1 showed significant index of the degree of unsaturated oil and it can be used for the detection of vegetable oils. Classification of vegetable oil can be made and identification of any foreign oil in pure oil is possible by measuring the absorption intensity near 2931 cm−1 region.
The peaks observed for T2 (10% vegetable oil in butter fat) in the region of 3500–2800 cm−1 are mainly linked with the C–H stretching vibrations. The major difference in the absorption of peaks was observed at ∼3244 cm−1, which is associated with –CC–H stretching groups of cis-unsaturation. These findings proposed that the addition of vegetable oil has been shown to affect the position and intensity of bands due to the presence of unsaturated fatty acids. In T3 (butter adulterated with 20% vegetable oil), significant variations were seen in the spectra with respect to butter and vegetable oil. N–H bending vibrations were observed at 1484 cm−1 but in pure butter sample, no peaks were observed in this region. In the same way, C–H (CH2 and CH3) stretching vibrations and –C=C–H stretching vibration groups of cis-unsaturation also varied in their positions in the adulterated samples which clearly depicts the potential of this method for recording the changes in bond positions in the adulterated samples.
Comparison of FTIR analysis for the butter samples adulterated with 30% vegetable oil (T4) with pure samples showed significant variations in the absorbance values at various positions. The outcomes affirmed that spectra obtained from adulterated butter samples had high absorbance values while the pure butter spectra had high transmittance values. Additionally, spectra for the butter adulterated with 40% vegetable oil (T5) showed variations in C=C–C=O stretching, stretching bond of C-H functional group, bending vibrations of C = O functional group and bond stretching of OH functional group. In T6 (butter adulterated with 50% vegetable oil), variations were observed in functional group (4000–1500 cm−1) and finger print (1400–600 cm−1) regions, new peaks showed changes in the bond stretching C=C, O=C–O–C=O, –C=C–H, N–H, CH3, and HC=CH functional groups. Similar changes were also recorded in T7 (40% butter + 60% vegetable oil). At 1740 cm−1, the signal intensity increased along with increasing the concentration of vegetable oil in butter. This spectral band near to 1740 cm−1 corresponds to the C=O link of aldehydes and ketones and may be correlated with the presence of polyunsaturated fatty acids. Along with the increased contents of vegetable oil in butter, the sample’s absorbance was also increased and indicated that signal received at these frequencies may constitute a criterion for identifying the addition of vegetable oil in butter. Increasing the vegetable oil contents in the mixture increased the intensity of absorption.
Mathematical modeling
The PCA similarities maps defined by the principal components 1 and 2 for FTIR spectra showed that the first two principal components (PCs) accounted for 98% of the total variance with a predominance of component 1 (85%). So, the variance explained by principal component has been increased after removing one outlier. After the removal of outlier from the original dataset, better discrimination of vegetable oil, butter, and adulterated samples was observed. These results showed that the FTIR spectra retained information related to the molecular structure of butter and vegetable oil which allowed the discrimination of samples as a function of adulteration. Similar study was conducted on butter cheese, where the authors tried to find the impact of the replacement of butter oil with soybean oil. The shift of different peaks was observed that identifies the sample discrimination through the PCA.[Citation22]
PLS regression results also confirmed the potential of FTIR spectroscopy for predicting the adulteration of vegetable oil in butter. In first model of PLS regression, full range of FTIR spectra (4000 to 800 cm−1) was used and moderate correlations were observed for different levels of adulteration. The coefficient of determination values for calibration (R2 = 0.88) and validation (R2 = 0.68) described 68% prediction efficiency of FTIR. Additionally, high value of root-mean square error (17.46) also reported the unstability of model. Contrarily, the second PLS regression model described good correlation and revealed that FTIR spectroscopy has potential for accurate calibration up to 95% (R2 = 0.95) and its prediction efficiency for validation is about 90% (R2 = 0.90). These findings show that FTIR spectra coupled with PLS regression can make it possible to predict adulteration of butter with vegetable oil. Different studies were conducted to quantify the adulterant in butter and butter product. One of such studies showed the prediction of adulterant in butter cheese with R2 value of greater than 0.9 with acceptable limit of root mean square error of prediction.[Citation23] In addition to this, butter was also adulterated with chicken fat and lard. Good prediction models with high value of coefficient of determination were found which are in line with the finding of the present study.[Citation5,Citation6]
Conclusion
Results of the current investigation revealed that presence of vegetable oil in butter exhibited significant differences in mid-infrared intensities. This study also affirmed that the proposed technique can be used as a rapid method for the determination of vegetable oil in butter. Additionally, the mathematical models developed after processing of FTIR spectra enable the prediction of adding plant-based fats in butter. Thus, it can be concluded from the present work that FTIR spectroscopy coupled with multivariate analysis can be employed successfully for quantitative determination of adulteration in butter. However, further investigations should be carried out in order to explore the potential of this technique for lower levels of fat adulteration in butter and for the detection of other types of adulterants in dairy products.
Acknowledgments
All authors are thankful to National Institute of Food Science and Technology for allowing work in the laboratory and also to Higher Education Commission of Pakistan for providing funding for research project.
Disclosure statement
No potential conflict of interest was reported by the author(s).
References
- Kamthania, M., Saxena, J., Saxena, K., Sharma, D. K. Milk Adulteration: Methods of Detection &remedial Measures. International Journal of Engineering and Technical Research. 2014, 1, 15–20.
- Karoui, R.; De Baerdemaeker, J.; Araújo, F. R. R. C. D.; da Silva, R. J. A Review of the Analytical Methods Coupled with Chemometric Tools for the Determination of the Quality and Identity of Dairy Products. Food chemistry 2007: 102, 3, 621–640. 10.1007/s00436-007-0797-z
- Mallia, S.; Escher, F.; Schlichtherle-Cerny, H. Aroma-active Compounds of Butter: A Review. European Food Research and Technology 2008. 226: 3 315–325.
- FSAI. Food Safety Authority of Ireland, the Use of Term “Butter”in Labelling and Advertising of Fat Spread Guidance for Food Business 2015. Dublin Ireland: Food Safety Authority of Ireland Abbey Court Lower Abbey Street Dublin.
- Nurrulhidayah, A. F., Rohman, A., Amin, I., Shuhaimi, M., Khatib, A. Analysis of Chicken Fat as Adulterant in Butter Using Fourier Transform Infrared Spectroscopy and Chemometrics. Grasas y Aceites, 2013. 64(4): p. 349–355.
- Nurrulhidayah, A.; Che Man, Y. B.; Amin, I.; Arieff Salleh, R.; Farawahidah, M. Y.; Shuhaimi, M.; Khatib, A. FTIR-ATR Spectroscopy Based Metabolite Fingerprinting as a Direct Determination of Butter Adulterated with Lard. Int. J. Food Prop. 2015, 18(2), 372–379.
- Sadat, A.; Mustajab, P.; Khan, I. A. Determining the Adulteration of Natural Milk with Synthetic Milk Using Ac Conductance Measurement. J. Food Eng. 2006, 77(3), 472–477. DOI: 10.1016/j.jfoodeng.2005.06.062.
- Tian, X.; Wang, J.; Cui, S. Analysis of Pork Adulteration in Minced Mutton Using Electronic Nose of Metal Oxide Sensors. J. Food Eng. 2013, 119(4), 744–749. DOI: 10.1016/j.jfoodeng.2013.07.004.
- Zhu, X.; Li, S.; Shan, Y.; Zhang, Z.; Li, G.; Su, D.; Liu, F. Detection of Adulterants Such as Sweeteners Materials in Honey Using near-infrared Spectroscopy and Chemometrics. Journal of Food Engineering. 2010, 101(1), 92–97.
- Lizhi, H.; Toyoda, K.; Ihara, I. Discrimination of Olive Oil Adulterated with Vegetable Oils Using Dielectric Spectroscopy. J. Food Eng. 2010, 96(2), 167–171. DOI: 10.1016/j.jfoodeng.2009.06.045.
- Kamruzzaman, M.; Makino, Y.; Oshita, S. Rapid and non-destructive Detection of Chicken Adulteration in Minced Beef Using Visible near-infrared Hyperspectral Imaging and Machine Learning. J. Food Eng. 2016, 170, 8–15. DOI: 10.1016/j.jfoodeng.2015.08.023.
- Guillén, M. D.; Cabo, N. Some of the Most Significant Changes in the Fourier Transform Infrared Spectra of Edible Oils under Oxidative Conditions. J. Sci. Food Agric. 2000, 80(14), 2028–2036. DOI: 10.1002/1097-0010(200011)80:14<2028::AID-JSFA713>3.0.CO;2-4.
- Sherazi, S.; Mahesar, S. A.; Bhanger, M. I.; van de Voort, F. R.; Sedman, J. Rapid Determination of Free Fatty Acids in Poultry Feed Lipid Extracts by SB-ATR FTIR Spectroscopy. J. Agric. Food Chem. 2007, 55(13), 4928–4932.
- Dobson, G. Spectroscopy and Spectrometry of lipids—Part 1. Eur. J. Lipid Sci. Technol. 2001, 103(12), 815. DOI: 10.1002/1438-9312(200112)103:12<815::AID-EJLT815>3.0.CO;2-X.
- Cuibus, L., Maggio, R, Muresan , V, Diaconeasa, Z, Pop, O. L., Socaciu, C Preliminary Discrimination of Butter Adulteration by ATR-FTIR Spectroscopy. Bulletin of University of Agricultural Sciences and Veterinary Medicine Cluj-Napoca-Food Science and Technology. 2015, 72(1), 70–76.
- Koca, N., Kocaoglu-Verma, N.A., Harper, W.J., Rodriguez-Soana, L.E. Application of temperature-controlled Attenuated Total reflectance-mid-infrared (ATR-MIR) Spectroscopy for Rapid Estimation of Butter Adulteration. Food Chemistry. 2010. 121(3): p. 778–782.
- Kumar, A.; Ghai, D. L.; SETH, R.; SHARMA, V. Apparent Solidification Time Test for Detection of Foreign Oils and Fats Adulterated in Clarified Milk Fat, as Affected by Season and Storage. Int. J. Dairy Technol. 2009, 62(1), 33–38.
- Seo, H.-Y.; Ha, J.; Shin, D.-B.; Shim, S.-L.; No, K.-M.; Kim, K.-S.; Lee, K.-B.; Han, S.-B. Detection of Corn Oil in Adulterated Sesame Oil by Chromatography and Carbon Isotope Analysis. J. Am. Oil Chem. Soc. 2010, 87(6), 621–626.
- Bertrand, D.; Vigneau, E. Chimiométrie appliquée à la spectroscopie infrarouge. Prétraitement des données spectrales. In La Spectroscopie Infrarouge Et Ses Applications Analytiques. Lavoisier, Paris (FRA); Collection Sciences Et Techniques Agroalimentaires; Bertrand, D., Dufour, É. (France: Inrae); Eds., 2006; 427–447.
- Williams, P. C.; Norris, K. Near Infrared Technology in the Agricultural and Food Industries, 2nd ed.; St. Paul; American Association of Cereal Chemists, Inc: Minnesota, USA, 2001.
- Kumar, A.; Lal, D.; SETH, R.; SHARMA, V. Detection of Milk Fat Adulteration with Admixture of Foreign Oils and Fats Using a Fractionation Technique and the Apparent Solidification Time Test. Int. J. Dairy Technol. 2010, 63(3), 457–462.
- Gahlawat, S., Kumari , S, Boora, N, Sharma, Y.V.R.K . Screening of Adulterants in the Milk and Dairy Products of Delhi region—a Case Study. Int. J. Pharm. Technol. 2012, 4(4), 4889–4897.
- Leite, A. I. N.; Pereira, C. G.; Andrade, J.; Vicentini, N. M.; Bell, M. J. V.; Anjos, V. FTIR-ATR Spectroscopy as a Tool for the Rapid Detection of Adulterations in Butter Cheeses. Lwt. 2019, 109, 63–69. DOI: 10.1016/j.lwt.2019.04.017.