
ABSTRACT
Licorice is a product with the same origin as medicine and food and is widely used in traditional Chinese medicine and the food, cosmetics and tobacco industries. With the increasing demand for licorice in the herbal market, there is also increasing concern about complex varieties and quality deterioration. Considering the importance of the quality and safety of commercial licorice products, we used DNA barcoding, HPLC and colorimetry to distinguish and evaluate commercial licorice products. Here, 52 samples could be accurately identified into three kinds of licorice, Glycyrrhiza uralensis Fisch. (Gu), Glycyrrhiza inflata Bat. (Gi) and Glycyrrhiza glabra L. (Gg), by internal transcribed spacer (ITS) and trnH-psbA sequences. Among them, the S27 sample was identified as Gi but had been incorrectly labeled as Gg. Based on HPLC combined with stoichiometric analysis, the contents of liquiritin, glycyrrhizic acid and isoliquiritin contents were significantly different between Gu and Gg, and Gi and Gg showed significant differences only in isoliquiritigenin content. The chemical components and color difference parameters showed that isoliquiritigenin had a significant correlation with the color parameter b*. The above results show that DNA barcoding can quickly and accurately distinguish species, but it cannot provide data on metabolites or other quality information beyond the plant raw materials. Techniques that combine of DNA barcoding, HPLC and colorimetry can more easily distinguish and evaluate the types and quality of commercial licorice products. This study provides good data support for the safety and quality of licorice in the Chinese market.
Introduction
Licorice is a very ancient Chinese medicine with a long history in medicine.[Citation1] In addition, licorice is also widely used in food, tobacco, chemical and other fields. Modern studies have shown that medicinal licorice contains a variety of active ingredients that have pharmacological effects such as antioxidant, anti-inflammatory, antiviral, and antidiabetic effects.[Citation2–4] Licorice varieties are widely distributed in Northwest China. Among them, Glycyrrhiza uralensis Fisch. (Gu), Glycyrrhiza inflata Bat.(Gi) and Glycyrrhiza glabra L.(Gg) are included in the 2020 edition of the Chinese Pharmacopoeia.[Citation5] Currently, the use of commercial licorice is confusing, with three types of licorice being used interchangeably. Previous studies have shown that the pharmacodynamic components of different varieties of licorice are different.[Citation6] This requires that they should be used differently in clinical practice, and thus the guarantee of authenticity is very important for the quality control of licorice. Therefore, there is an urgent need to establish a rapid identification and quality evaluation method for medicinal licorice.
The current identification methods of commercial licorice are usually characteristic identification, microscopic identification, and physical and chemical identification.[Citation7] However, these are easily affected by the origin and storage conditions of the samples.[Citation8] DNA barcodes are standard short genome sequences that can be used to identify species efficiently and conveniently,[Citation9] which have emerged as an effective tool in the identification of plant, animal, and microorganisms.[Citation10–17] Nuclear rDNA in plants, such as ITS, and chloroplast DNA, such as trnH-psbA, can better distinguish closely related species.[Citation16,Citation18] These two are preferred regions for species identification,[Citation19] and the combination of the two can eliminate the problem of gene deletion caused by identification failure or low PCR amplification yield.
The 2020 edition of the Chinese Pharmacopoeia describes liquiritin and glycyrrhizic acid as marker compounds for the quality control of licorice, but the multi-index evaluation of the quality of medicinal materials has become the mainstream trend.[Citation20] Therefore, the detection of multiple components in licorice can comprehensively evaluate the quality of licorice. Traditional identification methods include assessment of the root bark color, which can distinguish Gu from Gi and Gg; the root bark of Gu is reddish-brown, while that of Gg and Gi can be yellow-brown.[Citation8] However, traditional color identification has subjectivity and errors. At present, colorimetric methods are being used more frequently because they can directly quantitate colors. This method has been applied in tea,[Citation21] honeysuckle,[Citation22] and betel nut.[Citation23] Therefore, colorimetric measurement is expected to be an effective method for identifying medicinal licorice. The combination of chromatographic methods and colorimetric methods can verify results from different research groups and provide a method for establishing a quick, convenient and accurate evaluation of licorice quality.
To clarify the genetic, chemical and color differences of licorice in the traditional Chinese medicine market, we established an efficient and convenient method of DNA barcoding, combining the use of ITS and trnH-psbA, and HPLC combined with colorimetry to accurately identify and evaluate commercial licorice. The results provided detailed information about licorice safety and efficacy, which are important for quality control.
Materials and methods
Plant material
Licorice varieties are widely distributed in Northwest China. We collected 52 pieces of licorice from the licorice supply chain, including farmers markets, and pharmacies from Inner Mongolia, Xinjiang, Gansu, Ningxia, Shaanxi and Shanxi in the entire distribution range. shows the specific sample information.
Table 1. The specific sample information in the study.
Chemicals and reagents
The acetonitrile and formic acid used in sample preparation were both HPLC‒MS grade (Thermo Fisher Scientific, Shanghai, China). Liquiritin (lot: Z13J11X108109), liquiritigenin (lot: Z20J8X402650), isoliquiritigenin (lot: C03A8Q41092), isoliquiritin (lot: N16GB168197), and glycyrrhizic acid (lot: Y02J11L113432) were purchased from Shanghai Yuanye Co., Ltd., with a purities of more than 98%.
DNA extraction and PCR amplification
The Plant Genomic DNA Extraction kit (Tiangen, Biotech, Beijing, China) was used for extraction according to the kit instructions for 20 mg samples. The relative purity and concentration of extracted DNA were checked by a NanoDrop 2000. Primers for ITS and trnH-psbA were used. The ITS primer sequences were: 5 F:5’-GGAAGTAAAAGTCGTAACAAGG-3’ and 4 R:5’-TCCTCCGCTTATTGATATGC-3’. The trnH-psbA primer sequences were: psbA:5’-GTTATGCATGAACGTAATGCTC-3’ and trnH:5’-CGCGCATGGTGGATTCACAATCC-3’. The PCR conditions for ITS were 94°C for 5 min, 94°C for 1 min, 50°C for 1 min, 72°C for 1 min for 33s, 30 cycles, and 72°C for 10 min. The PCR amplification conditions of trnH-psbA were 95°C for 1 min, 95°C for 30s, 58°C for 1 min, 72°C for 30s, 35 cycles, 72°C for 10 min. The PCR amplification reaction was 20 µL (DNA template: 2 µL; forward and reverse primers: 1 µL; enzyme: 15 µL; ddH2O: 11 µL). All reactions were carried out on a Veriti thermal cycler (Applied Biosystems, USA). The PCR products were detected in a 1% agarose gel and then sent to Shenggong Co., Ltd. (Sangong Biotech, Shanghai, China) for sequencing. We used the Bupleurum sample as a positive control during DNA extraction and PCR amplification to rule out contamination errors during the experiment.
HPLC analysis
A total of 0.2 g of licorice powder was placed into a 100 mL conical flask with a stopper, to which 50 mL of 70% ethanol was added, followed by precise weighing. After sonication for 30 min, the weight loss was compensated with 70% ethanol. To prepare the control solution, reference standards of liquiritin, liquiritigenin, isoliquiritigenin, isoliquiritin and glycyrrhizic acid were added to methanol to make a mixed control solution (0.113 mg/mL, 0.033 mg/mL, 0.049 mg /mL, 0.066 mg/mL and 0.267 mg/mL, respectively). All solutions were filtered through a 0.45 μm filter membrane before injection to the HPLC system.
Dual wavelength HPLC detection was performed according to procedures previously described in the literature.[Citation24] Mobile phase: acetonitrile (A) – 0.05% phosphoric acid water (B); gradient elution: 0–8 min, 20% A; 8–30 min, 20%-35% A; 30–35 min, 35%-45%A; 35–50 min, 55% A. The detection wavelength was set to 237 nm for liquiritin, liquiritigenin and glycyrrhizic acid, and 365 nm for isoliquiritin and isoliquiritigenin. The flow rate was 1.0 mL/min, the column temperature was 30°C, and the injection volume was 10 μL. Each sample was assessed with 3 replicates.
Color difference analysis
The color difference of licorice was measured on a CM-5 UV‒Vis spectrophotometer (Konica Minolta Japan). Color parameters L*, a*, b* were obtained, where L* represented the lightness of the sample, 0–100 represented the color from black to white, a* represented red‒green (where positive values indicated red and negative values indicated green), and b* represented yellow‒blue color (where positive values indicated yellow and negative values indicated blue). ΔE*ab, which represented the color difference, was calculated according to the equation, ΔE*ab = {(ΔL*)2+(Δa*)2+(Δb*)2}1/2. Blackboard and whiteboard were used for color correction. We used 2 g samples that were evenly spread in the colorimetric dish for measurement. White paper was used as a blank sample. Before the sample determination, we conducted an instrument precision inspection. All samples were measured and recorded at room temperature (25 ± 1°C),[Citation21] and each sample was assessed with 3 replications.
Data analysis
To acquire the DNA sequence, ContigExpress software was used to splice the two-way sequencing peak map and remove the weak or overlapped peak regions at both ends. DNAMAN software was used to align the sequences obtained and analyze the relatively specific sites. MEGA software was used to construct an N-J tree based on standard parameters with bootstrap testing of 1000 replicates. These sequences were aligned with the GenBank database reference. The data obtained by HPLC and colorimetric measurement were analyzed by nonparametric tests, one-way ANOVA and correlation analysis with SPSS 24.0 software. Principal component analysis (PCA) and hierarchical clustering analysis (HCA) were performed using SIMCA.
Results
DNA barcoding analysis
Molecular identification of the samples was carried out using the nuclear gene ITS and the chloroplast gene trnH-psbA. The length of the obtained ITS sequence was approximately 700 bp, and the length of the trnH-psbA sequence was approximately 300 bp (the specific DNA sequence is provided in the supplementary material). In the ITS sequence, the interspecific distances between Gu and Gg and between Gu and Gi were 1.054 and 0.009, respectively, while the distance between Gg and Gi was 1.069. We identified the collected samples according to the following identification process after DNAMAN analysis. For the ITS sequence, the bases GCA at 244–246 bp of the variation site and the base G at 470 bp of Gu were used for accurate identification (the Blast tool from the National Center for Biotechnology Information (NCBI)was used to compare the homology with other species, the ITS sequence showed that Gu was consistent with the registered Gu sequence, GenBank: KX530461.1, with a sequence similarity of 100%, while the rest were consistent with Gg and Gi sequences, GenBank: MH645772.1, KY860932.1). For the trnH-psbA sequence, base A at 227 bp, base T at 273 bp, and base A at 326 bp were used to accurately identify Gg (Gg was consistent with the Gg sequence registered in NCBI, GenBank: KU356139.1) (). We combined ITS and trnH-psbA to analyze the 52 samples obtained by the N-J tree (Figure S1), and the results showed that these 52 samples represented all three kinds of medicinal licorice specified in the 2020 edition of the Chinese Pharmacopoeia, namely Glycyrrhiza uralensis Fisch. (Gu), Glycyrrhiza inflata Bat. (Gi) and Glycyrrhiza glabra L.(Gg)(). Among them, S27 should be labeled as Gi after analysis, but was incorrectly labeled as Gg. The above results also demonstrated that ITS combined with trnH-psbA successfully and accurately differentiated licorice commercial products.
Figure 1. ITS and trnH-psbA sequence identification and analysis process of 52 samples.
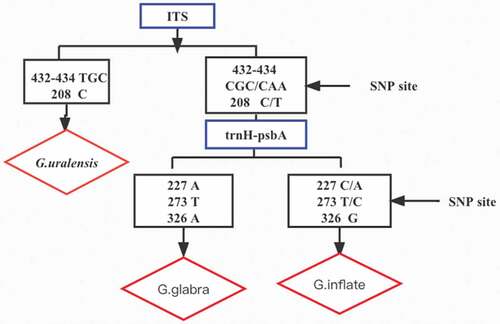
Table 2. 52 licorice identification results.
Chemical composition analysis
Five hallmark compounds of licorice were identified using reference standards of liquiritin, liquiritigenin, glycyrrhizic acid, isoliquiritin, and isoliquiritigenin and compared with results from the literature.[Citation24] The HPLC method was verified by determining the linearity range, precision, and repeatability. The obtained results and representative HPLC chromatograms of the samples are shown in Supplementary Table S1 and Figure S2. All these results indicated that the HPLC method was suitable for the analysis of components in licorice samples. All samples were tested, and the results showed that there were differences in the content of different species of licorice. Gu showed a higher content of the 5 components than the other two types of licorice. In terms of glycyrrhizic acid content, the average content in Gu was 3.52%, followed by 2.52% in Gi, and 2.19% in Gg. The 2020 edition of the Chinese Pharmacopoeia stipulated that the content of glycyrrhizic acid in licorice should not be less than 2%, and that the content of liquiritin should not be less than 0.5%. Among the 52 samples of glycyrrhizic acid, 1 sample of Gu (S18), 4 samples of Gi (S27,S35,S37 and S39), and 6 samples of Gg (S40,S41,S43,S49,S51and S52) did not meet these requirements. Ten samples of Gu (S3,S8,S9,S11,S15,S17,S18,S20,S24 and S25), 8 samples of Gi (S27,S32,S34,S35,S36,S37,S38 and S39), and 9 samples of Gg (S40,S43,S45,S46,S47,S48,S49,S50 and S51) were less than standard (Supplementary Table S2).
HPLC-based stoichiometric analysis
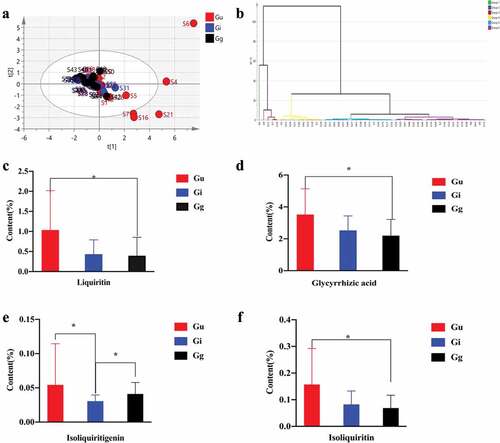
We first performed principal component analysis for these 5 landmark compounds. PCA is a multivariate analysis method that visualizes similarities or differences in multivariate data.[Citation14,Citation25] The cumulative plot showed that the three licorice species did not form different clusters according to their original species (), that is, there was no clear grouping. PCA showed that it was difficult to distinguish licorice samples. Next, we used hierarchical cluster analysis. HCA is an unsupervised pattern recognition method that groups datasets based on similarity by creating cluster books.[Citation26,Citation27] The results showed that all samples were divided into 6 groups, however, the samples in each group were chaotic (), indicating that HCA was not good at distinguishing the three varieties of licorice. To further confirm the degree of difference between the three kinds of licorice, we conducted a nonparametric test and found that there was no significant difference in the content of liquiritigenin in the 52 samples (Figure S3). There was a significant difference in liquiritin (), glycyrrhizic acid () and isoliquiritin () in Gu and Gg (p <0 .05). The Gi and Gg only showed significant differences in isoliquiritigenin (), and the other four components were not significantly different. The Gu and Gi only showed significant differences in isoliquiritigenin ().
Figure 2. Stoichiometric analysis of 5 landmark compounds based on HPLC (a: PCA analysis; b: HCA analysis; c: Liquiritin content of three kinds of licorice; d: Glycyrrhizic acid content of three kinds of licorice; e: Isoliquiritigenin among the three kinds of licorice; f: Isoliquiritin among the three kinds of licorice.).
Chromaticity analysis
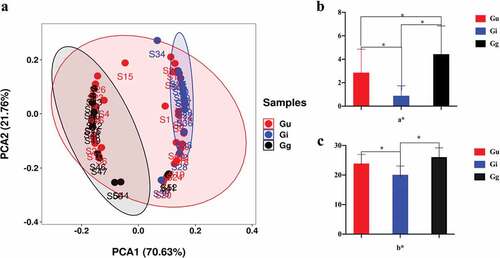
The color difference data were obtained by colorimetric analysis of the 52 samples. The distribution of lightness L* values of the three species was as follows: Gu: – 27.77~-1.62, Gi: – 12.03 ~ 2.49, and Gg: – 29.34 ~ 6.11. Red and green a* values were as follows: Gu: – 0.55 ~ 7.58, Gi: – 0.49 ~ 1.93, and Gg: 0.60 ~ 8.57. Yellow-blue b* values were as follows: Gu: 16.16 ~ 29.18, Gi: 14.35 ~ 25.90, and Gg: 21.25 ~ 31.30 (Supplementary Table S3). We used PCA analysis to compare the color differences among Gu, Gi and Gg, using ΔE*ab, L*, a*, and b* values as input. The PCA score graph showed () that Gg and Gi were able to cluster together independently. However, Gu was scattered. In other words, the color difference could distinguish Gg and Gi, but not Gu. Considering that licorice is often described as “skin red and yellow”(Figure S4), we further analyzed the difference between the two indicators a* (red-green direction) and b* (yellow-blue direction) with t-test. The three groups of different samples had significant differences at the a* level (), and at the b* level, there were significant differences in the color difference between Gu and Gi, and between Gi and Gg, while there was no significant difference between Gu and Gg (). The above results also showed that three kinds of licorice can be distinguished with a*. Overall, combined with the PCA results, Gi and Gg were clearly distinguishable.
Figure 3. Analysis of chromaticity parameters of 52 samples (a: PCA analysis of chromaticity parameters; b: Difference in a* level of three kinds of licorice; c: Difference in b* level of three kinds of licorice).
Correlation analysis of chemical composition and color difference
We analyzed the correlation between chemical composition and color difference. Pearson’s correlation test was performed with 5 landmark compounds using color difference parameters. The results showed that isoliquiritigenin was significantly correlated with the color difference parameter b* (P = 0.034). Based on this, we analyzed isoliquiritigenin and b* by linear regression method, the R2 of the model was 0.087, and the F test (F = 4.777, p <0 .05) indicated that the change of b* would have a significant effect on the content of isoliquiritigenin. We finally established a simple regression model: isoliquiritigenin = 0.004 b* −0.038. This showed that a good correlation was established between the color parameters and the content of the marker compounds. We could quickly predict the content of isoliquiritigenin components through the color parameters. In addition, this also showed that the determination of color was expected to be used as a surrogate index for evaluating chemical composition changes, which also provided a new reference for the identification of licorice varieties.
Discussion
Licorice is a Chinese herbal medicine commonly used in China in large amounts. In pursuit of profit, commercial licorice circulation has become chaotic. Current commercial licorice may be contaminated or substituted in some way, making correct plant identification difficult. For clinical safety, molecular analysis is very important for the accurate and rapid identification of plants. The purpose of DNA barcoding is to address a wide range of questions in taxonomy, molecular phylogeny, population genetics, and to monitor product authenticity.[Citation11,Citation28,Citation29] Previous work by predecessors established a relatively complete system for the identification of medicinal licorice.[Citation30] However, it was surprising that when we collected commercial licorice samples in the early stage, we found that there was indeed a germplasm disorder in the licorice supply chain. Therefore, we wanted to evaluate the authenticity of 52 pieces of licorice from the supply chain using DNA barcoding. The results showed that the combination of the two sequences could accurately identify the samples. This is consistent with previous reports.[Citation30] This also showed that ITS and trnH-psbA were two barcode-related authentications that were more convincing.[Citation31] In addition, we also tested other universal primers for chloroplast-rbcL, and found that its identification ability was not very good. Therefore, we speculate that the three licorice germplasms are seriously mixed and that manual intervention is required to ensure the genetic diversity of licorice. Our analysis of the results also showed that the label of a commodity obtained from the market was incorrect, which indicated that there is a need to increase supervision in the market and that the method of DNA barcoding can be applied for the quality control of traditional Chinese medicine products to ensure the authenticity of herbal products. This study was mainly based on paternal inheritance for identification and analysis. Considering the complex hybridization of licorice varieties and the increasingly complex licorice market, more molecular molecular marker technologies should be combined to supplement the molecular identification results.
Chromatographic analysis combined with chemometric analysis can reveal chemical taxonomic correlations between species.[Citation32] The chemical identification components showed different contents in different samples, which is also related to the complexity of clinical licorice medication. For example, licorice of different origins and form different years are combined in medicinal materials and decoction pieces and their contents. In this study, we found that the licorice herbs and decoction pieces collected on the market still have the problem that the content of glycyrrhizic acid and liquiritin contents does not meet the standards of the 2020 edition of the Chinese Pharmacopoeia(the content of glycyrrhizic acid in licorice should not be less than 2%, and that the content of liquiritin should not be less than 0.5%), which will seriously affect the clinical efficacy. In addition, the PCA analysis and HCA analysis results of the chemical components showed that there was no good clustering or distinction. This reason is largely due to the complexity of commercial licorice, as the sources are different in different regions and growth times. This also reflects the phenomenon of market confusion and the uneven quality of commercial licorice products, which is of great significance to the quality evaluation of licorice, and further market supervision and management are required in the future.
The color measurement of licorice herbs is also a parameter for evaluating herbs and is related to the quality and authenticity of the herbs. Based on the literature, there is a close correlation between the labeling ingredients and the color of the medicinal material.[Citation22,Citation33] Our results showed that the content of isoliquiritigenin had a significant correlation with the b* value of the color difference parameter, which also preliminarily indicates that the color parameter can be used as a standard for identifying and evaluating the quality of medicinal materials in the medicinal material market. In other words, the color parameters of commercially available licorice herbs and decoction pieces can quickly predict the content of isoliquiritigenin. However, due to the influence of many factors, such as the variety of medicinal materials, storage time, processing methods, etc., the relationship between color and chemical composition cannot be determined.[Citation34,Citation35] For example, honey licorice is usually made by adding honey to licorice pieces and frying them, which will lead to significant change or loss of the color and chemical composition of the licorice.[Citation36] In addition, different environmental factors also affect the color of licorice, and it is necessary to expand the sample size to study how the environment affects the color of licorice.
This study shows that the combination of DNA barcoding, HPLC and colorimetry, with the use of chemometrics (e. g. independent T test, one-way ANOVA, Pearson correlation, PCA, HCA analysis), can enable the accurate identification and evaluation of commercially available licorice. DNA barcoding, especially the combination of nuclear rDNA and chloroplast fragments, can quickly and accurately distinguish species, and the content of independent chemical identification components and color difference cannot play an effective role in identifying commercially available licorice herbs and decoction pieces. Since DNA barcoding cannot provide information about metabolites and other quality information of plant raw materials, combining it with HPLC stoichiometric analysis and colorimetric analysis allows us to comprehensively evaluate the quality of licorice. In addition, chromatography and colorimetric methods can be carried out quickly and easily, and the results can complement each other, which fully demonstrates the reliability of this method. In the future, it is more recommended to use the DNA barcoding and then HPLC combined with chemometrics and colorimetry to carry out a rapid identification evaluation of licorice in the licorice supply-chain. The strategy developed in this study provides a strong clue for the comprehensive evaluation of the quality of other commercially available samples.
Authors’contributions
TL, NZ and DJ participated in data analysis and prepared the manuscript. TL, ZQ, ML and RG conducted the experiments. DJ and CL participated in the design of the study and revised the manuscript. All authors read and approve the final manuscript.
Supplemental Material
Download ()Acknowledgments
We thank Haiyan Xu for providing some experimental samples.
Disclosure statement
No potential conflict of interest was reported by the author(s).
Supplementary material
Supplemental data for this article can be accessed online at https://doi.org/10.1080/10942912.2022.2158861
Additional information
Funding
References
- Hayashi, H.; Sudo, H. Economic Importance of Licorice. Plant Biotechnol. 2009, 26(1), 101–104. DOI: 10.5511/plantbiotechnology.26.101.
- Wang, Z. F.; Liu, J.; Yang, Y.A.; Zhu, H.L. A Review: The Anti-inflammatory, Anticancer and Antibacterial Properties of Four Kinds of Licorice Flavonoids Isolated from Licorice. Curr. Med. Chem. 2020, 27(12), 1997–2011.
- Yang, R.; Wang, L.Q.; Yuan, B.C.; Liu, Y. The Pharmacological Activities of Licorice. Planta Med. 2015, 81(18), 1654–1669.
- Yang, L.; Jiang, Y.; Zhang, Z.X.; Hou, J.M.; Tian, S.K.; Liu, Y. The anti-diabetic Activity of Licorice, a Widely Used Chinese Herb. J. Ethnopharmacol. 2020, 263,113216.
- Commission, C. P. Pharmacopoeia of the People’s Republic of China; China Medical Science Press: Beijing, 2020.
- Zhu, Z. H.; Tao, W.W.; Li, J.P.; Guo, S.; Qian, D.W.; Shang, E.X.; Su, S.L.; Duan, J.A. Rapid Determination of Flavonoids in Licorice and Comparison of Three Licorice Species. J. Sep. Sci. 2016, 39(3), 473–482.
- Xie, X. T.; Li, X.; Chen, W. D.; Peng, C.; Zhu, G. Y. Pharmacognostical Study on Scoparia Dulcis L. J ANHUI Unier Chin Med. 2019, 38, 85–88.
- Liu, T.Three cultivated licorice genetic diversity and secondary metabolite content research; Gansu: Gansu Agricultural University, 2011 .
- Gao, Z. T.; Liu, Y.; Wang, X.Y.; Wei, X.M.; Han, J.P. DNA Mini-Barcoding: A Derived Barcoding Method for Herbal Molecular Identification. Front. Plant Sci. 2019, 10. DOI: 10.3389/fpls.2019.00010
- Zhong, Y. C.; Wang, H.; Wei, Q.; Cao, R.; Zhang, H.; He, Y.; Wang, L. Combining DNA Barcoding and HPLC Fingerprints to Trace Species of an Important Traditional Chinese Medicine Fritillariae Bulbus. Molecules. 2019, 24(18), 3269.
- Xu, H. Y.; Li, P.; Ren, G.X.; Wang, Y.J.; Jiang, D.; Liu, C.S. Authentication of Three Source Spices of Arnebiae Radix Using DNA Barcoding and HPLC. Front Pharmacol 2021, 12, 677014.
- Song, X. N.; Li, Y.P.; Xu, G.J.; Liu, C.S.; Liu, Y.; Zhang, X.Q.; Liu, Y.; Liu, S.Q.; Gu, X. Identification of Notoginseng Powder Based on Similarity to “DNA Barcoding Core-genotype.” Mitochondrial DNA Part A. 2017, 28(3), 355–357. DOI: 10.3109/19401736.2015.1122777
- Xu, G. J.; Liu, C.S.; Liao, C.L.; Ren, X.L.; Zhang, X.Y.; Fu, X.R.; Wang, X.Y. Rapid and Accurate Identification of Adulterants via an Electronic Nose and DNA Identification Platform: Identification of Fake Velvet Antlers as an Example. J. Sens. 2016, 1830843.
- Li, Y. P.; Geng, L.; Liu, Y.Y.; Chen, M.Y.; Mu, Q.R.; Zhang, X.; Zhang, Z.Y.; Ren, G.X.; Liu, C.S. Identification of Three Daphne Species by DNA Barcoding and HPLC Fingerprint Analysis. Plos One.2018, 13(8), e0201711 .
- Luo, X. M.; Li, H.X.; Jiang, D.; Meng, J.Q.; Zhang, F.; Xu, Q; Chen, X.F.; Liu, C.S.; Yang, Y.J. Analysis of Fungi on Coix (Coix lacryma-jobi) Seed and the Effect of Its Aqueous Extract on the Growth of Aspergillus Flavus. J. Food Prot. 2019, 82(10), 1775–1782.
- Li, S. Z.; Zeng, S.L.; Wu, Y.; Zheng, G.D.; Chu, C.; Yin, Q.; Chen, B.Z.; Li, P.; Lu, X.; Liu, E.H. . Cultivar Differentiation of Citri Reticulatae Pericarpium by a Combination of Hierarchical three-step Filtering Metabolomics Analysis, DNA Barcoding and Electronic Nose. Anal. Chim. Acta. 2019, 1056, 62–69. DOI: 10.1016/j.aca.2019.01.004.
- Liu, Y. X.; Zhang, M.; Chen, X.; Chen, X.; Hu, Y.; Gao, J.; Pan, W.; Xin, Y.; Wu, J.; Du, Y. . Developing an Efficient DNA Barcoding System to Differentiate between Lilium Species. BMC Plant Biol. 2021, 21(1), 13.
- Kress, W. J.; Wurdack, K.J.; Zimmer, E.A.; Weight, L.A.; Janzen, D.H. Use of DNA Barcodes to Identify Flowering Plants. 2005. 102(23), 8369–8374.
- Islam, S. U.; Dar, T.U.H.; Khuroo, A.A.; Bhat, B.A.; Mangral, Z.A.; Tariq, L.; Tantray, W.W.; Malik, A.H. DNA Barcoding Aids in Identification of Adulterants of Trillium Govanianum Wall. Ex D. Don. J. Appl. Res. Med. Aromat. Plants. 2021, 23,100305.
- Sanchez, M.; González-Burgos, E.; Divakar, P. K.; Gómez-Serranillos, M. P. DNA-Based Authentication and Metabolomics Analysis of Medicinal Plants Samples by DNA Barcoding and Ultra-High-Performance Liquid Chromatography/Triple Quadrupole Mass Spectrometry (UHPLC-MS). Plants-Basel 2020, 9(11).doi:10.3390/plants9111601
- Huang, D. Y.; Qiu, Q.L.; Wang, Y.M.; Wang, Y.; Lu, Y.T.; Fan, D.M.; Wang, X.C. Rapid Identification of Different Grades of Huangshan Maofeng Tea Using Ultraviolet Spectrum and Color Difference. Molecules. 2020, 25(20), 11.
- Li, J. J., Lian, X.Y., Ye, C.L., Wang, L. Analysis of Flower Color Variations at Different Developmental Stages in Two Honeysuckle (Lonicera Japonica Thunb.) Cultivars. Hortscience. 2019, 54(5), 779–782.
- Sun, M.; Yan, D.H.; Yang, X.L.; Xue, X.Y.; Zhou, S.J.; Liang, S.W.; Wang, S.M.; Meng, J. Quality Assessment of Crude and Processed Arecae Semen Based on Colorimeter and HPLC Combined with Chemometrics Methods. J. Sep. Sci. 2017, 40(10), 2151–2160.
- Qiao, J.; Luo, Z.L.; Li, Y.P.; Ren, G.X.; Liu, C.S.; Ma, X.J. Effect of Abscisic Acid on Accumulation of Five Active Components in Root of Glycyrrhiza Uralensis. Molecules. 2017, 22(11), 1982.
- Patel, N. D.; Kanaki, N. S. Fingerprint Analysis of Shankhpushpi for Species Discrimination by HPLC Coupled with Chemometric Methods. J. Liq. Chromatogr. Relat. Technol. 2020, 43(13–14), 455–463. DOI: 10.1080/10826076.2020.1728695.
- Zhuo, Z. H.; Xu, D.P.; Li, Y.P.; Pu, B.; Ye, M. Fingerprint Analysis of Zanthoxylum Armatum DC. by HPLC. J. Food Compost. Anal. 2021, 96,103736.
- Wang, Q. L.; Wu, X.; Yang, X.D.; Zhang, Y.; Wang, L.N.; Li, X.X.; Qiu, Y. Comprehensive Quality Evaluation of Lignum Caraganae and Rapid Discrimination of Caragana Jubata and Caragana Changduensis Based on Characteristic Compound Fingerprints by HPLC-UV and HPLC-MS/MS Coupled with Chemometrics Analysis. Phytochem. Anal. 2020, 31(6), 846–860.
- Jiang, L. L.; Zhou, B.C.; Wang, X.Q.; Guo, W.F.; Wang, J.H.; Yao, R.Y.; Li, M.H. The Quality Monitoring of Cistanches Herba (Cistanche Deserticola Ma): A Value Chain Perspective. Front. Pharmacol. 2021, 12, 782962.
- Brunakova, K.; Balintova, M.; Henzelyova, J.; Kolarcik, V.; Kimakova, A.; Petijova, L.; Cellarova, E. Phytochemical Profiling of Several Hypericum Species Identified Using Genetic Markers. Phytochemistry. 2021, 187,112742.
- Yang, R.; Li, W. D.; Ma, Y. S.; Zhou, S.; Xue, Y. T.; Lin, R. C.; Liu, Y. The Molecular Identification of Licorice Species and the Quality Evaluation of Licorice Slices. Acta Pharm Sin 2017, 52(2), 318–326.
- Zhang, M. T.; Shi, Y.H.; Sun, W.; Wu, L.; Xiong, C.; Zhu, Z.H.; Zhao, H.F.; Zhang, B.L.; Wang, C.X.; Liu, X. An Efficient DNA Barcoding Based Method for the Authentication and Adulteration Detection of the Powdered Natural Spices. 2019, Food Control, 106,106745.
- Doh, E. J.; Lee, G.; Jung, H.J.; Kwon, K.B.; Kim, J.H. Chemotaxonomic Monitoring of Genetically Authenticated Amomi Fructus Using High-Performance Liquid Chromatography-Diode Array Detector with Chemometric Analysis. Molecules. 2020, 25(19), 4581.
- Patsilinakos, A.; Ragno, R.; Carradori, S.; Petralito, S.; Cesa, S. Carotenoid Content of Goji Berries: CIELAB, HPLC-DAD Analyses and Quantitative Correlation. Food Chem. 2018, 268, 49–56. DOI: 10.1016/j.foodchem.2018.06.013.
- Liu, X.; Zhang, Y.; Wu, M.; Ma, Z.; Cao, H. Colorimetric Parameters Correlated with the Variation in the Marker Constituent Contents during the Stir-fry Processing of Schizonepetae Spica. Food Anal. Methods. 2022,15(5),1300-1309.
- Goisser, S.; Wittmann, S.; Fernandes, M.; Mempel, H.; Ulrichs, C. Comparison of Colorimeter and Different Portable Food -scanners for Non- Destructive Prediction of Lycopene Content in Tomato Fruit. Postharvest. Biol. Technol. 2020, 167,111232.
- Ota, M.; Xu, F.; Li, Y.L.; Shang, M.Y.; Makino, T.; Cai, S.Q. Comparison of Chemical Constituents among Licorice, Roasted Licorice, and Roasted Licorice with Honey. J. Nat. Med. 2018, 72(1), 80–95.