
 ?Mathematical formulae have been encoded as MathML and are displayed in this HTML version using MathJax in order to improve their display. Uncheck the box to turn MathJax off. This feature requires Javascript. Click on a formula to zoom.
ABSTRACT
This study aimed to determine the integrated freshness index (IFI) of eggs using Vis-NIR spectroscopy and optimized support vector regression, which gave the first insight into the freshness quality of eggs from the biochemical essence of quality changes. In this work, Vis-NIR transmission spectra of brown-shell and pink-shell egg samples were analyzed between 500 nm and 900 nm. Standard normal variables (SNV) were used to normalize the spectral data, and the Shuffled Frog Leaping Algorithm (SFLA) and Competitive Adaptive Reweighted Sampling (CARS) were used to choose the optimal wavelengths. The quantitative analysis model of IFI was developed using a support vector regression (SVR) that was optimized using Grid Search (GS), Genetic Algorithm (GA), and Particle Swarm Optimization (PSO). After conducting a comparative analysis, it was determined that the GA-SVR model based on 63 wavelengths screened by the SFLA best predicted IFI with a training set coefficient of determination (Rc2) of 0.900, root means square error (RMSEC) of 0.005, a prediction set coefficient of determination (Rp2) of 0.816, root mean square error (RMSEP) of 0.012 and relative analysis error (RPD) of 2.077. The results demonstrate that the model can be used to simultaneously perform nondestructive detection of two distinct egg IFI variants, suggesting broader applicability and enhanced model reliability.
Introduction
Eggs are one of the highest-quality sources of protein in the diet, but their internal changes during storage due to many factors such as feed, temperature, humidity, transport and storage conditions, and time.[Citation1] As storage duration lengthens, egg quality decreases, which has a significant impact on their nutritional and commercial value. As egg production expands and becomes more industrialized, the enhancement of egg quality has become a top priority, and the testing of egg quality cannot be neglected.
Eggs are rich in various nutrients and are one of the most important food sources for providing nutrition to humans. The nutrient content of eggs from different breeds, breeding methods, and individual poultry varies considerably.[Citation2] And the chemical changes during natural egg quality decline are a complex process. The relative mass fraction of S-ovalbumin in egg whites during storage increased from 5% in newly laid eggs to 81% after 6 months of refrigeration.[Citation3] The results of our previous study revealed a high correlation between S-ovalbumin and storage time and common indicators of egg freshness,[Citation4] and the changes in S-ovalbumin content of brown-shell eggs and pink-shell eggs during storage were significantly and strongly correlated. Namely, the changes in S-ovalbumin content of different egg varieties were less influenced by egg variety under the same storage conditions.[Citation5] In addition, ovalbumin is irreversibly converted to S-ovalbumin during storage and the rate of conversion is only influenced by pH and temperature, so S-ovalbumin was considered as a reference indicator to evaluate the freshness of commercial eggs.[Citation6]
Existing egg quality evaluation relies mostly on egg weight, albumin height, protein content, eggshell strength, Haugh unit, egg shape index, eggshell color, air chamber height, and egg-specific gravity.[Citation7,Citation8] Standard freshness indicators such as Haugh unit and yolk index may only reflect a portion of the freshness quality of eggs, and rarely integrate the biochemical essence of quality changes; so, the freshness of eggs is not comprehensively and profoundly expressed. If it is possible to test and grade various egg species based on their primary protein content and multiple traditional freshness quality indicators, the quality of the eggs examined will be more complete. Moreover, this technique of grading not only increases the productivity of companies but also enriches the market to suit the needs of various consumer groups.
It is difficult to evaluate the freshness of eggs with the naked eye, especially when the interior protein composition changes, destructive testing is required to determine the freshness accurately.[Citation9] Currently, biochemical methods are used domestically and internationally to detect egg protein content, albumin height, and yolk diameter. These methods have the disadvantage of long detection cycles and complex procedures, and they are destructive tests that fall far short of modern detection standards. Domestic and international nondestructive testing methods for egg freshness include primarily electronic nose technology,[Citation10] dielectric properties,[Citation11] machine vision technology,[Citation12] and spectroscopy technology,[Citation13–15] while visible/near-infrared technology is favored by a high population of egg industry researchers due to its rapidity, nondestructiveness, and topicality. Dong used Vis-NIR transmission spectroscopy to distinguish between unfertilized and fertilized duck eggs before hatching.[Citation16] Matthias utilized Vis-NIR point spectroscopy for in-egg sex identification and discovered that technique was noninvasive, quick, and accurate for sex identification of brown eggs from chickens with sex-specific plumage color.[Citation17] Kemps used Vis-NIR transmission spectroscopy and low-resolution proton nuclear magnetic resonance spectroscopy to measure the freshness of individual egg proteins.[Citation18] Li were able to detect the total egg protein content by combining Vis-NIR spectroscopy with Kjeldahl nitrogen analysis.[Citation19]
Each predictive model based on spectroscopy has a specific fitness range, meaning that, in practice, each model can only produce optimal results for a specific range of samples, instrument conditions, and testing conditions. Numerous studies are currently based on the freshness index of a specific egg species. Few studies have been conducted on the nondestructive evaluation of the quality of multiple species’ eggs at the same time. When utilizing the established model to predict new samples, the fitness of the model must be assessed. Previous research revealed that the mean spectra of brown-shell eggs and pink-shell eggs were not significantly different in the near-infrared range, but were significantly different in the visible range. The global update algorithm enabled the optimized model to simultaneously detect the HU, yolk index, and S-ovalbumin content of the two egg varieties. In addition, few researchers have investigated the specific protein content of different egg varieties using Vis-NIR spectroscopy in terms of the nature of biochemical changes in eggs, and there are no studies on indicators for the comprehensive assessment of egg freshness in conjunction with the specific protein content of eggs.
Accordingly, the concept of Integrated Freshness Index (IFI) of eggs is introduced for the first time in this work, and the purpose of this study is to evaluate the integrated freshness of two egg kinds. The research focuses on the following: (1) Determining the weights of albumin height, yolk diameter, yolk height, egg weight, and S-ovalbumin content, as well as developing a formula for calculating IFI. (2) Clarifying the optimal pretreatment strategy for IFI based on Vis-NIR spectra and to identify the wavelengths of interest. (3) Establishing an support vector regression (SVR) model based on parameter optimization, and after a comparative analysis, determining the model with the best prediction performance to achieve quantitative IFI prediction.
Materials and methods
Samples preparation
The trial samples consisted of 270 eggs of two breeds that were laid on the first day at a chicken farm. All of the eggs were flawless and devoid of cracks. There were 135 eggs with brown shells and 135 eggs with pink shells. All eggs were kept in an incubator with a consistent temperature and relative humidity of 22°C and 65%. At 5-day intervals, i.e. on days 1, 6, 11, 16, 21, 26, 31, 36, and 41, 15 brown-shell eggs and 15 pink-shell eggs were randomly selected and numbered sequentially. Due to test errors or loose yolk, 16 brown-shell eggs and 10 pink-shell eggs failed the test for yolk height or yolk diameter, leaving 244 good samples.
Experimental methods
Vis-NIR spectroscopy system and spectral acquisition: The visible/near-infrared spectroscopy system was manually constructed utilizing a USB2000+ visible/near-infrared fiber optic spectrometer (Ocean Optics, USA). The system concept is depicted in . Each egg’s visible/near-infrared spectrum was collected experimentally. The following acquisition parameters were set: The integration time was set to 60 ms to avoid distortion of the acquired spectral data; the average number of scans was set to 3 to ensure that the spectral data were obtained in as little time as possible while the spectral data were more accurate; the smoothing width was set to 5 to avoid large spectral noise without losing the detailed features of the spectral data; the spectral band range was the original range, i.e. 349 nm – 1000 nm, and for each experiment, randomly selected eggs were positioned one by one with their long axis parallel to the ground to prevent any light leakage during the transmission spectrum acquisition.
Figure 1. Egg visible/near infrared spectrum acquisition device.
Egg freshness indicators: After collecting the spectral data, each egg was weighed with an electronic balance (Wi), and then broken and placed on a glass plate. The concentrated protein height, i.e. the part of the egg white with significant thickness, the yolk diameter, and the yolk height were measured at three different locations with a digital vernier caliper, and the average values were taken as the final albumin height (HAi), yolk diameter (Di) and yolk height (HYi), respectively.
S-ovalbumin content: The following steps were taken to measure the S-ovalbumin content in broken eggs: Each egg’s egg white was separated and placed in one of fifteen 100-mL beakers (numbered 1 to 12). At 4°C, each was agitated using a magnetic stirrer. Then, 25 mL of phosphate buffer at pH 7.5 was added to each of the 15 100-mL beakers containing (5 0.05) g of egg whites. The solution was agitated for five minutes using a magnetic stirrer. For each egg, 5 mL of the combined solution was pipetted into two 20 mL sealed glass test tubes labeled iA, iB, where I represent the egg number. The test tube (iA) was immersed in a 75°C water bath for 30 minutes before being allowed to cool. 5 mL of precipitator was added to the solution in test tubes (iA and iB) and then emptied into centrifuge tubes. Then, 5 mL of precipitator was added to each test tube to rinse its inner wall, and the contents of each test tube were transferred to their respective centrifuge tubes. After 10 minutes, the mixture was centrifuged for 5 minutes at a speed of 12000 rpm. 2 mL of the supernatant from the top of each centrifuge tube was pipetted into a 10 mL centrifuge tube, and 4 mL of the biuret solution was added to each centrifuge tube. The mixture was allowed to rest at room temperature for approximately 30 minutes. Each sample’s absorbance at 540 nm (ODheated, ODunheated) was determined using a UV spectrophotometer. 2 mL of deionized water and 4 mL of biuret solution constituted the blank control sample. S-ovalbumin content was determined using the formula (1).[Citation4]
Data processing
Calculation of index weights using principal component analysis: The principal component analysis is a mathematical transformation technique, it changes a given collection of correlated variables into a new set of uncorrelated variables by a linear transformation, and then arranges these new variables in decreasing order of variance.[Citation20] In the mathematical transformation, the total variance of the variables is held constant so that the first variable has the largest variance, referred to as the first principal component, and the second variable has the second-largest variance and is uncorrelated with the first variable, referred to as the second principal component. By comparison, there are i major components for i variables. The number of evaluation indicators is then reduced based on the amount of the cumulative contribution of principal components, followed by the determination of loading coefficients and comprehensive indicators based on the single indicators and principal components. Before performing principal component analysis on the data, the data must first be normalized due to the varying metrics between the various data categories. The data were normalized using the polar difference method, and Equationequations (2)(2)
(2) and (Equation3
(3)
(3) ) were used to calculate positive and negative indications, respectively.
Here, Ai represents the normalized metric value, while Xi represents the positive metric value before normalization, Yi is the negative metric value prior to normalization.
Partitioning of samples and spectral preprocessing: Using the sample set partitioning based on the joint X-Y distance (SPXY) algorithm, all samples are divided into calibration set and validation set in a 2:1 ratio. The SPXY method can effectively cover the multidimensional vector space, and the spectral data and indicator values are simultaneously considered when calculating the sample spacing.[Citation21] This ensures that the samples in the two types of variable spaces have the same weights, thereby enhancing the predictive ability of the model.
Due to the fact that spectrum data can be affected by instrument noise and random errors, which directly impact the accuracy and precision of the modeling, appropriate spectral preprocessing procedures are required to enhance the predictive performance and robustness of the model. In this experiment, the spectra are preprocessed by first-order derivative processing and Standard Normal Variable Transformation (SNV). First Derivative (FD) can reflect the rate of change of the spectrum, the core principle of SNV is to standardize the raw spectral data.[Citation22]
Screening of feature wavelengths: The Competitive Adaptive Reweighted Sampling (CARS) algorithm begins with the elimination of uninformative variables, and the PLS regression coefficients are used to select the optimal subset of combinations of feature variables representing spectral differences based on the position corresponding to the root-mean-square error of cross-validation (RMSECV).[Citation23]
The Shuffled Frog Leaping Algorithm (SFLA) is an algorithm similar to the reversible jump Markov Chain Monte Carlo (RJMCMC),[Citation24] which proceeds in an iterative manner, calculating the probability of each variable being selected in each iteration, with the probability increasing with the importance of the variable, and favoring the variable with the highest probability as the feature variable. The SFLA method combines a particle swarm algorithm with strong global search performance and a meta-algorithm with strong local search capability to produce a robust merit search capability.
Model development and assessment: Support Vector Regression (SVR) is an effective machine learning-based multivariate methodology. The Support Vector Machine (SVM) algorithm is, in summary, a method that uses kernel functions to translate samples that are linearly indistinguishable in a low-dimensional feature space to a higher-dimensional feature space, so making them linearly different. The SVR method is a regression algorithm based on the idea of SVM; given a data set D = (x1,y1),(x2,y2), …,(xm,ym)|mR, it learns the objective regression function f(x), where f(x) = wT(x)+b and (x) is a nonlinear mapping function.[Citation25] Using the learnt function f(x) as the regression center, an interval band of width 2 is formed, and if the test sample falls inside this interval band, it is deemed to be the sample that was properly predicted. In this study, the Radial Basis Function (RBF) is used to build the model, and the two crucial parameters of the RBF kernel function, penalty parameter (c) and kernel function parameter (g), are optimized using Grid Search (GS), Genetic Algorithm (GA), and Particle Swarm optimization (PSO) to construct GS-SVR, GA-SVR, and PSO-SVR models, respectively.
The prediction performance of the established model was evaluated by comparing the coefficient of determination (R2) and root mean square error (RMSE), where, Rc2 is the coefficient of determination of calibration set, RMSEC is the root mean square error of calibration set, Rp2 is the coefficient of determination of validation set, RMSEP is the root mean square error of validation set. The prediction ability of the model was quantified using relative predictive deviation (RPD) . The following are the applicable formulas for each evaluation index:
where yi and are the measured and predicted IFI values of the i-th sample in the calibration set or validation set, respectively,
is the mean IFI value of all samples in the calibration set or validation set, SD is the standard deviation of IFI for the samples in the validation set, and n is the total number of samples in the calibration set or validation set. The greater the coefficient of determination, the smaller the root mean square error, the greater the stability of the model, the greater the degree of fit, and the more effective the model’s prediction performance. When R2 is larger than 0.80, the predictive capacity of the model is strong. When RPD is less than 1.5, the model cannot predict the sample; when RPD is between 1.5 and 2.0, it can make a rough prediction; and when RPD is greater than 2.0, it can make an excellent prediction.[Citation26]
Results and discussion
Establishment of the egg integration freshness index
With the extension of storage time, the freshness of eggs decreases, and in this process, the height of egg white and yolk will gradually decrease, whereas the yolk diameter and S-ovalbumin content will gradually increase[Citation7]; As eggs are stored for a longer period, the egg weight will gradually decrease, i.e., the heavier the egg, the fresher the egg; as a result, the final determination of egg weight (), albumin height (
), and yolk height (
) as positive indicators, and yolk diameter (
)and S-ovalbumin content (
) as negative indicators. and were obtained in accordance with the principal component analysis processes. showed the total variance explained and showed the component matrix after rotation. Based on and , The weights of each index were ultimately estimated as shown in .
Table 1. Total variance explained.
Table 2. Component matrix after rotation a.
Table 3. Egg indicator weights based on principal component analysis.
On the basis of the indicator weights and their positive and negative directionality, the following formula (7) was developed for computing the egg integration freshness index (IFI):
As shown in , the IFI of both brown and pink shell eggs dropped as storage duration increased. IFI was inversely related to storage duration for both brown and pink shell eggs, as demonstrated by Pearson’s correlation coefficient (R = −0.985, P < .01 for brown shell eggs; R = −0.987, P < .01 for pink shell eggs,). In addition, the correlation coefficient between the mixed IFI and storage time was −0.921, P < .01. Thus, IFI can be utilized as a new freshness index for a comprehensive evaluation of egg freshness.
Figure 2. Changing trend of IFI with storage time.
Partitioning of sample sets and spectral preprocessing
Our earlier research demonstrated that while there was some variation in the typical spectra of brown and pink eggs, the variation was slight and the values of each freshness index were highly associated across varieties. In addition, our previous model fitness study revealed that the models for freshness indicators of different egg varieties could not successfully predict each other. However, the globally optimized model was able to predict the S-ovalbumin content values, etc. of both egg varieties more accurately, and it was more applicable and reliable. Therefore, we can merge the two variants directly to create a generic IFI nondestructive evaluation (NDE) model.
Using the SPXY approach, two-thirds of the samples were selected for modeling and the remaining samples were used for prediction. The calibration set contained 163 samples and the validation set contained 81 samples. displays the statistics of the divided sample sets using the SPXY algorithm.
Table 4. Descriptive statistical analysis of the IFI of the sample set.
shows the raw spectral of brown-shell eggs and pink-shell egg. The 500 nm – 900 nm band range is chosen for this experiment because the original spectrum information has high noise signals at both ends. These noises will create significant interference in the following extraction and modeling of spectral feature parameters if they are not removed. As listed in , the original spectra were preprocessed with first-order differentiation (FD) and SNV, and GS-SVR, GA-SVR, and PSO-SVR models were developed to examine the modeling effects of various preprocessing approaches.
Figure 3. The raw spectral of brown-shell eggs and pink-shell eggs.
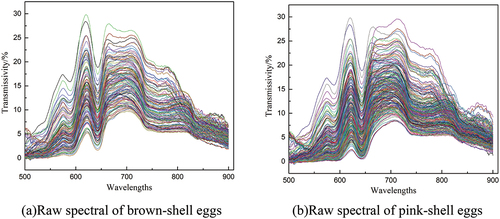
Table 5. Full-spectrum model prediction performance of IFI with different pre-processing methods.
The results indicate that the GA-SVR model constructed from the full spectrum after SNV preprocessing has a satisfactory predictive accuracy. R2 of the calibration set is 0.901, R2 of the validation set is 0.796, and RPD is 2.077, indicating that the model’s IFI predictions are excellent at this moment. The full spectrum was preprocessed by SNV before further data processing.
Characteristic wavelength filtering
Since too many dimensions of the full spectrum will slow convergence of the SVR model, and there are variables in the full spectrum that are irrelevant to IFI, the CARS algorithm and SFLA algorithm are used to further extract useful variables and eliminate irrelevant variables, respectively, in order to find the combination of variables that can represent different levels of IFI in order to simplify the model and improve the prediction accuracy.
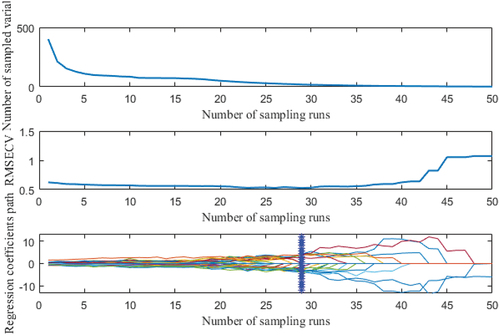
Feature wavelength screening by CARS algorithm: As depicted in , the number of Monte Carlo samples is set to 1000 in the CARS algorithm, and 5-fold cross-validation is utilized to acquire the final optimal feature wavelength screening findings after multiple iterations.
The diminishing exponential relationship between the number of variables and the number of runs is depicted in ) for the selected variables. ) depicts the residual RMSECV trend following the interaction test. The cross-validation RMSECV value decreases and then increases with the number of sampling runs, as shown in ), and the RMSECV value gradually decreases, indicating that some useless information in the spectral data is removed, and the RMSECV value gradually increases, indicating that some important information in the spectral data is removed. As illustrated by the position of the vertical straight line in ), when the RMSECV achieves its minimum value, a total of 29 sample runs are performed. When all RMSECVs were at their minimum, 19 wavelength combinations were selected as the ultimate best ones for predicting egg IFI after repeated parameter testing.
Figure 4. Screening characteristic wavelengths by competitive adaptive reweighted sampling algorithm.
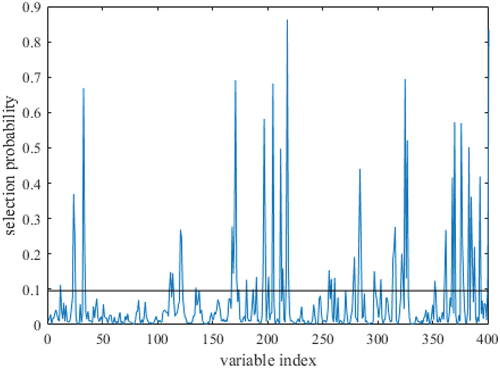
Feature wavelength screening by SFLA algorithm: In this study, the number of SFLA runs has been set to 10,000, the maximum number of potential variables has been set to 5, and the initial number of sampled variables has also been set to 5. Using the magnitude of probability as the evaluation index of variable screening, the horizontal coordinate in reflects the number of each dimensional spectral variable, whereas the vertical coordinate represents the probability of being chosen. The greater the wave peak, the greater the probability of variable selection. The probabilities of selecting 401 variables were ordered using a cutoff value of 0.1, and the 63 best variable combinations placed above the dashed line in the picture were found. Of the 63 bands screened, 30 bands were located in the visible spectral region, primarily those associated with eggshell color characteristics; 33 bands were located in the near-infrared spectral region, the vast majority of which were identical to those reported in the literature for the HU, yolk index, and albumin content.
Figure 5. Screening characteristic wavelengths by shuffled frog leaping algorithm.
Model construction and assessment
displays the prediction performance of the GS-SVR, GA-SVR, and PSO-SVR models, which were developed using the characteristic wavelengths screened by the CARS method and SFLA algorithm, respectively. Based on the evaluation criteria of the model, it can be seen that the prediction performance of the GA-SVR model based on 63 characteristic wavelengths screened by the SFLA algorithm is better compared to that of other models, and that the coefficients of determination of the GA-SVR model established by its calibration set and validation set are 0.900 and 0.816, respectively, both of which are greater than those of other models, and that the RPD is 2.009. And we can observe that GA-SVR has excellent prediction capacity compared to other models, both in the pre-processing modeling stage and the feature wavelength-based prediction model construction stage. Overall, The GA-SVR model based on SFLA can therefore be used to forecast IFI. depicts the correlation between the IFI measurements and the model’s predicted values.
Figure 6. Correlation between measured and predicted values of IFI in calibration set and validation set.
Table 6. Evaluation results of the prediction model based on the characteristic wavelength.
Conclusion
This study was designed by applying the definition of the ‘Integration freshness Index,’ which gave a comprehensive insight into the freshness of the egg from the biochemical essence of quality changes during storage. IFI declined progressively with storage time for both brown-shell and pink-shell eggs, and IFI was substantially linked with storage duration (R = −0.985, P < .01, for brown-shell eggs; R = −0.987, P < .01, for pink-shell eggs). Importantly, a model based on Vis-NIR spectra for the nondestructive and quick detection of IFI in brown-shell and pink-shell eggs was developed. In this study, the raw full spectrum from 500 nm to 900 nm was utilized, and comparison analysis indicated that after SNV preprocessing and the SFLA algorithm to filter the feature wavelengths, a GA-SVR model using the 63 wavelengths screened could predict IFI the most accurately. Rc2 is 0.900 and RMSEC is 0.005 for the calibration set, whereas Rp2 is 0.81, RMSEP is 0.012, and RPD is 2.077 for the validation set, and the model can simultaneously execute nondestructive identification of two distinct egg kinds IFI, which renders it more relevant and dependable. Therefore, the visible-NIR spectral detection system may be utilized to gather objective data of egg IFI nondestructively and rapidly, allowing for grading and online inspection of egg quality. This enables eggs to be managed more fully according to their quality.
Acknowledgments
The authors gratefully acknowledge The School-based Project of Wuhan Polytechnic University (2022Y20), The Guiding Project of Education Department of Hubei Province(Q20221611), the Program of the National Natural Science Foundation of China (31871863), and the Program of Key R&D Projects in Hubei Province (2020BBB072).
Disclosure statement
No potential conflict of interest was reported by the author(s).
Additional information
Funding
References
- Musgrove, M. T.; Jones, D. R.; Northcutt, J. K.; Curtis, P.A.; Anderson, K.E.; Fletcher, D.L.; Cox, N.A. Survey of Shell Egg Processing Plant Sanitation Programs:Effects on Non–Egg-Contact Surfaces. Journal of Food Protection, 2004,12(67):2801–2804.
- Alleoni, A. C. C.; Antunes, A. J. Albumen Foam Stability and S-ovalbumin Contents in Eggs Coated with Whey Protein Concentrate. Braz. J. Poultry Sci. 2004, 6, 105–110.
- Qiu, N.; Ma, M.H.; Zhao, L.; Liu, W.; Li, Y.Q.; Mine, Y. Comparative Proteomic Analysis of Egg White Proteins underVarious Storage Temperatures. J. Agr. Food Chem. 2012, 60, 7746–7753. DOI: 10.1021/jf302100m.
- Fu, D.D.; Wang, Q.H.; Ma, M.H; Xu, F. Correlation Analysis between Egg Freshness Indexes and S-Ovalbumin Content during Storage. Food Sci. 2018, 39(19), 1–6.
- Fu, D.D.; Wang, Q.H.; Gao, S.; Ma, M.H . Analysis of S-Ovalbumin Content of Different Varieties of Eggs during Storage and Its Nondestructive Testing Model by Visible-Near Infrared Spectroscopy. Chin. J. Anal. Chem. 2020, 48(2), 105–111. DOI: 10.19756/j.0253-3820.191329.
- Huang, Q.; Qiu, N.; Ma, M. H. Estimation of Egg Freshness Using S-ovalbumin as an Indicator. Poultr. Sci. 2012, 91(3), 739–743. DOI: 10.3382/ps.2011-01639.
- Abdullah, A.; Ali, M.; Alshaikhi, A. Quality and Weight Grades Classification of Stored Commercial Table Eggs Marketed in Supermarket and Grocery Stores in Riyadh City during Winter and Summer Seasons according to GCC Standard. J. Saudi Soc. Agric. Sci. 2020, 19(5), 339–352. DOI: 10.1016/j.jssas.2020.03.004.
- Javid, I.; Nasir, M.; Zaib, U.R.; Sohail, H.K.; Tanveer, A.; Muhammad, S.A.; Riaz, H.P.; Sajid, U. Effects of Egg Weight on the Egg Quality, Chick Quality, and Broiler Performance at the Later Stages of Production (Week 60) in Broiler Breeders. J. Appl. Poult. Res. 2017, 26(2), 183–191. DOI: 10.3382/japr/pfw061.
- Mahmoud, S.; Mahmoud, O. Detection of Poultry Egg Freshness by Dielectric Spectroscopy and Machine Learning Techniques, LWT. Food Sci. Technol. 2015, 62(2), 1034–1042. DOI: 10.1016/j.lwt.2015.02.019.
- Qinglun, Z.; Siyuan, K.; Chongbo, Y. An Adaptive Learning Method for the Fusion Information of Electronic Nose and Hyperspectral System to Identify the Egg Quality. Sens. Actuators A Phys. 2022, 346, 11382. DOI: 10.1016/j.sna.2022.113824.
- Soon, K.; Jeyamkondan, S. An Automatic System for Measuring Dielectric Properties of Foods: Albumen, Yolk, and Shell of Fresh Eggs. J. Food Eng. 2018, 223, 79–90. DOI: 10.1016/j.jfoodeng.2017.11.039.
- Yingying, L.; Nan, Z. Research on Prediction Model of Egg Freshness Based on Image Processing. Food Mach. 2017, 22(12), 103–109. DOI: 10.13652/j.1003-5788.2017.12.021.
- Yuliang, L.; Xiaona, R.; Hang, Y. Non-destructive and Online Egg Freshness Assessment from the Egg Shell Based on Raman Spectroscopy. Food Control. 2020, 118, 107426. DOI: 10.1016/j.foodcont.2020.107426.
- Yao, K.S.; Sun, J.; Chen, C.; Xu, M.; Zhou, X.; Cao, Y.; Tian, Y. Non-destructive Detection of Egg Qualities Based on Hyperspectral Imaging. J. Food Eng. 2022, 325, 111024.
- Yasmin, L. B.; CT, J. P.; Douglas, F. B. Fast Online Estimation of Quail Eggs Freshness Using Portable NIR spectrometer and Machine Learning. Food Control. 2022, 131, 108418. DOI: 10.1016/j.foodcont.2021.108418.
- Dong, J.; Dong, X.G.; Li, Y.L.; Peng, Y.K.; Chao, K.L.; Gao, C.Y.; Tang, X.Y. Identification of Unfertilized Duck Eggs before Hatching Using visible/near Infrared Transmittance Spectroscopy. Comput. Electron. Agric. 2019, 157, 471–478. DOI: 10.1016/j.compag.2019.01.021.
- Matthias, C.; Janos, K.; Bart, D.K.; Wouters, S., et al. Poultry Science, 101 5,2022. In Ovo Sexing of Eggs from Brown Breeds with a gender-specific Color Using visible-near-infrared Spectroscopy: Effect of Incubation Day and Measurement configuration ,101782 2022. DOI: 10.1016/j.psj.2022.101782.
- Kemps, B.J.; De Ketelaere, B.; Bamelis, F.R.; Mertens, K.; Decuypere, E.M.; De Baerdemaeker, J.G.; Schwägele, F. Albumen Freshness Assessment by Combining Visible Near-Infrared Transmission and Low-Resolution Proton Nuclear Magnetic Resonance Spectroscopy. Poultr. Sci. 2007, 86(4), 752–759. DOI: 10.1093/ps/86.4.752.
- Hai-Feng, L. I.; Meng-Meng, F. A. N. G. Vis/NIR Spectroscopy Nondestructive Examination of Fresh Eggs pH and Protein Detection. Sci. Technol. Food Ind. 2017, 38(20), 286–289, 293. DOI: 10.13386/j.1002-0306.2017.20.050.
- Juan, P.; Ana de, S.; Inmaculada, V.A.José;, R.Q.; Concepción, G.H.; Antonio, L.L. . Comparison of Soil Quality Indexes Calculated by Network and Principal Component Analysis for Carbonated Soils under Different uses. Ecological Indicators. 2022, 143, 109374. DOI: 10.1016/j.ecolind.2022.109374.
- Yue, S.; Meng, Y.; Xiaoyan, L. A Sample Selection Method Specific to Unknown Test Samples for Calibration and Validation Sets Based on Spectra Similarity. Spectrochim. Acta, Part A: Mol. Biomol. Spectrosc. 2021, 258, 119870. DOI: 10.1016/j.saa.2021.119870.
- Liu, C.K.; Wang, Q.H.; Lin, W.G.; Yu, C.D. Origins Classification of Egg with Different Storage Durations Using FT-NIR: A Characteristic Wavelength Selection Approach Based on Information Entropy. Biosyst. Eng. 2022, 222, 82–92. DOI: 10.1016/j.biosystemseng.2022.07.016.
- Yao, K.S.; Sun, J.; Cheng, J.H.; Xu, M.; Chen, C.; Zhou, X.; Dai, C.X. Development of Simplified Models for Non-Destructive Hyperspectral Imaging Monitoring of S-ovalbumin Content in Eggs during Storage. Foods. 2022, 11. 2024. 10.3390/foods11142024.
- Rasmita, D.; Rajashree, D.; Rasmita, R. An Evolutionary Framework Based Microarray Gene Selection and Classification Approach Using Binary Shuffled Frog Leaping Algorithm. Journal of King Saud University - Computer and Information Sciences 2022, 34(3), 1319–1578.
- Mahsa, M.; Mohammadreza, K.K.; Ali, V.; Hossein, G.; Hamid, V.; Alireza, B.; Afshin, F. Genetic Algorithm Based Support Vector Machine Regression for Prediction of SARA Analysis in Crude Oil Samples Using ATR-FTIR spectroscopy,Spectrochimica Acta Part A. Mol. Biomol. Spectrosc. 2021, 245, 118945. DOI: 10.1016/j.saa.2020.118945.
- Lan, T.; Shen, S.; Yuan, H.; Jiang, Y.; Tong, H.; Ye, Y. A Rapid Prediction Method of Moisture Content for Green Tea Fixation Based on WOA-Elman. Foods. 2022, 11(18), 2928. DOI: 10.3390/foods11182928.