
ABSTRACT
The spectrum-effect relationship between chemical fingerprints and antioxidant activities was established to evaluate the quality of Eucommiae Folium (EF) extracts and discover potential efficacy-associated quality markers. Characteristic fingerprints of different batches of EF extracts were generated by high-performance liquid chromatography (HPLC), and a similarity analysis was performed by hierarchical cluster analysis (HCA). Then the total antioxidant capacity assay kit with ferric reducing antioxidant assay (FRAP) method was used to determine antioxidant activity. The spectrum-effect relationship was established to identify the chemical constituents that impart antioxidant activities of Eucommiae Folium (EF) extracts using partial least squares regression (PLSR). HPLC fingerprints of EF extracts were established with the optimized chromatographic conditions: the mobile phase consisted 0.1% phosphoric acid -water (A) and acetonitrile (B), the detection wavelength was 326 nm, the column temperature was 30°C, and the flow rate was 0.8 mL/min. The correlation coefficient of similarity between 12 batches of extracts was ≥0.995. Compounds corresponding peaks P1, P2, P6 (chlorogenic acid), and P8 were closely related to the stable antioxidant activities of EF extracts, and could be selected as potential quality markers. An agile and efficient method that can ensure the intra-assay stability of biological activity of EF extracts and discover efficacy-associated quality markers was successfully built based on spectrum-effect relationship.
Introduction
Eucommia ulmoides Oilv. (EU), also called Du-zhong in Chinese and Tuchong in Japanese, is extensively distributed throughout central China. As the sole species of the genus Eucommia, the leaves, stem, bark, seeds and even the staminate flower of EU possess high medicinal value and nutritional value.[Citation1,Citation2] Eucommiae Folium (EF), derived from the leaf of EU, is ovate with an acuminate tip and a serrated margin. Dry EF is widely used as a popular functional health food and herbal remedy material for twenty years in East Asias, especially in China, Korea, and Japan, also known for its rich source, large output, and convenient collection.[Citation3–6] In recent years, researches on the material basis and pharmacological activity of EF have attracted considerable attention. From EF, the chemical investigations have isolated and identified about 40 chemical compounds.[Citation7–9]
Furthermore, in vitro and in vivo pharmacological studies have increasingly confirmed EF and its extracts have extensive pharmacological activity.[Citation10–20] Among these extracts, the development and utilization of EF aqueous extracts (Du-zhong Su in Chinese) has become a hot spot because the approval by the Ministry of Agriculture as a new feed additive. EF aqueous extracts, rich in chlorogenic acid, flavonoids, polysaccharides and other bioactive substances,[Citation21] has been reported to have a positive impact on growth performance, meat quality, antioxidant capacity and intestinal function in broilers,[Citation22,Citation23] weaned piglets,[Citation24] and finishing pigs.[Citation25] However, the chemical constituents that impart antioxidant activity of EF aqueous extracts remain uncertain yet. In addition, the Chinese Pharmacopoeia 2020 edition takes chlorogenic acid as the only quality control marker for EF and its medicinal extracts and preparations.[Citation4] But it can’t reflect the characteristics of multi-component, multi-target, and multi-function of EF, and makes it difficult to comprehensively guarantee its quality and efficacy. Therefore, it is necessary to investigate the spectrum-effect relationship between fingerprints and antioxidant activities of EF extracts, find the principal bioactive compounds in the fingerprint characterizing antioxidant efficacy, and establish integrated evaluation system to ensure safety and effectiveness of EF extracts.
At present, there are many quality control methods for traditional Chinese medicine (TCM), mainly including spectroscopy, colorimetry, chromatography.[Citation26,Citation27] Among them, chromatographic method includes fingerprint quality control technology, index component content determination technology, thin layer chromatography scanning technology, etc. As a quality control mode widely accepted internationally, the former can comprehensively reflect the chemical composition and characteristics of TCM, and evaluate its quality stability and consistency.[Citation28]
However, the establishment of fingerprint alone can only characterize the type and quantity of chemical compounds contained in TCM, but can’t reflect the correlation information between compounds and efficacy. With this background, a technology based on the analysis of spectrum-effect relationship come into being! It is a technology that connects the fingerprints of characteristic peaks with the efficacy results using mathematical analysis technology, bioinformatics and others, that is establishing a “spectrum-effect” relationship, so as to determine the material basis of efficacy and formulate the internal quality control standard of TCM.[Citation29] Usually, the fingerprints are obtained by modern analytical techniques such as high performance liquid chromatography (HPLC), gas chromatography (GC), ultra-high performance liquid chromatography (UPLC), and mass spectrometry (MS).[Citation30] To gain enough efficacy information, it is necessary to select and establish reasonable pharmacological models in vivo and in vitro. Based on the above “fingerprint” and “efficacy” information, bioinformatics and mathematical analysis techniques are applied to organically combine both to screen characteristic peaks closely related to or with greater contribution to the efficacy.[Citation31] Then, the chemical structure of each characteristic peak can be determined by LC/GC-MS.[Citation32] So far, the spectrum-effect relationships of more than 60 kinds of TCM and their extracts have been established.[Citation33,Citation34]
In this study, HPLC fingerprints of EF extracts were established with the optimized chromatographic conditions and a similarity analysis was performed by HCA. Then, the total antioxidant capacity assay kit with FRAP method was used to determine antioxidant activity. The spectrum-effect relationship between chemical fingerprints and antioxidant activities was established to identify the chemical constituents that impart antioxidant activities of EF extracts using PLSR. This work provides a reasonable method for evaluating quality of EF extracts and looking for efficacy-associated quality markers.
Materials and methods
Reagents
The EF extracts were supplied by Zhangjiajie Hengxing Biotechnology Co., Ltd (Hunan, China). The Millipore Milli-Q water purification system was used to obtain high-purity water. HPLC grade methanol and acetonitrile were obtained from Thermo Fisher Scientific (Waltham, MA, USA). Analytical grade formic acid, trifluoroacetic acid and phosphoric acid were supplied by Agela Technologies (Tianjin, China). The total antioxidant capacity assay kit with FRAP method was purchased from Beyotime Biotechnology Co., Ltd (Shanghai, China).
Sample solution preparation
The sample powder of EF extracts was weighed 10 mg accurately and dissolved in 1 mL water. HPLC determination was performed after the solution was filtered through a 0.22 μm membrane.
Instrument conditions
The chromatographic analysis was performed on a Shimadzu HPLC system (Shimadzu, Kyoto, Japan) equipped with binary solvent delivery pump (LC-20 AD), an auto sampler (SIL-20A), a system controller (CBM-20A), a column temperature chamber (CT0-20A), and UV Visible diode array detector (SPD-M20A 230 V). The analytical Venusil C18 plus (5 µm, 4.6 mm × 250 mm) column (Agela Technologies, Tianjin, China) was used for separation. The microplate reader (Multiskan SkyHigh, Thermo Fisher Scientific, MA, USA) was used to detect the total antioxidant capacity.
Optimization of HPLC conditions
To optimize the chromatography conditions, the chromatographic separation run with five different mobile phase systems, three different column temperatures and flow rates, detection wavelengths from 190 to 800 nm. In addition, the mobile phase system is presented in , and the injection volume was 10 μL.
Table 1. The mobile phase system of HPLC fingerprint analysis.
Method validation
Sample 1 was selected as sample solution for method validation under above optimized HPLC conditions. The repeatability of instrument was certificated by evaluating six working solutions. The precision was determined by evaluating six injections of same working solution. The stability was analyzed at 0, 1, 2, 4, 6, 8, 10, and 12 h. The relative standard deviation (RSDs) of main peaks were calculated based on the relative retention time and peak area of each characteristic peak.
Establishment and evolution of fingerprints
With the above optimal HPLC method, 12 batches of EF extracts samples were analyzed to determine the representative chromatographic fingerprint. The software “Similarity Evaluation System for Chromatographic Fingerprints of TCMs (Version 2012A; Beijing, China)” was applied to establish reference fingerprint, calculate the similarity, and confirm their common chromatographic peaks of EF extracts samples.
Antioxidant activity on FRAP
The antioxidant activity of EF extracts in vitro was determined by the total antioxidant capacity assay kit with FRAP method, which was finished according to the following instructions.[Citation35,Citation36] 5 μL distilled water was added into blank control well; 5 μL FeSO4 standard solution with different concentrations was added into standard curve detection well; 5 μL sample solution was added into sample detection well. 180 μL FRAP working solution was added into above well. Then, the 96-well plate was shaken gently to mix the solution and incubated at 37°C for 3–5 min. After absorbance was measured at the wavelength of 593 nm, the total antioxidant capacity of the samples were calculated according to the standard curve.
Data analysis
HCA was applied to demonstrate similarity and differences between 12 batches of samples with SPSS software (version 24). Values of antioxidant activities were shown as mean ± SD and analyzed by SPSS (version 25.0). SIMCA-P software (version 12.0) and Unscrambler X software (version 10.4) were used to establish partial least squares regression analysis (PLSR) model to analyze the correlation between the areas of common peaks and the antioxidant indexes.
Results and discussion
Optimization of HPLC conditions
Based on detection wavelength, mobile phase, column temperature, and flow rate, the separation conditions of EF aqueous extracts were optimized.[Citation37,Citation38] The results of the full wave scanning from 190 nm to 800 nm showed that 326 nm with the strongest absorption signal peak was selected as best detection wavelength for assay (). Comparing five different mobile phase systems, it was found that the most chromatographic peaks, minimum retention time, and second highest peak intensity were acquired under the mobile phase of 0.1% phosphoric acid -water (A) and acetonitrile (B) (). Compared with 25°C and 35°C, more peaks were obtained at the column temperature of 30°C, accompanied with moderate retention time and better separation effect (). Three different flow rates (0.8, 1.0 and 1.2 mL/min) were selected for chromatographic separation. The results showed that peak areas and numbers at flow rates of 1.0 and 1.2 mL/min were lower than 0.8 mL/min, so 0.8 mL/min was preferred as the optimal flow rate (). To sum up, the optimized chromatographic conditions of HPLC for EF extracts were as follows: the mobile phase consisted 0.1% phosphoric acid -water (A) and acetonitrile (B), the detection wavelength was 326 nm, the column temperature was 30°C, and the flow rate was 0.8 mL/min ().
Figure 1. HPLC chromatograms of EF extracts at different separation conditions. (a) wavelength, (b) mobile phase, (c) modifying agent, (d) column temperature, and (e) flow rate.
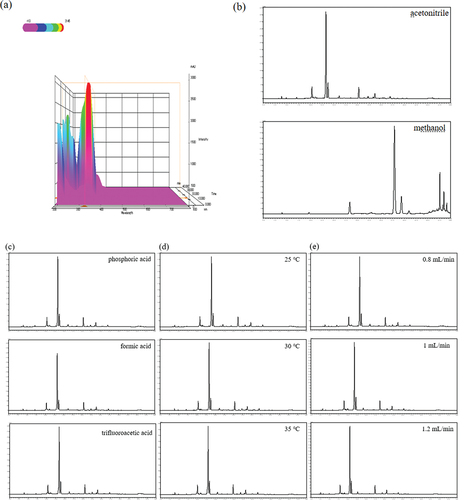
Table 2. Chromatographic analysis results of EF extracts at different separation conditions.
Method validation for HPLC fingerprint
HPLC fingerprint with high precision, repeatability, and stability can be employed for chemical identification and quality control of TCM.[Citation39,Citation40] The results of precision experiments showed that RSDs of relative retention times were <0.21%, RSDs of relative peak areas were <4.84%. The results of repeatability experiments showed that RSDs of relative retention time were <0.65%, RSDs of relative peak area were <4.88%. These results indicated the HPLC instrument with high precision and repeatability could be used to establish the HPLC fingerprint. In addition, the results of stability experiments showed that RSDs of relative retention times in 12 h were <0.27% and RSDs of relative peak area were <4.90%, respectively. It indicated that the sample solution was stable in 12 h.
HPLC fingerprint of EF extracts and identification of common peaks
Under the optimal chromatographic conditions, the fingerprints of 12 batches of EF extracts are presented in .
Figure 2. HPLC fingerprints of EF extracts, representative of 12 chromatograms.
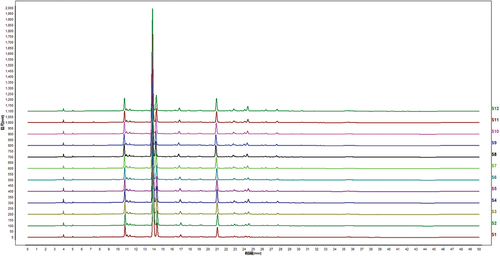
The results of similarity analysis showed similarity values were larger than 0.995 ().
Table 3. Total antioxidant capacity of 12 batches of EF extracts.
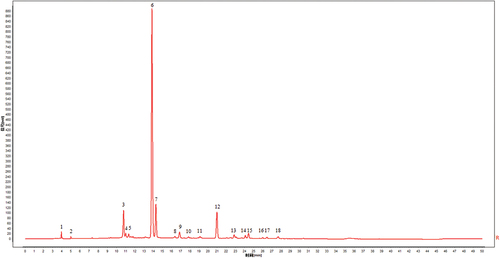
The high similarity, a recognized evaluation index of fingerprints, represented the consistency of each batch of EF extracts, with showing the better internal quality of them.[Citation41] Peaks existing in all chromatograms of EF extracts were assigned as “common peaks”. In , 18 peaks were completely separated from the nearby peaks in the HPLC fingerprints and were picked out as common peaks.
Figure 3. Reference atlas from 10 EF extracts chromatograms.
Hierarchical cluster analysis (HCA) results
HCA provides a means for gradually grouping samples by analyzing the similarity and difference of samples with intuitive and concise figure.[Citation42] In this study, peak areas of 18 common peaks from the 12 batches of samples were imported into the SPSS software (version 23.0) as variables to obtain a 12 × 18-order original data matrix, followed by using the intergroup connection method and the Euclidean square distance as the metric to perform clustering. As shown in , the samples could be divided into two main categories. Category I included subgroup A (S1, S2, S3, S5, S6, S7, S8, S10, S12) and subgroup B (S9, S11). The cluster II included only S4. The findings that 11 out of 12 samples were classified as one category indicated that the content and distribution of compounds in different samples were highly consistent, further revealed quality uniformity and stability of EF extracts from different batches.
Figure 4. HCA of EF extracts.
Antioxidant activity test results
The antioxidant activities of EF extracts were determined by the total antioxidant capacity assay kit with FRAP method.[Citation36] The results of no significant difference existed in the antioxidant capacity of each sample indicated the antioxidant potential and content of active ingredients were significantly correlated, and good quality control can ensure the stability of efficacy in different batches of EF extracts.
Spectrum-effect relationship results
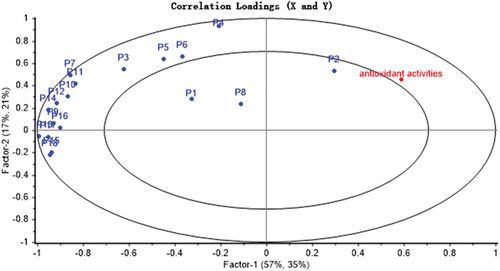
PLSR is a common technique that analyzes the correlation between the components and efficacy. It can determine how each characteristic peaks contribute to the efficacy positively or negatively, and calculate the magnitude of the contribution.[Citation43] The spectrum-effect relationships between the area values of 18 common peaks and the antioxidant activities were established by PLSR. The results of regression coefficient and the variable importance in projection (VIP) scores were obtained from SIMCA-P software. As shown in , the common peaks P1, P2, P3, P4, P6, P7, P8, and P12 in the fingerprint were positively correlated with the antioxidant activities. The results showed that the higher the content of chemical compounds corresponding to the peaks, the stronger the antioxidant activities. As shown in , the VIP scores of chromatographic peaks P6, P1, P18, P9, P15, and P2 were greater than 1. It indicated that these peaks had a significant impact on antioxidant values, because the larger the VIP score, the stronger explanatory ability of the independent variable is for the dependent variable. Based on above analysis, spectrum-effect relationship was effectively established: peaks P1, P2, P6, and P8 were positively correlated with antioxidant activities, while peaks P9, P15, and P18 were negatively correlated with antioxidant activities, indicating that when the content of these compounds represented by peaks P1, P2, P6, and P8 increased, the areas of representative peaks increased. The spectrum-effect relationship was also established by Unscrambler X software. As shown in , compounds corresponding to peaks P2 were closely related to antioxidant activities, and could be selected as candidates for potential quality markers.
Figure 5. Correlations between common characteristic peaks and the antioxidant activity obtained by SIMCA-P.
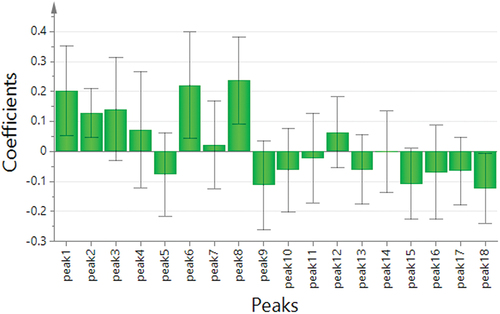
Figure 6. VIP scores of each characteristic peak.
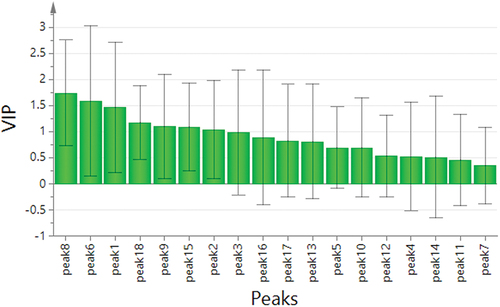
Figure 7. Correlations between common characteristic peaks and the antioxidant activity obtained by Unscrambler X software.
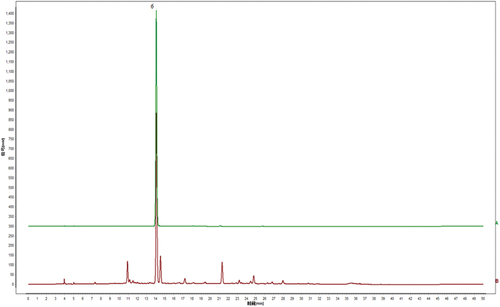
As shown in , comparing the reference substance, the P6 with the highest intensity was determined to be chlorogenic acid, that was accord with earlier research findings the leaf had the higher chlorogenic acid content, whereas the bark, especially the bast, had the higher concentration of iridoids.[Citation44] Furthermore, numerous studies have showed that polyphenolic compounds as natural antioxidants could contribute to scavenging free radicals and protecting biological systems.[Citation45,Citation46] Chlorogenic acid, one of polyphenolic compounds, contains five active hydroxyl groups and one carboxyl group. The phenolic hydroxyl group structure was reported to react easily with free radicals and can form hydrogen radicals to eliminate the activity of superoxide anions and hydroxyl radicals, therefore exerting strong antioxidant activities. The findings further proved the correctness and reliability of the analysis results that P6 (Chlorogenic acid) was positively correlated with antioxidant activities of EF extracts based on the spectrum-effect relationship method.[Citation47,Citation48] In summary, the spectrum-effect relationship established by PLSR model can screen the efficacy-associated substances and strengthen the correlation between the quality evaluation of EF extract and the efficacy.
Figure 8. HPLC of chlorogenic acid reference substance (A) and EF extract (B).
Conclusion
In this study, HPLC fingerprints of EF extracts were successfully established, which fully reflected the types and quantities of chemical compounds contained in EF extracts. Both the high similarity values and HCA findings indicated that the content and distribution of compounds in different batches of EF extracts were highly consistent. At the same time, the study on spectrum-effect relationship using PLSR obtained by SIMCA-P and Unscrambler X software, further confirmed that the chemical compounds corresponding to peaks P1, P2, P6 (chlorogenic acid), and P8 were the material basis of its stable antioxidant activity, and could be selected as potential quality markers. In conclusion, quality evaluation method based on spectrum-effect relationship in this study has reference significance for further improving the quality standard of EF extracts, and provides a highly precise quality control method.
Abbreviations
| EF | = | Eucommiae Folium |
| HPLC | = | High-performance liquid chromatography |
| HCA | = | Hierarchical cluster analysis |
| FRAP | = | Ferric reducing antioxidant assay |
| PLSR | = | Partial least squares regression |
| EUE | = | ucommia ulmoides Oilv. |
| GC | = | Gas chromatography |
| UPLC | = | Ultra-high performance liquid chromatography |
| MS | = | Mass spectrometry |
| RSDs | = | Relative standard deviation |
Acknowledgments
The EF extracts were supplied by Zhangjiajie Hengxing Biotechnology Co., Ltd (Hunan, China).
Disclosure statement
No potential conflict of interest was reported by the authors.
Additional information
Funding
References
- Li, Y.; Wang, M. J.; Li, S.; Zhao, Y.; Xie, R. M.; Sun, W. J.; Sun, W. -J. Effect of Total Glycosides from Eucommia Ulmoides Seed on Bone Microarchitecture in Rats. Phytother. Res. 2011, 25(12), 1895–1897. DOI: 10.1002/ptr.3543.
- Zhou, Y. Q.; Liang, M.; Li, W. Z.; Li, K.; Li, P.; Hu, Y. Z.; Yang, Z. L. Protective Effects of Eucommia Ulmoides Oliv. Bark and Leaf on Amyloid Β-Induced Cytotoxicity. Environ. Toxicol. Pharmacol. 2009, 28(3), 342–349. DOI: 10.1016/j.etap.2009.05.012.
- Zhang, W.; Fujikawa, T.; Mizuno, K.; Ishida, T.; Ooi, K.; Hirata, T. W.; Wada, A. Eucommia Leaf Extract (ELE) Prevents OVX-Induced Osteoporosis and Obesity in Rats. Am. J. Chin. Med. 2012, 40(04), 735–752. DOI: 10.1142/S0192415X12500553.
- National Pharmacopoeia Committee. Part 2. National Pharmacopoeia Committee. Pharmacopoeia of People's Republic of China [M]; Chemical Industry Press: Beijing; 2020.
- Kim, H. Y.; Moon, B. H.; Lee, H. J.; Choi, D. H. Flavonol Glycosides from the Leaves of Eucommia Ulmoides O. with Glycation Inhibitory Activity. J. Ethnopharmacol. 2004, 93(2–3), 227–230. DOI: 10.1016/j.jep.2004.03.047.
- Nakasa, T.; Yamagchi, M.; Okinaka, O.; Metori, K.; Nippon, S. T. Effects of Du-Zhong Leaf Extract on Plasma and Hepatic Lipids in Rats Fed on a High Fat Plus High Cholesterol Diet. Nippon Nogeikagaku Kaishi. 1995, 69(11), 1491–1498. DOI: 10.1271/nogeikagaku1924.69.1491.
- Hirata, T.; Kobayashi, T.; Wada, A.; Ueda, T.; Fujikawa, T.; Miyashita, H.; Ikeda, T.; Tsukamoto, S.; Nohara, T. Anti-Obesity Compounds in Green Leaves of Eucommia Ulmoides Oliv. Bioorg. Med. Chem. Lett. 2011, 21(6), 1786–1791. DOI: 10.1016/j.bmcl.2011.01.060.
- Takamura, C.; Hirata, T.; Yamaguchi, Y.; Ono, M.; Miyashita, H.; Ikeda, T.; Nohara, T. Studies on the Chemical Constituents of Green Leaves of Eucommia Ulmoides Oliv. J. Nat. Med. 2007, 61(2), 220–221. DOI: 10.1007/s11418-006-0027-5.
- He, X.; Wang, J.; Li, M.; Hao, D.; Yang, Y.; Zhang, C.; He, R.; Tao, R. Eucommia Ulmoides Oliv.: Ethnopharmacology, Phytochemistry and Pharmacology of an Important Traditional Chinese Medicine. J. Ethnopharmacol. 2014, 151(1), 78–92. DOI: 10.1016/j.jep.2013.11.023.
- Kwan, C. Y.; Chen, C. X.; Deyama, T.; Nishibe, S. Endothelium-Dependent Vasorelaxant Effects of the Aqueous Extracts of the Eucommia Ulmoides Oliv. Leaf and Bark: Implications on Their Antihypertensive Action. Vascul Pharmacol. 2004, 40(5), 229–235. DOI: 10.1016/j.vph.2003.09.001.
- Choi, M. S.; Jung, U. J.; Kim, H. J.; Do, G. M.; Jeon, S. M.; Kim, M. J.; Lee, M. K. Du-Zhong (Eucommia Ulmoides Oliver) Leaf Extract Mediates Hypolipidemic Action in Hamsters Fed a High-Fat Diet. Am. J. Chin. Med. 2008, 36(01), 81–93. DOI: 10.1142/S0192415X08005606.
- Horii, Y.; Tanida, M.; Shen, J.; Hirata, T.; Kawamura, N.; Wada, A.; Nagai, K. Effects of Eucommia Leaf Extracts on Autonomic Nerves, Body Temperature, Lipolysis, Food Intake, and Body Weight. Neurosci. Lett. 2010, 479(3), 181–186. DOI: 10.1016/j.neulet.2010.05.030.
- Fujikawa, T.; Hirata, T.; Wada, A.; Kawamura, N.; Yamaguchi, Y.; Fujimura, K.; Ueda, T.; Yurugi, Y.; Soya, H.; Nishibe, S. Chronic Administration of Eucommia Leaf Stimulates Metabolic Function of Rats Across Several Organs. Br. J. Nutr. 2010, 104(12), 1868–1877. DOI: 10.1017/S0007114510002965.
- Jin, X.; Amitani, K.; Zamami, Y.; Takatori, S.; Hobara, N.; Kawamura, N.; Hirata, T.; Wada, A.; Kitamura, Y.; Kawasaki, H. Ameliorative Effect of Eucommia Ulmoides Oliv. Leaves Extract (ELE) on Insulin Resistance and Abnormal Perivascular Innervation in Fructose-Drinking Rats. J. Ethnopharmacol. 2010, 128(3), 672–678. DOI: 10.1016/j.jep.2010.02.019.
- Park, S. A.; Choi, M. S.; Kim, M. J.; Jung, U. J.; Kim, H. J.; Park, K. K.; Noh, H. J.; Park, H. M.; Park, Y. B.; Lee, J. S., et al. Hypoglycemic and Hypolipidemic Action of Du-Zhong (Eucommia Ulmoides Oliver) Leaves Water Extract in C57BL/KsJ-Db/db Mice. J. Ethnopharmacol. 2006, 107(3), 412–417. DOI: 10.1016/j.jep.2006.03.034.
- Lee, M. K.; Kim, M. J.; Cho, S. Y.; Park, S. A.; Park, K. K.; Jung, U. J.; Park, H. M.; Choi, M. S. Hypoglycemic Effect of Du-Zhong (Eucommia Ulmoides Oliv.) Leaves in Streptozotocin-Induced Diabetic Rats. Diabetes Res. Clin. Pract. 2005, 67(1), 22–28. DOI: 10.1016/j.diabres.2004.05.013.
- Huang, M. Y.; Fu, T. Y.; Shih, P. H.; Lee, C. P.; Yen, G. C. Du-Zhong (Eucommia Ulmoides Oliv.) Leaves Inhibits Ccl4-Induced Hepatic Damage in Rats. Food. Chem. Toxicol. 2006, 44(8), 1424–1431. DOI: 10.1016/j.fct.2006.03.009.
- Park, S. A.; Choi, M. S.; Jung, U. J.; Kim, M. J.; Kim, D. J.; Park, H. M.; Park, Y. B.; Lee, M. K. Eucommia Ulmoides Oliver Leaf Extract Increases Endogenous Antioxidant Activity in Type 2 Diabetic Mice. J. Med. Food. 2006b, 9(4), 474–479. DOI: 10.1089/jmf.2006.9.474.
- Hsieh, C. L.; Yen, G. C. Antioxidant Actions of Du-Zhong (Eucommia Ulmoides Oliv.) Toward Oxidative Damage in Biomolecules. Life. sci. 2000, 66(15), 1387–1400. DOI: 10.1016/S0024-3205(00)00450-1.
- Yen, G. C.; Hsieh, C. L. Reactive Oxygen Species Scavenging Activity of Du-Zhong (Eucommia Ulmoides Oliv.) and Its Active Compounds. Agric. Food Chem. 2000, 48(8), 3431–3436. DOI: 10.1021/jf000150t.
- Lei, Y. Study of Preparation of Eucommia Ulmoides Extracts and Stress Protection of Chicks [D]. Guizhou University. in Chinese. 2020.
- Zhao, J. S.; Deng, W.; Liu, W. H. Effects of Chlorogenic Acid-Enriched Extract from Eucommia Ulmoides Leaf on Performance, Meat Quality, Oxidative Stability, and Fatty Acid Profile of Meat in Heat-Stressed Broilers. J. Poultry Sci. 2019, 98(7), 3040–3049. DOI: 10.3382/ps/pez081.
- Chen, Y. M.; Huang, T.; Song, X. Z.; Xu, L. J.; Lui, B.; Fu, Y. B. Effects of Dietary Eucommia Leaves Extract on Growth Performance and Immune Function of Broilers. Chin.J. Animal Nutr. 2015, 27(07), 2224–2230.
- Ding, H. X.; Cao, A. Z.; Li, H. Y.; Zhao, Y.; Feng, J. Effects of Eucommia Ulmoides Leaf Extracts on Growth Performance, Antioxidant Capacity and Intestinal Function in Weaned Piglets. J. Anim. Physiol. Anim. Nutr. 2020, 104(4), 1169–1177. DOI: 10.1111/jpn.13333.
- Zhou, Y.; Ruan, Z.; Li, X. L.; Mi, S. M.; Jiang, M.; Liu, W. H.; Yang, H. S.; Wu, X.; Jiang, G. L.; Yin, Y. L. Eucommia Ulmoides Oliver Leaf Polyphenol Supplementation Improves Meat Quality and Regulates Myofiber Type in Finishing Pigs. J. Anim. Sci. 2016, 94(3), 164–168. DOI: 10.2527/jas.2015-9551.
- Zhao, H. -Y.; Jiang, J. -G. Application of Chromatography Technology in the Separation of Active Components from Nature Derived Drugs. 2010, 10(13), 1223–1234. DOI: 10.2174/13895575110091223.
- Ren, J. L.; Zhang, A. H.; Kong, L.; Han, Y.; Yan, G. -L.; Sun, H.; Wang, X. -J. Analytical Strategies for the Discovery and Validation of Quality-Markers of Traditional Chinese Medicine. J. Phytomed. 2019, 67, 153165. DOI: 10.1016/j.phymed.2019.153165.
- Zhu, H.; Wang, C.; Qi, Y.; Song, F.; Liu, Z.; Liu, S. Fingerprint Analysis of Radix Aconiti Using Ultra-Performance Liquid Chromatography-Electrospray Ionization/Tandem Mass Spectrometry (Uplc-Esi/msn) Combined with Stoichiometry. Talanta. 2013, 103, 56–65. DOI: 10.1016/j.talanta.2012.10.006.
- Nijat, D.; Lu, C. F.; Lu, J. J.; Abdulla, R.; Hasan, A.; Aidarhan, N.; Aisa, H. A. Spectrum-Effect Relationship Between UPLC Fingerprints and Antidiabetic and Antioxidant Activities of Rosa Rugosa. J. Chromatogr. B. 2021, 1179(4), 122843. DOI: 10.1016/j.jchromb.2021.122843.
- Alaerts, G.; Dejaegher, B.; Smeyers-Verbeke, J.; Vander Heyden, Y. Recent Developments in Chromatographic Fingerprints from Herbal Products: Set-Up and Data Analysis. 2010, 13(10), 900–922. DOI: 10.2174/138620710793360284.
- Xu, G. L.; Xie, M.; Yang, X. Y.; Song, Y.; Yan, C.; Yang, Y.; Zhang, X.; Liu, Z. Z.; Tian, Y. X.; Wang, Y., et al. Spectrum-Effect Relationships as a Systematic Approach to Traditional Chinese Medicine Research: Current Status and Future Perspectives. Molecules. 2014, 19(11), 17897–17925. DOI: 10.3390/molecules191117897.
- Qiao, X.; Qu, C.; Luo, Q.; Wang, Y.; Yang, J.; Yang, H.; Wen, X. UHPLC- Qms Spectrum-Effect Relationships for Rhizoma Paridis Extracts. J. Pharm. Biomed. Anal. 2020, 194, 113770. DOI: 10.1016/j.jpba.2020.113770.
- Shen, C. H.; Liu, C. T.; Song, X. J.; Zeng, W. Y.; Lu, X. Y.; Zheng, Z. L.; Pan, J.; Zhan, R. T.; Yan, P. Evaluation of Analgesic and Anti-Inflammatory Activities of Rubia Cordifolia L. By Spectrum-Effect Relationships. J. Chromatogr. B Analyt. Technol. Biomed. Life Sci. 2018, 1090, 73–80. DOI: 10.1016/j.jchromb.2018.05.021.
- Zhou, X.; Li, Y.; Zhang, M. Spectrum-Effect Relationship Between UPLC Fingerprints and Antilung Cancer Effect of Si Jun Zi Tang. Evid. Based Complement. Altern. Med. 2019, 2019, 1–9. DOI: 10.1155/2019/7282681.
- Benzie, I. F. F.; Strain, J. J. The Ferric Reducing Ability of Plasma (FRAP) as a Measure of “Antioxidant Power”: The FRAP Assay. Anal. Biochem. 1996, 239(1), 70–76. DOI: 10.1006/abio.1996.0292.
- Svenjak, L.; Marijanovi, Z.; Okinczyc, P.; Marek, K. P.; Jerkovic, I. Mediterranean Propolis from the Adriatic Sea Islands as a Source of Natural Antioxidants: Comprehensive Chemical Biodiversity Determined by GC-MS, FTIR-ATR, UHPLC-DAD-QqTOF-MS, DPPH and FRAP Assay. Antioxidants. 2020, 9(4), 337–369. DOI: 10.3390/antiox9040337.
- Esteki, M.; Shahsavari, Z.; Simal-Gandara, J. Food Identification by High Performance Liquid Chromatography Fingerprinting and Mathematical Processing. Food. Res. Int. 2019, 122, 303–317. DOI: 10.1016/j.foodres.2019.04.025.
- Yu, M.; Xu, G.; Qin, M.; Li, Y.; Guo, Y.; Ma, Q. Multiple Fingerprints and Spectrum-Effect Relationship of Polysaccharides from Saposhnikoviae Radix. Molecules. 2022, 27(16), 5278. DOI: 10.3390/molecules27165278.
- Pan, M. H.; Su, Y. F.; Liu, X. J.; Xiang, S. Q.; Ding, Y. X.; Li, Q. Identification of Forsythia Suspensa (Thunb.) Vahl in Different Harvest Periods Using Intelligent Sensory Technologies, HPLC Characteristic Fingerprint Coupled with Chemometrics. Phytochem. Anal. 2022, 33(3), 490–501. DOI: 10.1002/pca.3104.
- Jing, J.; Chan, C. O.; Xu, L.; Jin, D.; Cao, X.; Mok, D. K.; Parekh, H. S.; Chen, S. Development of an In-Line HPLC Fingerprint Ion-Trap Mass Spectrometric Method for Identification and Quality Control of Radix Scrophulariae. J. Pharm. Biomed. Anal. 2011, 56(4), 830–835. DOI: 10.1016/j.jpba.2011.07.032.
- Song, J.; Chen, F.; Liu, J.; Zou, Y.; Luo, Y.; Yi, X.; Meng, J.; Chen, X. Combinative Method Using Multi-Components Quantitation and HPLC Fingerprint for Comprehensive Evaluation of Gentiana Crassicaulis. Pharmacogn. Mag. 2017, 13(49), 180–187. DOI: 10.4103/0973-1296.197639.
- Bao, H.; Yang, H.; Li, J.; Xu, Y.; Huang, X. Establishment and Development of a Quality Evaluation Method for Sangbaipi Decoction. J. AOAC Int. 2022, 105(2), 558–566. DOI: 10.1093/jaoacint/qsab065.
- Qiu, Q.; Jiang, L.; Huang, C.; Yu, L.; Zhen, D.; Ye, M.; Liu, Y.; Shi, J.; Liu, X.; Gu, B., et al. Study on the Spectrum-Effect Correlation of Anti-Inflammatory Active Extract of Sauropus Spatulifolius Beille. J. Anal. Methods. Chem. 2022, 2022, 5646546. DOI: 10.1155/2022/5646546.
- Chai, X.; Wang, Y.; Su, Y.; Bah, A. J.; Hu, L.; Gao, Y.; Gao, X. A. A Rapid Ultra Performance Liquid Chromatography–Tandem Mass Spectrometric Method for the Qualitative and Quantitative Analysis of ten Compounds in Eucommia Ulmodies Oliv. J. Pharm. Biomed. Anal. 2012, 57, 52–61. DOI: 10.1016/j.jpba.2011.08.023.
- Hodaei, M.; Rahimmalek, M.; Arzani, A. Variation in Bioactive Compounds, Antioxidant and Antibacterial Activity of Iranian Chrysanthemum Morifolium Cultivars and Determination of Major Polyphenolic Compounds Based on HPLC Analysis. J. Food Sci. Technol. 2021, 58(4), 1538–1548. DOI: 10.1007/s13197-020-04666-1.
- Tenorio-Rodriguez, P. A.; Murillo-Alvarez, J. I.; Campa-Cordova, Á. I.; Angulo, C. Antioxidant Screening and Phenolic Content of Ethanol Extracts of Selected Baja California Peninsula Macroalgae. J. Food Sci. Technol. 2017, 54(2), 422–429. DOI: 10.1007/s13197-016-2478-3.
- Naveed, M.; Hejazi, V.; Abbas, M.; Kamboh, A. A.; Khan, G. J.; Shumzaid, M.; Ahmad, F.; Babazadeh, D.; FangFang, X.; Modarresi-Ghazani, F., et al. Chlorogenic Acid (CGA): A Pharmacological Review and Call for Further Research. Biomed. Pharmacother. 2018, 97, 67–74. DOI: 10.1016/j.biopha.2017.10.064.
- Miao, M.; Xiang, L. Pharmacological Action and Potential Targets of Chlorogenic Acid. Adv Pharmacol. 2020, 87, 71–88.