
ABSTRACT
High-performance liquid chromatography (HPLC) fingerprinting is a reliable quality control method for traditional Chinese medicine (TCM). As a research method combining fingerprint and pharmacodynamics of TCM, the TCM spectral effect relationship is widely used in the quality control of TCM and its preparations, which can better reflect the intrinsic quality of TCM and is of great significance for the research on the material basis of TCM efficacy. In this study, an HPLC fingerprint of the extracts from the aerial part of Paeonia lactiflora Pall (APPE) was first established. Then, the HPLC fingerprint of APPE was evaluated by stoichiometry analysis methods such as similarity analysis, hierarchical clustering analysis, and principal component analysis. At the same time, the spectral effect relationship between the HPLC pattern and the total antioxidant capacity of APPE was analyzed by Partial Least Squares Regression (PLSR). The results showed that the similarity correlation coefficient of the 12 batches was ≥0.994, and the total antioxidant capacity was stable. In addition, PLSR analysis showed that 13 chemical components were closely related to the antioxidant activity of APPE.
Introduction
Traditional Chinese medicine (TCM) has the advantages of lasting efficacy, small side effects, and rare drug tolerance[Citation1]. However, the chemical composition of TCMs is very complex, and their efficacy involves multiple targets and pathways.[Citation2,Citation3] Therefore, the inter-batch quality control of TCM is of great significance. In recent decades, the application and development of fingerprint technology have made great progress in TCM development.[Citation4] The World Health Organization (WHO), the U.S. Food and Drug Administration (FDA), China Food and Drug Administration (SFDA), and many other authorities have admitted HPLC fingerprints as a reliable quality control method.[Citation5] HPLC technology has the advantages of a wide application range, strong selectivity, good separation performance, fast analysis speed, and high sensitivity. It is an effective quality control method to evaluate the authenticity, stability, and consistency of natural medicine.[Citation6]
Paeoniae Radix Rubra was harvested from the dried roots of Paeonia lactiflora Pall and is a commonly used TCM with a wide range of pharmacological effects of protecting the liver,[Citation7,Citation8] treating cardiovascular system,[Citation9–11] and digestive system.[Citation12] The possible mechanism of these effects is related to resistance to oxidative damage and free radical scavenging.[Citation13–15] However, a large number of aerial parts are produced when Paeonia lactiflora Pall is obtained, then these aerial parts are often thrown away, not only wasting resources but also causing environmental pollution. In our previous study, we found that the aerial parts of Paeonia lactiflora Pall had a good antioxidant effect. Therefore, it is of immediate significance to study the aerial parts of Paeonia lactiflora Pall.
In this study, primarily we used HPLC technology to establish the chromatographic fingerprints for the aerial part of Paeonia lactiflora Pall (APPE). Subsequently, the total antioxidant capacity of 12 batches of APPE was then tested using the FRAP method to further analyze the stability of APPE. Finally, the spectrum effect relationship between HPLC fingerprints and the antioxidant effect of APPE was established using similarity evaluation and chemometrics analysis. Ultimately, inter-batch quality control of APPE was established by the spectral effect relationship between HPLC fingerprint and total antioxidant capacity.
Materials and methods
Plant material
The sample of the aerial parts of Paeonia lactiflora Pall was collected from Hulunbuir, Inner Mongolia, China in August 2021. A voucher specimen was deposited at the Feed Research Institute (Specimen number: RLP20210815).
Reagents
Acetic acid, trifluoroacetic acid, formic acid, and phosphoric acid are purchased from Fuchen Chemical (Tianjin, China). Methanol and acetonitrile are purchased from Thermo Fisher Scientific (Waltham, MA, USA). Ultrapure water is prepared by pure water APPE ratus(Millipore Milli-Q water purification system, Billerica, MA, USA).
Preparation of extract
The aerial parts of Paeonia lactiflora Pall were dried and crushed and passed through a 40 mesh drug sieve. First, 20 g powder was weighed and put into 600 mL 60% ethanol aqueous solution, and then ultrasonically extracted at 55°C for 25 minutes, followed by suction filtration to obtain the supernatant. Then the supernatant is concentrated by rotary evaporation and lyophilization. APPE.
Instrumental conditions
The Shimadzu HPLC system includes an LC-20 AD pump, autosampler (SIL-20A), system controller (CBM-20A), column temperature chamber (CT0-20A), and UV/VIS diode array detector (SPD-M20A 230 V). Agilent ZORBAX SB-C18 columns (4.6 × 250 mm, 5 μm; Agilent Technologies, California, USA). Microplate reader (MultiskanTM SkyHigh, Gemo Fisher Scientific, MA, USA) for total antioxidant capacity testing.
Method validation
The precision of the instrument was verified by 6 consecutive injections of the same APPE solution. To verify the stability of the sample, the same APPE sample was injected at 0, 2, 6, 12, and 24 hours, respectively. Reproducibility was detected by measuring 6 batches of APPE. The relative standard deviation (RSD) was calculated according to the relative peak area (RPA) and relative retention time (RRT) of each characteristic peak, and peak 8 was selected as the main peak to calculate RSD.
Antioxidant activity
Determination of total antioxidant capacity by Ferric Reducing Ability of Plasma (FRAP) method. In short, the standard is first prepared, then the working solution is configured, then the sample and standard are added to the working solution, incubated at 37°C for 3–5 minutes, and finally, the antioxidant capacity of the APPE is tested at 593 nm.[Citation16]
Chemometrics analysis
Fingerprinting is combined with chemometrics, and the chromatographic peak data is analyzed, processed, compared, and other operational means through mathematical model operations (such as cluster analysis, similarity calculation), and finally, the purpose of identifying authenticity and evaluating quality is achieved. In this APPE, stoichiometry methods such as principal component analysis (PCA), hierarchical clustering analysis (HCA), and partial least squares regression (PLSR) were used to analyze the relationship between fingerprint data and spectral effects. The peak areas of 31 common peaks of APPE were imported into SPSS software (2021 version) and Simca software (17 version) for data processing.
Data analysis
The Similarity Evaluation System for Chromatographic Fingerprint of Traditional Chinese Medicine (Version 2012) was used for data analysis and generated the control map. The data of the total antioxidant capacity of 12 batches of APPE shows as mean ± SD of three independent experiments. Using the ANOVA with Tukey post hoc in statistical comparison and P < .05 is considered statistically significant.
Results and discussion
Optimization of HPLC conditions
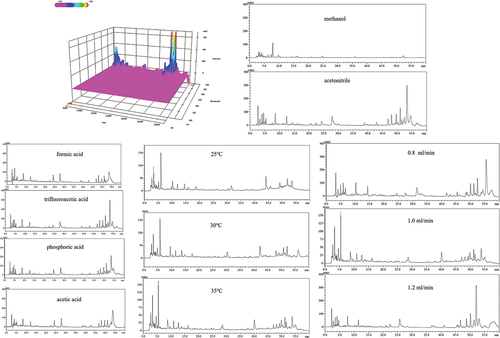
The APPE was scanned in the wavelength range of 190 ~ 800 nm, and 230 nm was determined to be the best detection wavelength (). Then, the effects of mobile phase, modifier, column temperature, and flow rate on the separation of APPE were investigated. Compared to methanol, acetonitrile separates APPE better when it is in a mobile phase (). Appropriate modifiers can improve peak shape or enhance retention. Therefore, in this experiment, four commonly used organic acids were analyzed: 0.1% formic acid, 0.1% acetic acid, 0.1% phosphoric acid, and 0.1% trifluoroacetic acid. The results showed that when 0.1% trifluoroacetic acid was added, both peak signal and peak shape were significantly improved (). In addition, column temperature and flow rate are also factors that affect drug separation.[Citation17] When the column temperature is 35°C and the flow rate is 1 mL/min, the best separation results and more chromatographic peaks are obtained (). In this experiment, the aerial elution conditions of APPE: Acetonitrile (A)-0.1% trifluoroacetic acid (B): 0–8 min, mobile phase A followed from 5% to 9%; 8–20 min, mobile phase A followed from 9% to 10%; 20–24 min, mobile phase A followed from 10% to 13%; 24–28 min, mobile phase A remains 13%; 28–38 min, mobile phase A followed from 13% to 16%; 38–48 min, mobile phase A followed from 16% to 23%; 48–50 min, mobile phase A followed from 23% to 22%; 50–52 min, mobile phase A followed from 22% to 21%; 52–54 min, mobile phase A followed from 21% to 20%; 54–56 min, mobile phase A followed from 20% to 19%; 56–58 min, mobile phase A followed from 19% to 18%; 58–60 min, mobile phase A followed from 18% to 17%; 60–62 min, mobile phase A followed from 17% to 5%; 62–65 min, mobile phase A remains 5%; this loading volume was 10 μL.
Figure 1. HPLC conditions of APPE. (a) wavelength; (b) mobile phase; (c) modifying agent; (d) column temperature; (e) flow rate.
Method validation
The HPLC fingerprint is a reliable method for the assessment of the quality of food and plant extracts.[Citation18–20] In this part of the work, we investigated the chromatographic peaks of all test samples and selected 31 common characteristic peaks based on peak resolution and retention time (). Among all the common peaks, peak 23 has a suitable retention time and peak area, so it is used to calculate reference peaks for relative retention time (RRT) and relative peak area (RPA). The computing formula of RRT and RPA were RRT = RTpeak/RTpeak 8 and RPA = APPEak/APPEak 8, respectively. Precision indicates the reproducibility of the inspection and is a prerequisite for ensuring accuracy. The RSDs of RRT and RPA of 31 common characteristic peaks were <0.79% and <4.40% for 6 consecutive injections of the same sample, indicating that the precision of the instrument is well (). Similarly, samples stored at room temperature were injected at 0, 2, 6, 12, and 24 h, and the RSDs of RRT and RPA of the 31 common peaks were <0.82% and <4.10%, respectively (). Six batches of aerial Paeonia lactiflora Pall were extracted and then injected separately, and the RSDs of RRT and RPA of 31 common characteristic peaks were <0.85% and <4.66%, respectively (). Therefore, all results demonstrated that the quality of the studied samples and the HPLC – DAD measurements were stable and under control.
Figure 2. A characteristics fingerprint of APPE. Peaks 1–31 were used as common peaks.
Table 1. The data of precision, stability, and repeatability of the method.
Similarity analysis
The characteristic peaks and similarity of fingerprint data were identified by the professional software Similarity Evaluation System for Chromatographic Fingerprint of Traditional Chinese Medicine (2012). In this test, all 12 APPE samples were examined to generate a reference chromatogram as the representative standard fingerprint (), and the similarity of each chromatogram against this standard chromatogram was then calculated (). The results showed that 12 batches of APPE had high similarity.
Figure 3. The overlay HPLC fingerprints of 12 batches of APPE. (1–10) by a similarity evaluation system that analyses sample similarity against a generated reference chromatogram (R).
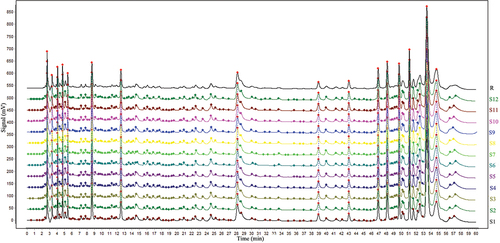
Table 2. Similarities and the total antioxidant capacity of the 10 batches of APPE.
Total antioxidant capacity
The total antioxidant capacity of 12 batches of APPE (0.5 mg/mL) was detected by FRAP, and the results are shown in . The total antioxidant capacity was stable between the 12 batches of APPE with no significant difference. It shows that good quality control can ensure the stability of antioxidant capacity between batches of APPE.
Chemometric analysis
Hierarchical cluster analysis (HCA): The peak area of 31 common peaks of 10 batches of APPE was introduced into SPSS, and 10 batches of APPE were systematically clustered by intergroup join, and the results are shown in . When the connection distance between groups was 11 ~ 16, 10 batches of APPE were divided into three categories, of which the samples numbered S1~S6 were clustered into one category, the samples S8~S10 were clustered into one category, and the samples numbered S7 were clustered into another category. The results show that the samples may not be collected at the same time, and there are certain differences in chemical composition.
Figure 4. HCA of APPE Principal component analysis (PCA).
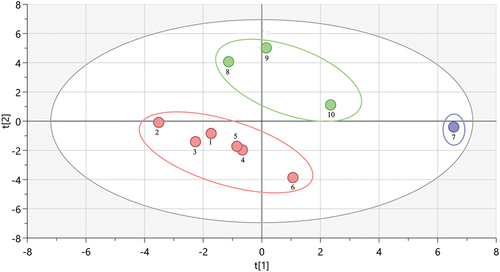
Taking the peak area of 31 common fingerprint peaks as variables, the Simca 17 software was imported into the PCA analysis, a total of 9 principal components were generated, the cumulative contribution rate reached 95%, and the principal component analysis score was plotted, as shown in . The 10 batches of APPE were divided into 3 categories, which were consistent with the results of HCA determination.
Figure 5. PCA score chart of APPE.
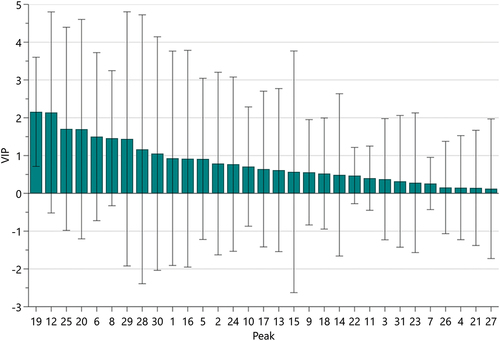
Partial least squares regression (PLSR): PLSR is a statistical analysis method that predicts the relationship between data by fitting the relationship between variables by the least squares method. As shown in , the peaks P2, P5, P7, P8, P11, P12, P13, P16, P19, P20, P21, P22, P23, P24, P26, P27, and P29 of APPE were positively correlated with antioxidant levels and negatively correlated with the remaining 14 peaks. Variable Importance in Projection, or VIP value, reflects the importance of independent variables in the model in explaining the dependent variable. As shown in the results of , the VIP values of peaks P19, P12, P25, P20, P6, P8, P29, P28, and P30 are all >1, indicating that these components are the main components of APPE to exert antioxidant effects.
Figure 6. Antioxidant capacity and chromatographic peak normalized regression coefficient plot.
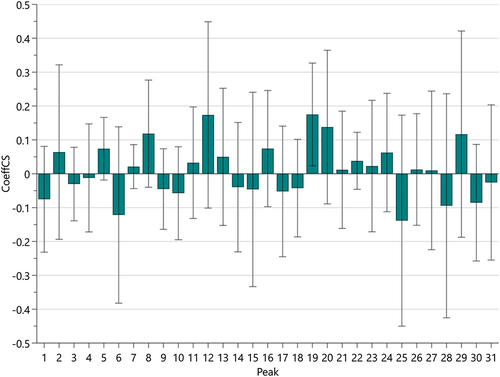
Figure 7. VIP value of antioxidant for each characteristic peak.
Conclusion
In this study, the HPLC fingerprint of APPE was established, reflecting the chemical composition contained in the extract. The fingerprint chromatographic similarity of the 12 batches of APPE reached 0.994, indicating that the same harvested aerial part of Paeonia lactiflora Pall had high chemical composition similarity. At the same time, the relationship between its antioxidant capacity and HPLC chromatography was analyzed by stoichiometric method. Combining chemometric methods to evaluate the spectrum-effect relationship between quality control and antioxidant effect of the APPE.It suggests that our follow-up research should focus on 9 components that significantly exert antioxidants. In conclusion, the fingerprint of the aboveground part of Paeonia lactiflora Pall was established for the first time, and the method of controlling the quality of APPE by combining spectral effects has reference significance for further research and application of the aerial part of Paeonia lactiflora Pall.
Disclosure statement
No potential conflict of interest was reported by the authors.
Additional information
Funding
References
- Shu, Z.; Li, X.; Rahman, K.; Qin, L.; Zheng, C. Chemical Fingerprint and Quantitative Analysis for the Quality Evaluation of Vitex Negundo Seeds by Reversed-Phase High-Performance Liquid Chromatography Coupled with Hierarchical Clustering Analysis. J. Sep. Sci. 2016, 39(2), 279–286. DOI: 10.1002/jssc.201500796.
- Hong, M.; Li, S.; Wang, N.; Tan, H. Y.; Cheung, F.; Feng, Y. A Biomedical Investigation of the Hepatoprotective Effect of Radix Salviae Miltiorrhizae and Network Pharmacology-Based Prediction of the Active Compounds and Molecular Targets. Int. J. Mol. Sci. 2017, 18(3), 620. DOI: 10.3390/ijms18030620.
- Hung, Y. C.; Wang, P. W.; Pan, T. L. Functional Proteomics Reveal the Effect of Salvia Miltiorrhiza Aqueous Extract Against Vascular Atherosclerotic Lesions. Biochim. Biophys Acta Proteins Proteom. 2010, 1804(6), 1310–1321. DOI: 10.1016/j.bbapap.2010.02.001.
- Liu, D. F.; Zhao, L.; Li, Y. F.; Jin, C. D. Research Progress and Application of TCM Fingerprint Technology. Chin. Herbal Med. 2016, 47(22), 4085–4094. DOI: 10.7501/j.issn.0253-2670.2016.22.026.
- Liu, X.; Jiang, W.; Su, M.; Sun, Y.; Liu, H.; Nie, L.; Zang, H. Quality Evaluation of Traditional Chinese Medicines Based on Fingerprinting. J. Sep. Sci. 2020, 43(1), 6–17. DOI: 10.1002/jssc.201900365.
- Sheridan, H.; Krenn, L.; Jiang, R.; Sutherland, I.; Ignatova, S.; Marmann, A.; Sendker, J.; Sendker, J. The Potential of Metabolic Fingerprinting as a Tool for the Modernization of TCM Preparations. J. Ethnopharmacol. 2012, 140(3), 482–491. DOI: 10.1016/j.jep.2012.01.050.
- Xie, T.; Li, K.; Gong, X.; Jiang, R.; Huang, W.; Chen, X.; Tie, H.; Zhou, Q.; Wu, S.; Wan, J., et al. Paeoniflorin Protects Against Liver Ischemia/Reperfusion Injury in Mice via Inhibiting HMGB1-TLR4 Signaling Pathway. Phytother. Res. 2018, 32(11), 2247–2255. DOI: 10.1002/ptr.6161.
- Gao, S. H.; Hu, Z. T.; Dong, L. Y. Protective Effect and Mechanism of Total Paeony Glycoside on Radiactived Hepatic Fibrosis in Rats. Pharm. Clin.Chin. Am. J. Trans. Res. 2012, 125(28), 66–69. DOI: 10.13412/j.cnki.zyyl.2012.02.029.
- Chen, C.; Du, P.; Wang, J. Paeoniflorin Ameliorates Acute Myocardial Infarction of Rats by Inhibiting Inflammation and Inducible Nitric Oxide Synthase Signaling Pathways. Mol. Med. Rep. 2015, 12(3), 3937–3943. DOI: 10.3892/mmr.2015.3870.
- Liu, X.; Chen, K.; Zhuang, Y.; Huang, Y.; Sui, Y.; Zhang, Y.; Lv, L.; Zhang, G. Paeoniflorin Improves Pressure Overload-Induced Cardiac Remodeling by Modulating the MAPK Signaling Pathway in Spontaneously Hypertensive Rats. Biomed. Pharmacother. 2019, 111(3), 695–704. DOI: 10.1016/j.biopha.2018.12.090.
- Zhou, H.; Yang, H. X.; Yuan, Y.; Deng, W.; Zhang, J. Y.; Bian, Z. Y.; Zong, J.; Dai, J.; Tang, Q. Z. Paeoniflorin Attenuates Pressure Overload-Induced Cardiac Remodeling via Inhibition of TGFβ/Smads and NF-Κb Pathways. J. Mol. Histol. 2013, 44(3), 357–367. DOI: 10.1007/s10735-013-9491-x.
- Lin, Y. J.; Zhang, J. M.; Qu, Y. Effect of Total Glucosides of Paeony on Experimental Gastric Ulcer Model in Rats. Chin. J. Exp. Prescriptions. 2010, 16(6), 215–217. DOI: 10.1016/j.jep.2011.03.045.
- Tan, Y. Q.; Chen, H. W.; Li, J.; Wu, Q. J. Efficacy, Chemical Constituents, and Pharmacological Actions of Radix Paeoniae Rubra and Radix Paeoniae Alba. Front. Pharmacol. 2020, 10(11), 1054–1065. DOI: 10.3389/fphar.2020.01054.
- Zhao, Y.; Zhou, G.; Wang, J.; Jia, L.; Zhang, P.; Li, R.; Shan, L.; Liu, B.; Song, X.; Liu, S., et al. Paeoniflorin Protects Against ANIT-Induced Cholestasis by Ameliorating Oxidative Stress in Rats. Food Chem. Toxicol. 2013, 58(13), 242–248. DOI: 10.1016/j.fct.2013.04.030.
- Wang, R.; Xiong, A. Z.; Teng, Z. Q.; Yang, Q. W.; Shi, Y. H.; Yang, L. Radix Paeoniae Rubra and Radix Paeoniae Alba Attenuate CCl4-Induced Acute Liver Injury: An Ultra-Performance Liquid Chromatography-Mass Spectrometry (UPLC-MS) Based Metabolomic Approach for the Pharmacodynamic Study of Traditional Chinese Medicines (TCMs). Int. J. Mol. Sci. 2012, 13(11), 14634–14647. DOI: 10.3390/ijms131114634.
- Xia, Q.; Wang, L.; Xu, C.; Mei, J.; Li, Y. Effects of Germination and High Hydrostatic Pressure Processing on Mineral Elements, Amino Acids and Antioxidants in vitro Bioaccessibility, as Well as Starch Digestibility in Brown Rice (Oryza Sativa L.). Food Chem. 2017, 214(17), 533–542. DOI: 10.1016/j.foodchem.2016.07.114.
- Qin, K. M.; Wang, B.; Cai, H.; Li, W. D.; Yao, Z. Q.; Zhang, X. D.; Lu, T. L.; Cai, B. C. Simultaneous Determination of Five Marker Compounds in Xuanfu Daizhe Tang by High-Performance Liquid Chromatography Coupled with Diode Array Detection for Quality Control. Pharmacogn. Pharmacogn. Mag. 2012, 8(32), 250–255. DOI: 10.4103/0973-1296.103647.
- Li, J.; He, X.; Li, M.; Zhao, W.; Liu, L.; Kong, X. Chemical Fingerprint and Quantitative Analysis for Quality Control of Polyphenols Extracted from Pomegranate Peel by HPLC. Food Chem. 2015, 176(9), 7–11. DOI: 10.1016/j.foodchem.2014.12.040.
- Wu, L.; Ni, Z. H.; Xu, Y. C.; Zhang, X. Q.; Du, S. L.; Cao, K. X.; Chen, Z. P.; Li, W. D.; Guo, L. B. Investigation on the Characteristic Components of Dahuang Zhechong Pill Based on High-Performance Liquid Chromatography (HPLC) Fingerprint. Nat. prod. communicat. 2019, 14(12), 1–8. DOI: 10.1177/1934578X19888079.
- Donno, D.; Mellano, M. G.; Raimondo, E.; Cerutti, A. K.; Prgomet; Beccaro, G. L.; Prgomet, Z. Influence of Applied Drying Methods on Phytochemical Composition in Fresh and Dried Goji Fruits by HPLC Fingerprint. Eur. Food Res. Technol. 2016, 242(7), 1961–1974. DOI: 10.1007/s00217-016-2695-z.