
 ?Mathematical formulae have been encoded as MathML and are displayed in this HTML version using MathJax in order to improve their display. Uncheck the box to turn MathJax off. This feature requires Javascript. Click on a formula to zoom.
ABSTRACT
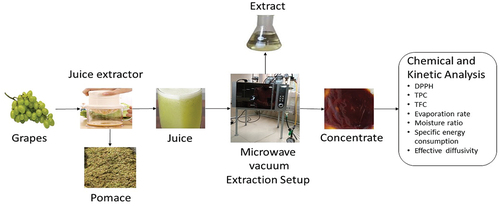
In this study, grape juice was concentrated through a microwave vacuum-assisted technique. The concentrate was prepared at different powers (30, 50, 80 W) and vacuum pressures (35, 50, 70 kPa) for different time intervals to optimize the processing conditions. The highest evaporation rate (5.32 g/100 g min) and the lowest moisture ratio (0.18) were observed at a higher level of microwave power (80 W) and vacuum pressure (70 kPa). Moreover, different mechanistic models were used to predict the values of the moisture ratio. Among them, the Midilli (R2 = 0.999, SSE = 1.970 × 10⁻⁸, RPD = 0.012%) model best fits the experimental values. The effective diffusivity (1.69 × 10⁻¹⁴ m2/s), activation energy (1.56 W/kg), and extraction yield (69.30%) possessed maximum values at 80 W and 70 KPa. While concentrate had exhibited higher antioxidant activities (77.2%) than fresh juice (25.28%) at 30 W. Overall results indicated that the microwave-vacuum technique had significantly reduced the processing time and energy requirement.
GRAPHICAL ABSTRACT
Introduction
Grapes, botanically known as berries, belong to the Vitaceae family. They are acidic due to citric, tartaric, and malic acids. They are a rich source of phenolic compounds such as phenolic acids, anthocyanins, flavonols, and stilbenes.[Citation1] These bioactive compounds impart antimicrobial, antioxidant, anti-carcinogenic, and anti-inflammatory properties[Citation2] and prevent diabetes, obesity, and cardiovascular diseases.[Citation3] Daily, the consumption of grapes causes an increase in plasma antioxidant capacity and prevents DNA damage in lymphocytes.[Citation4]
Grapes have concise shelf life due to high water activity, and their spoilage occurs even at low temperatures. Additionally, post-harvest loss of grapes is about 16% to 23%. This loss is caused by several factors, such as improper harvesting, poor handling, transportation, and distribution.[Citation5] They are processed into juice as they are unavailable for the whole year. To prolong the shelf life, the total soluble solids of grapes juice are increased, reducing water activity and spoilage.[Citation2] Grape juice concentrate economically benefits transportation, distribution, and storage. It is used in jams, jellies, ice cream, and fruit syrups.
There are various techniques, i.e., thermal concentration, freeze concentration, and membrane concentration, used to prepare the concentrate of grapes juice.[Citation6] However, time, high processing cost, and fouling of processing equipment are factors limiting their use in the preparation of fruit juice concentrate. In addition, microwave is a valuable technique. This technique has successfully prepared a concentrate of pineapple, pomegranate, sugarcane, mulberry, apple, black carrot, and raspberry juice.[Citation7,Citation8] It concentrates the product concisely compared to traditional ones.[Citation8,Citation9] Moreover, this technique requires low operational and maintenance costs.[Citation10] Still there was an issue, moisture-containing phenolic compounds evaporated during concentration and were lost to the environment in this technique.
A study was conducted to dry sweet potato slices at controlled microwave temperature using PID under vacuum to prevent thermal degradation. Hence, it was possible to reduce the hot spots during drying by using these methods.[Citation11] The effects of microwave were investigated to concentrate the sugar solutions (glucose, maltose and trehalose) under vacuum. The results indicated that the boiling point of sugar solutions achieved after only ~1 min at a vacuum of 50 Kpa and microwave power density of 40 W/g. Moreover, microwave vacuum system made a rapid mass and energy transfer at low temperature in shorter time.[Citation12]
Thus, there is need to develop a novel technology that have potential to concentrate the juice as well as prevent the loss of bioactive compounds. In this regard, the microwave-vacuum was coupled with condensation apparatus to attain the bioactive compounds during the concentrate-making process. This unique combination may reduce the processing cost and boost the recovery of bioactive compounds wasted with moisture vapors. Therefore, the main objective of this study was to evaluate the quality attributes of grape juice concentrated by microwave-assisted vacuum concentrator and process optimization for better extraction efficiency.
Materials and methods
Grapes procurement and juice preparation
Fresh grapes (Sundar Khani) were purchased from a local market in Faisalabad, Pakistan. These grapes were separated from bunches and washed to remove dirt and other impurities. It was afterward processed into juice using a lab-scale blender (National star, Pakistan). The blend was sieved to separate juice and pomace. Then, the juice was stored in an airtight container at 4°C before concentration and other physicochemical analyses.
Concentration of grapes juice
Grape juice was concentrated through microwave-assisted vacuum concentrator (MODEL: HDG2310S, 230 V, 2450 Hz) developed in a lab as shown in . Juice (100 g) was placed in a vacuum glass chamber (770 cm3) and heated at various levels of power (30, 50, 80 W) and vacuum (35, 50, 70 kPa) for different time intervals (5, 10, 15 min) to achieve 78 ± 2 Brix. A digital refractometer (KRÜSS Optronic, Germany) was used to measure the Brix value of juice concentrate. The concentrate was packed into airtight jars and stored at room temperature. The Box Behnken design (BBD), a design of response surface methodology (RSM), was used to establish experimental conditions, as shown in .
Figure 1. Microwave assisted vacuum concentrator.
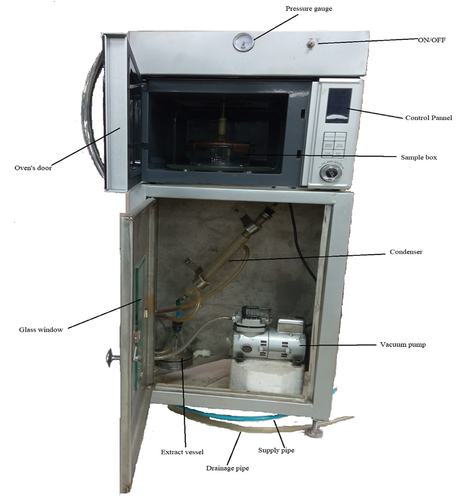
Table 1. Processing conditions to prepare juice concentrate.
Here, control sample represents the fresh juice.
Evaporation rate
Samples were weighed intermittently after every 5 minutes to calculate the evaporation rate. The evaporation rate is calculated using Equationequation 1(1)
(1) .[Citation13]
where ER is evaporation rate (g/100 g min), MCt and MCt+dt represent the moisture content values at time t and t+dt on a wet basis, respectively.
Moisture ratio
Moisture ratio (MR) was determined by using the following Equationequation 2(2)
(2) . This equation was reduced to
, as Me being the constant value in this experiment.
MR is moisture ratio, a unit less quantity with a maximum value of 1. Mt, Me, and Mo are the values of moisture contents at time t, equilibrium stage, and initial moisture content, respectively. The moisture ratio curves were compared with different models as mentioned below in Equationequations (3(3)
(3) -Equation8
(8)
(8) ),[Citation14]
Henderson and Pabis
Wang and Sing
Page
Two-term exponentials
Logarithmic
Midilli
Effective diffusion coefficient and activation energy
The effective diffusion coefficient of the unsteady state evaporation process was determined by using Fick’s law of diffusion, which can be written as:
where is the slope of the plot drawn between the natural logarithm of moisture ratio and time,[Citation13]
can be used to calculate the effective diffusion coefficient (D) as:
Here, Df is the pre-exponential diffusion coefficient (m2/s), Ea is the activation energy (W/kg), L is the half-thickness of the concentrated layer (m), p is microwave power (W), m is the mass of sample (kg), and t is the time (s).
DPPH radical scavenging activity
The scavenging capability of concentrated juice for DPPH radical was determined by[Citation15] with some modifications. The DPPH solution (3.9 ml, 0.025 g/L of methanol) was prepared and mixed with extract (0.1 ml). The mixture was incubated for 20 minutes in darkness at ambient temperature, and absorbance was determined at 517 nm with the absorbance method. The DPPH value of the concentrate was calculated by using the following formula:
Ab and As are the absorbance values of blank and juice samples, respectively.
Total Phenolic Contents (TPC)
The concentrate was added to methanol to make a solution having a concentration of 0.1 g/ml. This solution was mixed with Folin Ciocalteu reagent (2.5 ml) and diluted 10 times by adding distilled water. After that, 2 ml of sodium carbonate (Na2 CO3) solution (75 g/L) was added at ambient temperature. After giving a stay time of 2 hours, the solution’s absorbance was measured using a double-beam spectrophotometer at 765 nm.[Citation16] The concentration of total phenolic contents was determined by comparing the absorbance of a sample with the standard Gallic acid curve.
Total Flavonoid Contents (TFC)
The total flavonoid contents (TFC) of the concentrate were determined by Sadi et al. (2015).[Citation17] The sample (1 ml) was diluted six times and mixed with 0.3 ml of sodium nitrite (NaNO2, 5%). The mixture was incubated for 5 minutes, and 0.3 ml of aluminum chloride (AlCl3, 10%) was added to the solution. Two milliliters of sodium hydroxide (NaOH, 1 M) was added to a mixture diluted to 10 ml by adding distilled water. The absorbance was determined at 500 nm using a spectrophotometer. Total flavonoid contents (TFCs) were determined from the quercetin calibration curve and expressed in mg/L.
Specific energy consumption
Specific energy is the amount required to evaporate 1 kg of water. This amount of energy of the system is expressed in MJ kg−1, which could be calculated with the following equations[Citation18]:
where Emw and Evp are the energies, Pmw and Pvp are the powers consumed by the microwave oven and vacuum pump, t is the processing time (sec) and mv is the mass (kg) of evaporated water.
Water Solubility Index (SI)
The solubility index was determined by mixing 2.5 g of concentrate into 50 ml of distilled water at ambient temperature. The mixture was stirred for 1 minute and placed in a water bath for 30 minutes at 37°C. After that; the mixture was centrifuged at 3500 rpm and 4°C for 25 minutes, separating the supernatant layer and evaporating the water.[Citation19] The water solubility index was calculated by using the following formula:
Color analysis
Color measurements were done using CIE-lab Space (Color Tec-PCM, NY, USA). The values of L*, a*, and b* were determined using a sample colorimeter.[Citation20] The color change (ΔE), whiteness index (WI), and Chroma (C) were calculated using the equations:
Statistical analysis
All readings were taken in triplicates, and results were expressed as mean ± S.D. The statistical tool R was used to analyze the data. The influence of pressure, power, and time on evaporation rate (ER), moisture ratio (MR), antioxidants, and specific energy consumption was done by variance analysis and the Tukey test. Statistical parameters can be calculated by using the following equations[Citation14]:
where N and np are the total number of observations and parameters, xmod,i, and xexp, I are the model and experimental values of ith observation. RSME and RPD values determine how much close experimental values are to the model and the absolute difference between them, respectively.
Result and discussion
Evaporation rate
A quadratic model for evaporation rate was developed using response surface methodology analysis expressed in Equationequation 24(24)
(24) . The statistical analysis indicated that the model equation was highly significant as it possessed a low p-value (0.0013). The quadratic model equation had a coefficient of determination R2 = 0.944 and adjusted R2 = 0.873. Both were close, as the difference was ~0.071. The high value of R2 indicated that this quadratic model could be used to predict precisely the evaporation rate of grape juice for different combinations of power (P), time (T), and vacuum (V).
The Box Behnken design (BBD) was applied to optimize power, time, and vacuum effects on evaporation rate. The results indicated that the evaporation rate (ER) varied throughout the concentration process. ER enhanced about 11 times as microwave power elevated from 30 to 80 W at constant vacuum pressure (70 KPa). The highest (5.32 g/100 g.min) and lowest (0.35 g/100 g.min) evaporation rates were observed at 80 and 30 W microwave powers, respectively (). At higher values of microwave power, the evaporation rate was higher due to more dipolar polarization of water molecules in grape juice and then reduced due to lowered moisture level. Initially, the evaporation rate increased due to more absorption of microwave radiation in higher amounts of available water.[Citation21]
Figure 2. Graphical representation of evaporation rate affected by power and time (a), pressure and time (b), power and pressure (c) and power, pressure and time (d). 35 KPa (▲), 70 KPa (■), and 70 KPa (●).
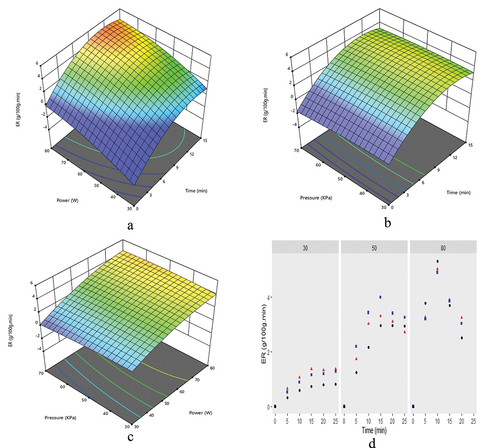
The highest evaporation rate (5.32 g/100 g.min) was observed at the highest vacuum level (70 KPa). Overall, vacuum had a non-significant effect on the evaporation rate, but it was found to be specific for a specific level of power,[Citation22] as shown in (). ER exhibited maximum values of 1.37, 4.0, and 5.32 g/100 g.min at different combinations of microwave power and vacuum pressure, i.e., 30W and 35 KPa, 50 W and 50 KPa, 80 W and 70 KPa, respectively as shown in (). It was observed that increased power and vacuum increased the evaporation rate, as illustrated in (). The evaporation rate would be higher at higher power and vacuum pressure levels and vice versa.[Citation23] The highest evaporation rate was observed at a high microwave power of 80 W and vacuum of 70 KPa, reducing the concentration–time (~20%). The previous studies revealed that forward osmosis required 72 min to make concentrate having 54.5 Brix[Citation24] and rotary vacuum evaporator consumed 45 min to achieve the same concentration level at 90°C and vacuum of 450 mm or 60 KPa.[Citation25] In comparison to these, this novel technique concentrated the grape juice (~55 Brix) approximately in 12 min at 80 W and vacuum of 70 KPa.
Moisture ratio
A quadratic model equation for moisture ratio was obtained through RSM analysis featuring three processing variables (power, vacuum, and time) and expressed in Equationequation 25(25)
(25) . The ANOVA results indicated that the p-value (<0.0001) had the lowest value and revealed that the model equation was highly significant at p ≤ .05. The quadratic model had a coefficient of determination (R2) of 0.990, the adjusted R2 of 0.978, and the predicted R2 of 0.845 were close enough as the difference was ~0.145.[Citation26] Thus, the statistical evaluation indicates that the model equation can be used to predict the maximum values of the moisture ratio.
Moisture ratio was calculated by using Equationequation 2(2)
(2) and plotted as a function of time at different microwave powers and vacuum pressures. It was decreased from 0.95 to 0.43 when power was increased from 30 to 80 W at 70 KPa for 10 min, as shown in (). Evaporation is a temperature function directly related to microwave power in this novel technique.[Citation27] So, at higher power values, moisture ratio points were more steeper due to rapid temperature increase than lower power levels.[Citation28]
Figure 3. Graphical representation of moisture ratio affected by power and time (a), pressure and time (b), power and pressure (c) and power, pressure and time (d). Moroever, ▲, ■, and ● represent pressure values of 35, 50, and 70 KPa, respectively.
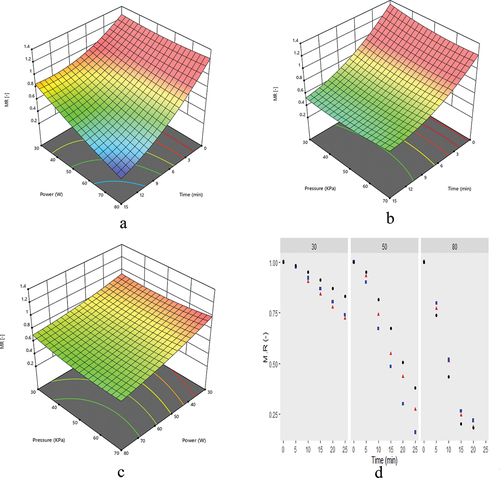
A slight decrease in moisture ratio occurred with an increase in vacuum pressure due to the accelerated removal of water.[Citation27] Moisture ratio decreased from 0.51 to 0.43 as vacuum increased from 35 to 70 KPa at a power of 80 W (). The lowest moisture ratio (0.18) was observed at the highest vacuum pressure (70 KPa).
The combined effect of microwave power and vacuum pressure on moisture ratio was significant and illustrated (). The lowest moisture ratio was observed at a particular combination of power and vacuum levels, i.e., 30 W at 35 KPa, 50 W at 50 KPa, and 80 W at 70 KPa. The lowest value (0.18) of moisture ratio at the highest microwave power (80 W) and vacuum pressure (70 KPa) was due to the swift removal of water vapors from grape juice, as illustrated in (). Furthermore, experimental moisture ratio values were compared with six thin-layer models (Equationequations 3(3)
(3) -Equation7
(7)
(7) ). Among these models, the Midilli (R2 = 0.999, Chi2 = 5.92 × 10⁻⁸, RPD = 0.012%) model was the best in all the other six models. This model had the lowest R2, Chi2, and RPD values for different microwave powers and pressures ().
Table 2. Evaluation of different statistical models for moisture ratio at different powers and pressures.
Antioxidant activity
Microwave power and vacuum pressure greatly affected the radical scavenging activity (DPPH) (). DPPH value of fresh juice (control) was 25.28%, while concentrate at varying power levels were 77.2%, 72.6%, and 72.4% at 30, 50, and 80 W at 35 KPa, respectively. Thus, it is evident that the DPPH value slightly decreased with the change in microwave power. Similar observations were observed when red beet was processed. Initially, scavenging activity slightly decreased at low microwave power and increased with increasing power and concentration time.[Citation29]
Figure 4. Influence of pressure and power on DPPH a), TPC b), TFC c) and solubility index d) of grape pomace.
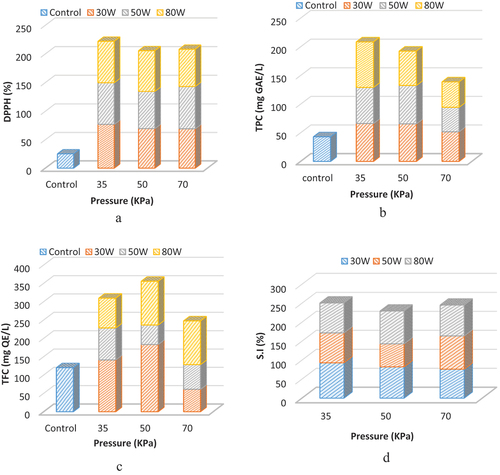
Total phenolic contents (TPCs) of control were (43.1 mg GAE/L), and TPC values increased (~2 times) when it was subjected to microwave processing, i.e., 79.4 mg GAE/L at 80 W. The microwave power had a non-significant effect on TPC compared to the effect of different powers. While on the other hand, vacuum pressure significantly affected TPC values. The value of TPC was decreased from 79.4 mg GAE/L to 44.4 mg GAE/L as the vacuum level increased from 35 KPa to 70 KPa at a constant power of 80 W. This loss of bioactive compounds occurred due to thermal degradation of these compounds at a higher level of power and pressure.[Citation30] TPC showed maximum value at 80 W and 35 KPa, which may be due to the transformation of phenolic compounds from combined state to free state as reported in literature.[Citation31]
Similarly, total flavonoid compounds (TFC) of control (120 mg QE/L) elevated as concentrate was prepared at different microwave powers. The concentrate contained the highest TFC (183 mg QE/L) at 30 W and 35 KPa and the lowest value at 50 W and 50 KPa (). This behavior was either due to the consequence balance of power and pressure or the transformation of flavonoid compounds from a combined state into free state.[Citation31] The effect of pressure and power combination on TFC contents was non-significant ().
Water solubility index and color analysis
The water solubility index (S.I.) describes the reconstitution of concentrate into juice that was determined using Equationequation 16(16)
(16) . The results indicated that the solubility index was non-significantly (P = .184) affected by microwave power and vacuum pressure. It has a minimum value (60.8%) at 50 W and 50 KPa (). In contrast, a maximum value (93.2) of SI was observed at 30 W and 35 KPa. Besides, the color analysis of concentrate was carried out, and the results were presented in . The whitening index of concentrate was calculated and presented in , showing non-significant variation at different microwave powers and vacuum pressures. On the other hand, Chroma (C) and color change (ΔE) were significantly affected by power and vacuum. Both color parameters, C and ΔE had minimum values at 50 W and 50 KPa.
Table 3. Effect of microwave power and vacuum pressure on color parameters.
Specific energy consumption and extraction yield
Energy consumption was calculated using Equationequations 13(13)
(13) -Equation15
(15)
(15) to achieve 78° Brix of grape juice and illustrated in (). The results indicated that microwave power significantly influenced the energy consumption to prepare concentrate. Maximum energy consumption (6.48 MJ/kg) was noted at 30 W and 70 KPa due to the long processing time. Overall, pressure had a non-significant effect on energy consumption. Minimum energy consumption (5.46, 2.56, and 1.95 MJ/kg) was recorded at particular power and pressure levels, i.e. (30 W at 35 KPa, 50 W at 50 KPa, and 80 W at 70 KPa). The energy consumption was reduced to about three times as microwave power increased from 30 to 80 W at a constant vacuum pressure of 70 KPa; this reduction was due to a small processing time at a higher value of microwave power.[Citation32]
Figure 5. Influence of power and pressure on specific energy consumption (a) and extraction yield (b).
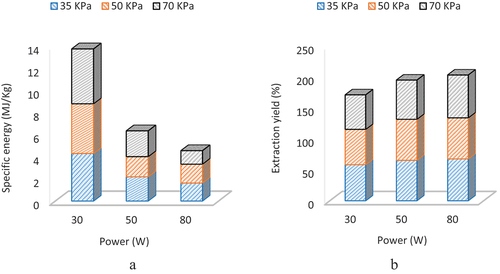
Extraction yield is the percent ratio of vapors recovered during the evaporation process followed by condensation to the initial moisture in grapes juice. The extraction yield ratio increased as microwave power was increased due to accelerated evaporation rate at higher values of microwave power.[Citation32] So, an increase in power positively impacts the extraction yield ratio. Similarly, vacuum pressure also positively impacted the extraction yield ratio. The minimum (55.81%) and maximum (69.30%) extraction yield ratios were revealed at 30 W and 35 KPa and 80 W and 70 KPa, as shown in (). The extraction yield was increased to about 12% and 19.5%, as microwave power was increased from 30 to 50 and 80 W at a constant pressure of 70 KPa, respectively.
Effective diffusivity and activation energy
The effective diffusivity was calculated using Equationequations (9(9)
(9) -Equation11
(11)
(11) ) and slop plotted between the natural logarithm of moisture ratio and evaporation time. At different levels of microwave power and vacuum pressure, effective diffusivity was calculated and illustrated in . The results indicated that effective diffusivity was increased with microwave power. The same observations has been reported by [33] on effective diffusivity. It was possessed the minimum value (1.36 × 10⁻¹⁵ m2/s) at 30 W, a moderate value (7.04 × 10⁻¹⁵ m2/s) at 50 W, and a maximum value (1.69 × 10⁻¹⁴ m2/s) at 80 W while vacuum (70 KPa) remained constant. Effective diffusivity was increased to about 12 times as power was increased from 30 W to 80 W at constant pressure (70 KPa), so microwave power significantly affected the diffusivity coefficient.
Figure 6. Effect of power and pressur on effective diffusivity (a) and activation energy (b).
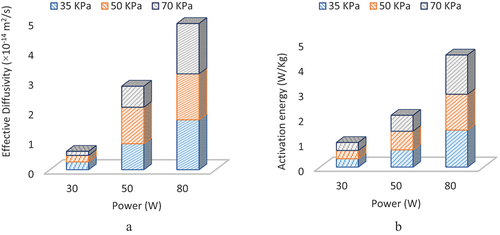
Effective diffusivity was decreased from 2.62 × 10⁻¹⁵ to 1.36 × 10⁻¹⁵ m2/s as vacuum pressure increased from 35 to 70 KPa at a constant lower power of 30 W. Maximum values of effective diffusivity were observed at particular combinations of power and pressure, i.e., 30 W and 35 KPa, 50 W and 50 KPa and 80 W and 70 KPa as shown in . Effective diffusivity was non-significantly affected with vacuum pressure as compared to microwave power.
The activation energy (W/kg) is the power consumed to evaporate one gram of vapors from a sample. The activation energy was greatly affected by microwave power compared to vacuum pressure. It was increased as microwave power increased from 30 to 80 W, as illustrated in . The maximum (1.56 W/kg) and minimum (0.32 W/kg) activation energy were observed at 80 and 30 W at a pressure of 70 KPa. Activation energy remained the same at different vacuum levels (35, 50, and 70 KPa) at 30 W. Effective diffusivities varied non-significantly at various vacuum levels. The highest energy activation was noted at higher power (80 W) and vacuum (70 KPa).
Conclusion
A novel microwave vacuum-assisted technique was used to prepare grape juice concentrate at different conditions of microwave power and vacuum pressure. The results indicated that the peak values were possessed by evaporation rate, extraction yield, effective diffusivity and activation energy. The highest evaporation rate (5.32 g/100 g min) and lowest energy consumption (1.95 MJ/kg) were recorded at 80 W and 70 KPa. The solubility and whitening index of concentrate were non-significantly affected by microwave power and vacuum pressure. Midilli (R2 = 0.999) model was found to be the best one to fit the experimental values of moisture ratio. The total phenolic compounds and concentrate antioxidant activity are enhanced compared to fresh juice. Finally, this technique significantly reduced the processing time and preserved the phenolic compounds in condensate, which can further be used as a functional food ingredient.
Acknowledgments
We are thankful to Higher Education Commission, Islamabad-Pakistan, for supporting this research under the project numbered TDF-03-146.
Disclosure statement
No potential conflict of interest was reported by the authors.
References
- dos Santos Lima, M. Phenolic Compounds, Organic Acids and Antioxidant Activity of Grape Juices Produced in Industrial Scale by Different Processes of Maceration. Food. Chem. 2015, 188, 384–392. DOI: 10.1016/j.foodchem.2015.04.014.
- Toscano, L. T. Phenolics from Purple Grape Juice Increase Serum Antioxidant Status and Improve Lipid Profile and Blood Pressure in Healthy Adults Under Intense Physical Training. J. Funct. Foods. 2017, 33, 419–424. DOI: 10.1016/j.jff.2017.03.063.
- Haas, I. C. D. S.; Marmitt, D. J.; Fedrigo, I. M. T.; Goettert, M. I.; Bordignon-Luiz, M. T. Evaluation of Antiproliferative and Anti-Inflammatory Effects of Non-Pomace Sediment of Red Grape Juices (Vitis Labrusca L.) in Healthy and Cancer Cells After in vitro Gastrointestinal Simulation. PharmaNutrition. 2020, 13, 100204. DOI: 10.1016/j.phanu.2020.100204.
- Halder, S. Protective Effects of Red Grape (Vitis Vinifera) Juice Through Restoration of Antioxidant Defense, Endocrine Swing and Hsf1, Hsp72 Levels in Heat Stress Induced Testicular Dysregulation of Wister Rat. J. Ther. Bio. 2018, 71, 32–40. DOI: 10.1016/j.jtherbio.2017.10.011.
- Aujla, K. Postharvest Losses and Marketing of Grapes in Pakistan. Sarhad J. Agric. 2011, 27(3), 485–490.
- Zhang, Q. Effect of Suspension Freeze-Concentration Technology on the Quality of Wine. S. Afr. J. Enol. Vitic. 2016, 37(1), 39–46.
- Bozkir, H.; Tekgül, Y. Production of Orange Juice Concentrate Using Conventional and Microwave Vacuum Evaporation: Thermal Degradation Kinetics of Bioactive Compounds and Color Values. J. Food Process. Preserv. 2021, 46, e15902. DOI: 10.1111/jfpp.15902.
- Alvi, T.; Khan, M. K. I.; Maan, A. A.; Nazir, A.; Ahmad, M. H.; Khan, M. I.; Sharif, M.; Khan, A. U.; Afzal, M. I.; Umer, M., et al. Modelling and Kinetic Study of Novel and Sustainable Microwave-Assisted Dehydration of Sugarcane Juice. Processes. 2019, 7(10), 712.
- Tsali, A.; Goula, A. M. Valorization of Grape Pomace: Encapsulation and Storage Stability of Its Phenolic Extract. Powder. Technol. 2018, 340, 194–207. DOI: 10.1016/j.powtec.2018.09.011.
- Assawarachan, R.; Noomhorm, A. Mathematical Models for Vacuum‐Microwave Concentration Behavior of Pineapple Juice. J. Food Process Eng. 2011, 34(5), 1485–1505. DOI: 10.1111/j.1745-4530.2009.00536.x.
- Monteiro, R. L. Microwave Vacuum Drying of Foods with Temperature Control by Power Modulation. Innov. Food Sci. Emerging Technol. 2020, 65, 102473. DOI: 10.1016/j.ifset.2020.102473.
- Tao, Y. Microwave Vacuum Evaporation as a Potential Technology to Concentrate Sugar Solutions: A Study Based on Dielectric Spectroscopy. J. Food Eng. 2021, 294, 110414. DOI: 10.1016/j.jfoodeng.2020.110414.
- Khan, M. K. I.; Maan, A. A.; Aadil, R. M.; Nazir, A.; Butt, M. S.; Rashid, M. I.; Afzal, M. I. Modelling and Kinetic Study of Microwave Assisted Drying of Ginger and Onion with Simultaneous Extraction of Bioactive Compounds. Food Sci. Biotechnol. 2020, 29(4), 513–519. DOI: 10.1007/s10068-019-00695-5.
- Shaterabadi, D. Effect of Power Ultrasound on the Extraction of Black Caraway (Carum Carvi L.) and Evaluation of Their Qualitative Properties Using Response Surface Methodology. Food Sci. Nutrition. 2020, 8(8), 4361–4369.
- Sant’anna, V.; Brandelli, A.; Marczak, L. D. F.; Tessaro, I. C. Kinetic Modeling of Total Polyphenol Extraction from Grape Marc and Characterization of the Extracts. Separation and Purification Technology. Sep. Purif. Techn. 2012, 100, 82–87. DOI: 10.1016/j.seppur.2012.09.004.
- Turkmen, F. U.; Takci, H. A. M.; Sekeroglu, N. Total Phenolic and Flavonoid Contents, Antioxidant and Antimicrobial Activities of Traditional Unripe Grape Products. Indian J. Pharm. Educ. Res. 2017, 51, 489–493. DOI: 10.5530/ijper.51.3s.72.
- Sadi, T.; Meziane, S. Mathematical Modelling, Moisture Diffusion and Specific Energy Consumption of Thin Layer Microwave Drying of Olive Pomace. Int. Food Res. J. 2015, 22(2).
- Jafari, S. M.; Ghalenoei, M. G.; Dehnad, D. Influence of Spray Drying on Water Solubility Index, Apparent Density, and Anthocyanin Content of Pomegranate Juice Powder. Powder. Technol. 2017, 311, 59–65. DOI: 10.1016/j.powtec.2017.01.070.
- Korley Kortei, N. Determination of Color Parameters of Gamma Irradiated Fresh and Dried Mushrooms During Storage. Hrvatski Časopis Za Prehrambenu Tehnologiju, Biotehnologiju I Nutricionizam. 2015, 10(1–2), 66–71.
- Khan, M. K. I., Ansar, M., Nazir, A., Maan, A A. Sustainable Dehydration of Onion Slices Through Novel Microwave Hydro-Diffusion Gravity Technique. Innov Food Sci. Emerging Technol. 2016, 33, 327–332. DOI: 10.1016/j.ifset.2015.12.010.
- Wu, L. Vacuum Drying Characteristics of Eggplants. J. Food Eng. 2007, 83(3), 422–429.
- Song, X.-J. Drying Characteristics and Kinetics of Vacuum Microwave–Dried Potato Slices. Drying. Technol. 2009, 27(9), 969–974.
- Zhang, K. Exploration of Food Preservatives as Draw Solutes in the Forward Osmosis Process for Juice Concentration. J. Membr. Sci. 2021, 635, 119495. DOI: 10.1016/j.memsci.2021.119495.
- Tavares, H. M.; Tessaro, I. C.; Cardozo, N. S. M. Concentration of Grape Juice: Combined Forward Osmosis/Evaporation versus Conventional Evaporation. Innov. Food Sci Emerging Technol. 2022, 75, 102905. DOI: 10.1016/j.ifset.2021.102905.
- Chakraborty, R. Infrared-Assisted Freeze Drying of Tiger Prawn: Parameter Optimization and Quality Assessment. Drying. Technol. 2011, 29(5), 508–519.
- Abano, E.; Ma, H.; Qu, W. Influence of Combined Microwave‐Vacuum Drying on Drying Kinetics and Quality of Dried Tomato Slices. J. Food Qual. 2012, 35(3), 159–168. DOI: 10.1111/j.1745-4557.2012.00446.x.
- Lech, K. Drying Kinetics and Bioactivity of Beetroot Slices Pretreated in Concentrated Chokeberry Juice and Dried with Vacuum Microwaves. Drying. Technol. 2015, 33(13), 1644–1653.
- Ravichandran, K. The Effect of Different Processing Methods on Phenolic Acid Content and Antioxidant Activity of Red Beet. Food Res. Int. 2012, 48(1), 16–20.
- Zielinska, M.; Zielinska, D.; Markowski, M. The Effect of Microwave-Vacuum Pretreatment on the Drying Kinetics, Color and the Content of Bioactive Compounds in Osmo-Microwave-Vacuum Dried Cranberries (Vaccinium Macrocarpon). Food Bioprocess. Technol. 2018, 11(3), 585–602. DOI: 10.1007/s11947-017-2034-9.
- Zheng, M.; Xia, Q.; Lu, S. Study on Drying Methods and Their Influences on Effective Components of Loquat Flower Tea. LWT Food Sci. Technol. 2015, 63(1), 14–20. DOI: 10.1016/j.lwt.2015.03.090.
- Hameed, A.; Maan, A. A.; Nazir, A.; Amin, U.; Khan, M. K. I.; Khan, M. U.; Shariati, M. A.; Rebezov, M.; Lorenzo, J. M. Microwave-Vacuum Extraction Technique as a Green and Clean Label Technology: Kinetics, Efficiency Analysis, and Effect on Bioactive Compounds. Food Anal. Methods. 2022, 16, 1–16. DOI: 10.1007/s12161-022-02437-6.
- Azimi-Nejadian, H.; Hoseini, S. S. Study the Effect of Microwave Power and Slices Thickness on Drying Characteristics of Potato. Heat Mass. Transfer. 2019, 55(10), 2921–2930. DOI: 10.1007/s00231-019-02633-x.