
 ?Mathematical formulae have been encoded as MathML and are displayed in this HTML version using MathJax in order to improve their display. Uncheck the box to turn MathJax off. This feature requires Javascript. Click on a formula to zoom.
ABSTRACT
The unsaturated fatty acid content of beef meat is an important property that affects the health and sense of taste of the consumer and determines price. Fresh beef fat samples were measured by a bilateral low-field time-domain proton magnetic resonance (MR) apparatus. The proton transverse relaxation time (T2) for 18 fat samples were measured at 40.0°C using the Carr-Purcell-Meiboom-Gill method. The results showed that T2 increased linearly with unsaturated fatty acid content. By using the linear dependence of T2 on the unsaturated fatty acid content, we successfully estimated the contents of oleic acid, total monounsaturated fatty acid, and total unsaturated fatty acid with root-mean-square errors of 2.5, 2.8, and 3.2 wt%, respectively. The proposed T2-relaxometry-based method could be performed using a portable unilateral MR surface scanner, which would enable in-vivo nondestructive noninvasive measurements of live cattle for the optimization of the feeding and fattening timing from calf to adult and for the best choice of the shipment timing in terms of the maximization of unsaturated fatty acid content of beef meat.
Introduction
The unsaturated fatty acid (UFA) content is an important beef meat quality that affects the health and sense of taste of the consumer and ultimately determines price.[Citation1–6] However, a systematic and scientific method describing how to effectively raise cattle with a high UFA content has not been established. In order to establish such a method, it is desirable to develop a nondestructive, noninvasive apparatus, which enables monitoring of the temporal change in the UFA content of a specific portion of live cattle for a few years. The apparatus would contribute to determining the best choice of feeding and fattening timing from calf to adult and of shipment timing[Citation7–10] in terms of the maximization of the UFA content.
We propose the use of the unilateral proton magnetic resonance (MR) surface scanner as a possible apparatus for the in vivo quantification of the fatty acid composition ().[Citation11,Citation12] The MR surface scanner characterized by a specific (i.e., unilateral or single-sided) magnetic circuit[Citation13,Citation14] allows the nondestructive noninvasive measurement of the proton relaxation of fat molecules located a few centimeters deep from the surface of the cattle body. The unilateral MR scanner has been successfully applied to fat quantification of marbled beef meat blocks in the laboratory.[Citation15,Citation16] The MR surface scanner is portable, works with an AC 100-V commercial power supply, and thus can potentially be used for live cattle measurements at stock farms and in cattle sheds. When considering the measurement of live cattle, the advantages of unilateral MR scanning over other nondestructive methods, such as near-infrared spectroscopy, hyperspectral imaging, and electrical impedance,[Citation17–21] are that (i) the sensed region is compact (typically approximately 1 × 1 × 1 cm3) and its location is accurately known[Citation22,Citation23] and (ii) the undesirable effects of skin and body hair that could distort and scatter near-infrared rays and electric currents can be eliminated if the investigation depth (distance from the sensor to the center of the sensed region) of the magnetic circuit is carefully designed.[Citation24,Citation25]
Figure 1. Schematic illustration of nondestructive, noninvasive quantification of fatty acids in live cattle using unilateral magnetic resonance surface scanner with hand-held sensor unit.[Citation11]
![Figure 1. Schematic illustration of nondestructive, noninvasive quantification of fatty acids in live cattle using unilateral magnetic resonance surface scanner with hand-held sensor unit.[Citation11]](/cms/asset/b953ed9d-9fb5-4db7-83ad-a541b3165338/ljfp_a_2244691_f0001_oc.jpg)
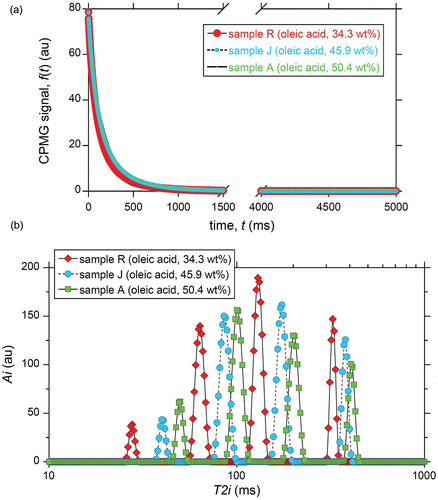
Figure 2. Examples of T2 relaxometry of beef fat samples at 20MHz and 40.0°C. The oleic acid composition is indicated. See Table ESM2 for the composition of fatty acids other than oleic acid. (a) Raw CPMG data acquired at an echo spacing of 1 ms. See Fig. ESM3 for the CPMG data for early times. (b)Corresponding T2 distribution calculated by multi-exponential fitting using EquationEquation (1)(1)
(1) for N= 400. The horizontal axis, T2i, ranges from 10 to 1000 ms. See Fig. ESM4 for the full-range plot.
In the present study, the potential of the unilateral MR surface scanner as an apparatus for the quantification of the unsaturated fatty acid content was experimentally examined in a laboratory. The longitudinal and transverse (T1 and T2, respectively) proton relaxation times for fresh beef fat samples were measured using a low-field time-domain bilateral (not unilateral) MR apparatus.[Citation26] The fatty acid composition was analyzed by a conventional destructive method (gas chromatography) to obtain the contents of oleic acid, total UFA, and total monounsaturated fatty acid (MUFA). The correlation between the obtained T1 and T2 data and the fatty acid composition was examined carefully to evaluate the potential of relaxometry-based MR sensing for nondestructive, noninvasive quantification of fatty acids in live cattle.
Methods and materials
Bilateral MR apparatus
A low-field time-domain bilateral MR apparatus (Minispec mq20, Bruker Biospin, Billerica, Massachusetts) was used in the present study for proton relaxometry of beef fat samples (see Electronic Supplementary Material, Fig. ESM1). Because T1 and T2 values for beef fat samples significantly depend on the temperature,[Citation16] the careful temperature control is required for the successful relaxation data acquisition. It is technically difficult to precisely control the sample temperature using the unilateral MR system in our laboratory[Citation11,Citation15,Citation16] due to the unilateral sensor structure open to the environment. Thus, the bilateral MR system was chosen because the thermally insulated structure of the sample holder with a radio-frequency (RF) coil allows precise sample temperature control with a fluctuation of less than ±0.1°C, which is suitable for accurately measuring the temperature-sensitive T1 and T2 for the fat samples. The proton Larmor frequency was 20 MHz, and the duration of the 90º and 180º RF pulses were 2.9 and 5.6 μs, respectively.
For T2 relaxometry, the conventional Carr-Purcell-Meiboom-Gill (CPMG) pulse sequence[Citation13,Citation14,Citation27] was used to measure the transient proton transverse relaxation. The 5000 echoes were acquired at an echo spacing of 1 ms. The acquisition mode for the CPMG signal was the magnitude mode measuring the square root of the summation of the square of the in-phase signal and that of the out-of-phase signal. The sequence repetition time, TR, was 7 s (i.e., the T1 full relaxation condition), and the number of stacked signals, Nstack, was 128.
The quantity T1 was also measured in the present study because it is a fundamental property to optimally set the sequence repetition time for the full relaxation condition of nuclear magnetization. The conventional saturation recovery method[Citation13,Citation14,Citation27] was performed for T1 relaxometry of the fat samples. The sequence repetition time (TR) was 4 s (i.e., the T1 full relaxation condition), and Nstack was four. The recovery time for the longitudinal relaxation of the nuclear magnetic moment ranged from 30 to 3000 ms, and a total of 13 data points were acquired for saturation recovery of each sample.
Sample description
Eighteen fresh fat samples of beef were purchased from local stores. Detailed information about the fat samples (e.g., cattle ID number,[Citation28] portion, and breed) is listed in Table ESM1. The moisture content was analyzed for all samples, and the protein, fat, and ash contents were also analyzed for a few samples using a conventional food chemical analysis technique following the official method determined by the Ministry of Education, Culture, Sports, Science and Technology, Japan.[Citation29] The results are also listed in Table ESM1.
The main object of this present study is to evaluate the error in UFA quantification using proton MR relaxometry. Thus, to obtain ground truth values for the UFA content, the 18 fat samples were analyzed by a conventional destructive method (gas chromatography with a flame ionization detector using a heptadecanoic acid standard).[Citation29] The results are listed in Table ESM2. The high correlation between the oleic acid content, total MUFA content, and total UFA content is shown in Fig. ESM2.
The fat samples were individually inserted into 18 glass tubes (volume: 1 mL) and were measured using the bilateral MR apparatus at a Larmor frequency of 20 MHz (Fig. ESM1). Since the deep body temperature of live cattle ranges from 39 to 41°C,[Citation30] T1 and T2 relaxometry was performed at a sample temperature of 40.0 ± 0.1°C, maintained by a temperature control unit using nitrogen gas flow.
Relaxation data analysis
The analysis method for the obtained time-series relaxation data is described. The multi-exponential model (inverse Laplace transform)[Citation13,Citation27] was applied to the decaying CPMG signal, f(t), to obtain the T2 distribution (i.e., a set of T2i and Ai):
where N is the total number of T2 decay components, Ai is the MR signal amplitude for the ith component with a T2 value of T2i, and c1 is a positive constant. The values of T2i are given so that they are equally spaced on a logarithmic scale ranging from 1 to 1000 ms. Since the acquisition mode of the CPMG data is magnitude mode, the noise-derived small but non-zero positive constant, c1, remains in the CPMG train, f(t). The conventional CONTIN method[Citation31] was used to perform the inverse Laplace transform in EquationEquation (1)(1)
(1) to determine the unknown quantities, Ai. Because the inverse Laplace transform is mathematically ill-posed and noise-sensitive, the number of echoes and the Nstack value were carefully chosen in the preliminary experiments using fat samples. As a result, we found that the choice of the 5000 echoes and Nstack = 128 yields reliable values for Ai.
We also examined a simple mono-exponential model assuming a single value of T2:
where A, T2, and c2 are unknown quantities and are determined by the least-squares method. EquationEquation (2)(2)
(2) corresponds to the case for N = 1 in EquationEquation (1)
(1)
(1) .
For T1 relaxation data analysis, the conventional three-parameter method[Citation32] using a mono-exponential model was used to fit the saturation recovery data, g(τ), to obtain the T1 value:
where τ is the recovery time, and the three parameters, B, T1, and c3 are determined by the least-squares method.
Results
T2 relaxometry
Examples for the five-second-long CPMG data are shown in for three fat samples. A magnified view of the very early time range is shown in Fig. ESM3, which depicts the undesirable fluctuation of the first few data points due to the inhomogeneous magnetic and RF fields.[Citation33,Citation34] The corresponding T2 distributions for the three fat samples calculated using EquationEquation (1)(1)
(1) for N = 400 are shown in Fig. ESM4, revealing five components (i.e., five peaks) for each fat sample. One of the five peaks at T2i = 1 ms in Fig. ESM4 is probably an artifact derived from the transient fluctuation[Citation33,Citation34] mentioned above for t < 5 ms (Fig. ESM3). Also note that the relative intensity of the peak at T2i = 1 ms is significantly small. For example, while the areal intensity of the peak at T2i = 1 ms is as small as 0.03% for sample R, that of the summation of the remaining four peaks is 99.97% (total: 100%). Thus, the peak at T2i = 1 ms is neglected hereafter.
demonstrates clear effects of the oleic acid content on the T2 distribution for N = 400. All four peaks shift to the right (i.e., larger T2i values) with increasing oleic acid content. Although the figures are omitted, the same dependence of the shift of the four peaks on the oleic acid content was observed for N = 200, 300, and 500. It is possible to simplify this shift behavior by employing a single value of T2 for each sample. Thus, the mono-exponential model, EquationEquation (2)(2)
(2) , assuming a single T2 component is applied hereinafter to discuss the effects of the UFA content on the T2 relaxometry results ().
Figure 3. Same as , but for CPMG data without first four echoes. The time range was also tuned. Least-squares fitting using the mono-exponential model in EquationEquation (2)(2)
(2) was used to obtain T2 = 143, 172, and 179 ms and c2 = 0.27, 0.29, and 0.31 for samples R, J, and A, respectively.
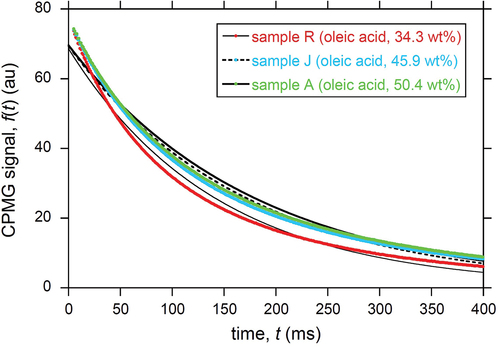
The T2 values obtained by applying the mono-exponential model to the CPMG data without the first four data points (e.g., ) are summarized in Table ESM3 and plotted in . The horizontal axis of is calculated based on Table ESM2. A reasonably linear relationship was found between the oleic acid content and the T2 value with a high correlation coefficient (R) of 0.86 (). A linear relationship was also found with respect to the total MUFA and total UFA content, as shown in , respectively. This is a consequence of the linear dependence of the total MUFA and UFA content on the oleic acid content, as shown in Fig. ESM2. The obtained calibration lines in , with high R values were used to convert the T2 value into the oleic acid content (), the total MUFA content (), and the total UFA content (), respectively. The corresponding root-mean-square error (RMSE) values were 2.5, 2.8, and 3.2 wt%, respectively.
Figure 4. Calibration lines for T2 relaxometry. The T2 values calculated using the mono-exponential model given in Eq. (2) are collected from Table ESM3 and plotted with respect to (a) the oleic acid content, (b) the total MUFA content, and (c) the total UFA content. The correlation coefficient, R, for the 18 data points is indicated.
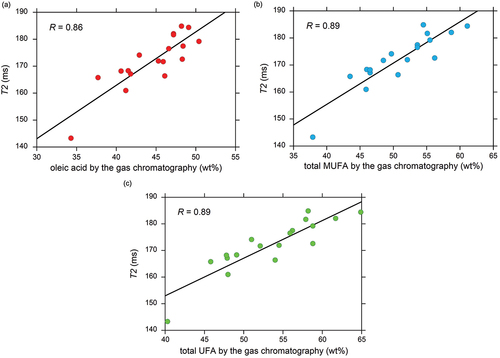
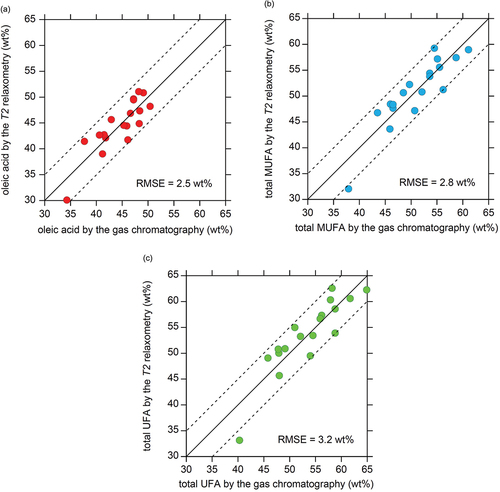
Figure 5. Accuracy of unsaturated fatty acid quantification based on T2 relaxometry for (a) the oleic acid content, (b) the total MUFA content, and (c) the total UFA content. The unsaturated fatty acid content calculated using the calibration lines in Fig. 4 are plotted with respect to the ground truth listed in Table ESM2 obtained by conventional food analytical methods. Three error contours, corresponding to 0 and ±5 wt%, are indicated by solid and dashed lines, respectively. The RMSE calculated for the 18 data points is indicated.
T1 relaxometry
The saturation recovery data for T1 relaxometry for the same fat samples in are shown in Fig. ESM5. The mono-exponential model, EquationEquation (3)(3)
(3) , was applied to the recovery curve to obtain a single value of T1 for each fat sample. The T1 values obtained for 18 fat samples are plotted in Fig. ESM6, indicating poor correlations between T1 and T2, and the moisture content. The maximum T1 value among the 18 samples is as short as 240 ms, ensuring that the TR values used for the CPMG experiments (i.e., 7 s) and the saturation recovery experiments (i.e., 4 s) meet the full relaxation condition for nuclear magnetization.
The obtained T1 values for the 18 fat samples are summarized in Table ESM3 and plotted with respect to the oleic acid, total MUFA, and total UFA content in Figs. ESM7a, ESM7b, and ESM7c, respectively. The horizontal axis of Fig. ESM7 is calculated based on Table ESM2. Although the correlation between T2 and the UFA content is evident (), that between T1 and the UFA content is poor. This is related to the poor correlation between T1 and T2 (Fig. ESM6b). The calibration lines in Figs. ESM7a, ESM7b, and ESM7c were used to convert the T1 value into the oleic acid content (Fig. ESM8a), total MUFA content (Fig. ESM8b), and total UFA content (Fig. ESM8c), respectively. The RMSE values based on T1 relaxometry were 16.5, 16.0, and 16.3 wt%, respectively, which are rather worse compared with the UFA estimation based on T2 relaxometry ().
Discussion
A high correlation with respect to the T2 values of the beef fat samples was found for the oleic acid content (), total MUFA content (), and total UFA content () in the present study. The high correlation between T2 and oleic acid content has been observed for mixed reagents (non-biological samples) and sunflower seeds.[Citation35,Citation36] This is probably due to the difference in physical properties between saturated fatty acid (SFA) with a high melting point and large viscosity and UFA with a low melting point and low viscosity.[Citation37,Citation38] Based on the results of proton MR studies on crude oil,[Citation27] T2 is inversely proportional to the oil viscosity, suggesting again that the difference in the thermal activity and mobility of the UFA and SFA molecules is probably the reason for the difference in the T2 values.
The high correlation between T2 and UFA contents () allows accurate quantification of UFA based on T2 relaxometry. The high correlation between T2 and oleic acid () yields a small RMSE of 2.5 wt% for oleic acid (). The reasonable correlations between T2 and total MUFA (), and that between T2 and total UFA () also yield small RMSE values, as small as 2.8 wt% (), and 3.2 wt% (), respectively. These small RSME values demonstrate that the quantification of UFA by T2 relaxometry is promising for beef fat samples.
The measurement error for near-infrared spectroscopy when applied to intermuscular fat in bare beef meat (cross section of the carcass) is approximately 2 wt% for the oleic acid content and total MUFA content.[Citation17] This error is slightly lower than the RMSE values obtained by T2 relaxometry shown in . However, due to undesirable absorption and scattering of rays within the object,[Citation39] the accuracy of near-infrared spectroscopy would be expected to decrease significantly when applied to live cattle with thick skin and body hairs. In contrast, no significant effects on the measurement accuracy have been observed for unilateral MR scanning of food samples with skin and scales (i.e., salmon and tuna),[Citation13,Citation25] which suggests an advantage of MR scanning over conventional near infrared spectroscopy. This advantage is a physical consequence of that static and RF magnetic lines of force being not distorted by biomaterials as far as they are neither highly electrically conductive, ferromagnetic, nor paramagnetic.
Unfortunately, the accuracy of UFA quantification by T1 relaxometry was poor, as shown in Fig. ESM8. However, the obtained T1 data (Table ESM3) are useful for choosing the optimum TR value for the T1 full relaxation experiments. Note also that T1 relaxometry is very time-consuming compared with T2 relaxometry.[Citation14,Citation27] For example, while the measurement time for a single sample was approximately 15 min for CPMG data acquisition with 5000 echoes (), it was 4 min for saturation recovery data acquisition with only 13 data points (Fig. ESM5). The measurement time required for single-data point acquisition is thus 15 × 60/5000 ≈ 0.2 s for the CPMG method, and 4 × 60/13 ≈ 20 s for the saturation recovery method. Therefore, even if the accuracy of fatty acid quantification based on T1 relaxometry was much better than that shown in Fig. ESM8, T1 relaxometry is not recommended due to the long measurement time required.
In order to further develop live cattle scanning (), the next research step is the implementation of T2 relaxometry using a real MR scanner. It is straightforward to perform T2 relaxometry based on the CPMG method using a portable unilateral MR scanner. Unilateral MR measurements followed by analysis using EquationEquations. (1)(1)
(1) and (Equation2
(2)
(2) ) have been successfully applied to food samples (e.g., beef, kiwifruit, salmon, and tuna).[Citation15,Citation16,Citation24,Citation40] One possible MR system for such unilateral scanning is shown in Fig. ESM9.[Citation11] A small hand-held magnet with an investigation depth of approximately 1 cm can be used to scan the subcutaneous fat layer of live cattle. Although we usually do not eat the subcutaneous fat, its total MUFA content is reasonably correlated with that of the edible part, namely, intramuscular fat in marbled meat.[Citation41] Thus, it would be possible to estimate the total MUFA content of intramuscular fat of marbled meat of live cattle by measurement of the subcutaneous fat using the scanning system in Fig. ESM9.
Note that an advanced unilateral MR scanner with an investigation depth of approximately 3 cm is also being developed (Fig. ESM10).[Citation11] The scanner is for directly sensing intramuscular fat in the strip loin and trapezius muscles of live cattle beneath the body hair, skin, and subcutaneous fat layer. Using the large sensor unit, with a mass of as much as approximately 15 kg, would make this unit no longer “hand-held,” but instead would require mechanical support[Citation13] for safe and reliable operation of the scanner system. However, the system in Fig. ESM10 is better than that in Fig. ESM9 because it allows direct quantification of the UFA content of the edible part of live cattle. The following three points (A to C) should be noted to make the unilateral MR scanner more widely available to users in the beef industry.
A: The beef body temperature is not always 40.0°C[Citation30] and depends on the body site, weather, and season. T2 values depend on not only the UFA contents () but also the fat temperature.[Citation16] Thus, when measuring live cattle at stock farms and in cattle sheds, the in-situ measurement of the body temperature is important. Infrared cameras[Citation42] would be useful to measure the beef body temperature. Because the activation energy of the temperature dependence of T2 is known (approximately 26 kJ/mol),[Citation16] it is straightforward to convert T2 values listed in Table ESM3 obtained at 40.0°C into those for a different body temperature.
B: The whole system (Fig. ESM 9a) including the order-made permanent magnet, digital signal processor, and RF pulse amplifier is expensive (more than 100,000 USD) and heavy (over 100 kg). Low-pricing and downsizing are needed for the wide outdoor availability[Citation43] and the commercial spread in the beef industry.
C: The use of the digital transformation (DX) technology and artificial intelligence (AI) should be considered for the rapid, accurate, and reliable cattle measurement. For example, although manual operation is supposed in and ESM9, the DX-based automated system employing agricultural robots[Citation44] is desirable for the rapid measurement. The application of deep learning techniques with AI to the noisy time-series data analysis of the proton relaxation[Citation45] would be also useful for the accurate determination of T2 values.
The unilateral MR surface scanner in Figs. ESM9–10 is portable, and works with an AC 100-V commercial power supply. The CPMG pulse sequence for T2 relaxometry has been also installed in the scanner. Thus, although the points (A to C) mentioned above remain as technical problems to be solved in future, the unilateral scanner would pave the way to enable nondestructive, noninvasive, and in-situ monitoring of the temporal change in the UFA contents in live cattle at stock farms and in cattle sheds. The apparatus would contribute to the optimization of the feeding and fattening timing from the calf stage to the adult cattle stage prior to shipment[Citation7–10] in terms of the maximization of the UFA content in the subcutaneous fat layer (Fig. ESM9b) and in the marbled meat (Fig. ESM10b).
Conclusion
Proton relaxometry was performed for 18 fresh beef fat samples using a bilateral low-field (20 MHz) MR apparatus at 40.0°C to examine its potential applicability to in vivo, nondestructive, and noninvasive quantification of the UFA content of live cattle. The T2 values for the samples obtained by the CPMG method increased linearly with increasing UFA content. This allowed us to quantify the content of oleic acid, total MUFA, and total UFA with RMSEs of 2.5, 2.8, and 3.2 wt%, respectively. This T2-relaxometry-based measurement could be performed using a portable unilateral MR surface scanner with an investigation depth of a few centimeters. Thus, the scanner would enable in-vivo, nondestructive, and noninvasive quantification of UFA for live cattle at stock farms and in cattle sheds, which could be helpful for determining the best feeding and fattening timing from calf to adult, and the best timing of shipment, in terms of the maximization of the UFA content.
Supplemental Material
Download ()Acknowledgments
Comments by two anonymous reviewers were helpful. The 20-MHz proton NMR apparatus of the Center for Instrumental Analysis, Gunma University (Kiryu, Gunma) was used. X-ray CT images of the beef fat samples were obtained during preliminary experiments using a medical X-ray CT scanner at GSJ-Lab, AIST.
Disclosure statement
One of the authors, Y. N., is an inventor of the applied Japanese patent described in Ref. [12].
Supplementary material
Supplemental data for this article can be accessed online at https://doi.org/10.1080/10942912.2023.2244691
Correction Statement
This article has been corrected with minor changes. These changes do not impact the academic content of the article.
Additional information
Funding
References
- Smith, S. B.; Lunt, D. K.; Chung, K. Y.; Choi, C. B.; Tume, R. K.; Zembayashi, M. Adiposity, Fatty Acid Composition, and Delta-9 Desaturase Activity During Growth in Beef Cattle. Anim. Sci. J. 2006, 77(5), 478–486. DOI: 10.1111/j.1740-0929.2006.00375.x.
- Woods, V. B.; Fearon, A. M. Dietary Sources of Unsaturated Fatty Acids for Animals and Their Transfer into Meat, Milk and Eggs: A Review. Livest. Sci. 2009, 126(1–3), 1–20. DOI: 10.1016/j.livsci.2009.07.002.
- Vahmani, P.; Mapiye, C.; Prieto, N.; Rolland, D. C.; McAllister, T. A.; Aalhus, J. L.; Dugan, M. E. The Scope for Manipulating the Polyunsaturated Fatty Acid Content of Beef: A Review. J. Animal. Sci. Biotechnol. 2015, 6(1), 1–13. DOI: 10.1186/s40104-015-0026-z.
- Motoyama, M.; Sasaki, K.; Watanabe, A. Wagyu and the Factors Contributing to Its Beef Quality: A Japanese Industry Overview. Meat Sci. 2016, 120, 10–18. DOI: 10.1016/j.meatsci.2016.04.026.
- Gotoh, T.; Nishimura, T.; Kuchida, K.; Mannen, H. The Japanese Wagyu Beef Industry: Current Situation and Future Prospects-A Review. Asian-Australas J. Anim. Sci. 2018, 31(7), 933–950. DOI: 10.5713/ajas.18.0333.
- Smith, S. B.; Lunt, D. K.; Smith, D. R.; Walzem, R. L. Producing High-Oleic Acid Beef and the Impact of Ground Beef Consumption on Risk Factors for Cardiovascular Disease: A Review. Meat Sci. 2020, 163, 108076. DOI: 10.1016/j.meatsci.2020.108076.
- Park, S. J.; Beak, S. H.; Kim, S. Y.; Jeong, I. H.; Piao, M. Y.; Kang, H. J.; Fassah, D. M.; Na, S. W.; Yoo, A. P.; Baik, M., et al. Genetic, Management, and Nutritional Factors Affecting Intramuscular Fat Deposition in Beef Cattle — a Review. Asian-Australas J. Anim. Sci. 2018, 31(7), 1043–1061. DOI: 10.5713/ajas.18.0310.
- Mir, P. S.; Ivan, M.; He, M. L.; Pink, B.; Okine, E.; Goonewardene, L.; McAllister, T. A.; Weselake, R.; Mir, Z. Dietary Manipulation to Increase Conjugated Linoleic Acids and Other Desirable Fatty Acids in Beef: A Review. Can. J. Anim. Sci. 2003, 83(4), 673–685. DOI: 10.4141/A03-002.
- Cabiddu, A.; Peratoner, G.; Valenti, B.; Monteils, V.; Martin, B.; Coppa, M. A Quantitative Review of On-Farm Feeding Practices to Enhance the Quality of Grassland-Based Ruminant Dairy and Meat Products. Animal. 2022, 16, 100375. DOI: 10.1016/j.animal.2021.100375.
- Griebenow, R. L.; Martz, F. A.; Morrow, R. E. Forage-Based Beef Finishing Systems: A Review. J. Prod. Agric. 1997, 10(1), 84–91. DOI: 10.2134/jpa1997.0084.
- Nakashima, Y. Paving The Way To Measure Oleic Acid Content In Live Cattle! The AIST Press Release Web Site (In Japanese). 2022. https://www.aist.go.jp/aist_j/press_release/pr2022/pr20220905/pr20220905.html (accessed June 2, 2023).
- Nakashima, Y. Apparatus and Method for the Measurement of the Composition of Fatty Acids. Japanese patent (application number 2022-095132) 2022.
- Blümich, B.; Perlo, J.; Casanova, F. Mobile Single-Sided NMR. Prog. Nucl. Magn. Reson. Spectrosc. 2008, 52(4), 197–269. DOI: 10.1016/j.pnmrs.2007.10.002.
- Casanova, F.; Perlo, J., and Blümich, B. Eds. Single-Sided NMR, Springer: Berlin, 2011. DOI: 10.1007/978-3-642-16307-4.
- Nakashima, Y. Development of a Single-Sided Nuclear Magnetic Resonance Scanner for the in vivo Quantification of Live Cattle Marbling. Appl. Magn. Reson. 2015, 46(5), 593–606. DOI: 10.1007/s00723-015-0657-4.
- Nakashima, Y.; Shiba, N. Nondestructive Measurement of Intramuscular Fat Content of Fresh Beef Meat by a Hand-Held Magnetic Resonance Sensor. Int. J. Food. Prop. 2021, 24(1), 1722–1736. DOI: 10.1080/10942912.2021.1999261.
- Piao, S.; Okura, T.; Irie, M. On-Site Evaluation of Wagyu Beef Carcasses Based on the Monounsaturated, Oleic, and Saturated Fatty Acid Composition Using a Handheld Fiber-Optic Near-Infrared Spectrometer. Meat Sci. 2018, 137, 258–264. DOI: 10.1016/j.meatsci.2017.11.032.
- Goi, A.; Hocquette, J. F.; Pellattiero, E.; De Marchi, M. Handheld Near-Infrared Spectrometer Allows On-Line Prediction of Beef Quality Traits. Meat Sci. 2022, 184, 108694. DOI: 10.1016/j.meatsci.2021.108694.
- Wang, C.; Wang, S.; He, X.; Wu, L.; Li, Y.; Guo, J. Combination of Spectra and Texture Data of Hyperspectral Imaging for Prediction and Visualization of Palmitic Acid and Oleic Acid Contents in Lamb Meat. Meat Sci. 2020, 169, 108194. DOI: 10.1016/j.meatsci.2020.108194.
- Leighton, P. L.; Segura, J.; Lam, S.; Marcoux, M.; Wei, X.; Lopez-Campos, O.; Soladoye, P.; Dugan, M. E.; Juarez, M.; Prieto, N. Prediction of Carcass Composition and Meat and Fat Quality Using Sensing Technologies: A Review. Meat and Muscle Biology. 2020, 5(3), 12951, 1–21. https://doi.org/10.22175/mmb.12951.
- Chapman, J.; Elbourne, A.; Truong, V. K.; Cozzolino, D. Shining Light into Meat–A Review on the Recent Advances in in vivo and Carcass Applications of Near Infrared Spectroscopy. Int. J. Food Sci. Technol. 2020, 55(3), 935–941. DOI: 10.1111/ijfs.14367.
- Utsuzawa, S.; Fukushima, E. Unilateral NMR with a Barrel Magnet. J. Magn. Reson. 2017, 282, 104–113. DOI: 10.1016/j.jmr.2017.07.006.
- Morin, D. M.; Yan, P.; Augustine, M. P.; Balcom, B. J. An Optimized 2 MHz Unilateral Magnet with a Large Homogeneous Sensitive Spot. Appl. Magn. Reson. 2022, 53(2), 401–415. DOI: 10.1007/s00723-021-01455-7.
- Veliyulin, E.; van der Zwaag, C.; Burk, W.; Erikson, U. In vivo Determination of Fat Content in Atlantic Salmon (Salmo Salar) with a Mobile NMR Spectrometer. J. Sci. Food Agric. 2005, 85(8), 1299–1304. DOI: 10.1002/jsfa.2117.
- Nakashima, Y. Non-Destructive Quantification of Lipid and Water in Fresh Tuna Meat by a Single-Sided Nuclear Magnetic Resonance Scanner. J. Aquat. Food Prod. Technol. 2019, 28(2), 241–252. DOI: 10.1080/10498850.2019.1569742.
- Moraes, T. B.; Colnago, L. A. Noninvasive Analyses of Food Products Using Low-Field Time-Domain NMR: A Review of Relaxometry Methods. Braz. J. Phys. 2022, 52(2), 43. DOI: 10.1007/s13538-022-01055-1.
- Dunn, K. J.; Bergman, D. J.,; and LaTorraca, G. A., Eds. Nuclear Magnetic Resonance: Petrophysical and Logging Applications. Seismic Exploration: Pergamon, Amsterdam, 2002; Vol. 32
- Search Service of the Cattle Individual Identification Number Information. National Livestock Breeding Center ( Odakura, Nishigo-mura, Nishishirakawa-gun, Fukushima 961-8511, Japan). http://www.nlbc.go.jp/en/ (accessed June 2, 2023).
- Ministry of Education, Culture, Sports, Science and Technology, Japan. Standard Tables Of Food Composition In Japan 2015 (7th Ed.) 2015. https://www.mext.go.jp/en/policy/science_technology/policy/title01/detail01/1374030.htm (accessed June 2, 2023).
- Godyń, D.; Herbut, P.; Angrecka, S. Measurements of Peripheral and Deep Body Temperature in Cattle-A Review. J. Therm. Biol. 2019, 79, 42–49. DOI: 10.1016/j.jtherbio.2018.11.011.
- Provencher, S. W. A Constrained Regularization Method for Inverting Data Represented by Linear Algebraic or Integral Equations. Comput. Phys. Commun. 1982, 27(3), 213–227. DOI: 10.1016/0010-4655(82)90173-4.
- Kowalewski, J.; Levy, G. C.; Johnson, L. F.; Palmer, L. A Three-Parameter Non-Linear Procedure for Fitting Inversion-Recovery Measurements of Spin-Lattice Relaxation Times. J. Magn. Reson. 1977, 26(3), 533–536. DOI: 10.1016/0022-2364(77)90106-8.
- Hürlimann, M. D.; Griffin, D. D. Spin Dynamics of Carr–Purcell–Meiboom–Gill-like Sequences in Grossly Inhomogeneous B0 and B1 Fields and Application to NMR Well Logging. J. Magn. Reson. 2000, 143(1), 120–135. DOI: 10.1006/jmre.1999.1967.
- Hürlimann, M. D.; Burcaw, L.; Song, Y. Q. Quantitative Characterization of Food Products by Two-Dimensional D–T2 and T1–T2 Distribution Functions in a Static Gradient. J. Colloid. Interface. Sci. 2006, 297,1, 303–311. DOI: 10.1016/j.jcis.2005.10.047.
- Cheng, S.; Wang, X.; Liu, B. L. Low-Field Nuclear Magnetic Resonance Relaxation Characteristics of Fatty Acids with Different Chain Lengths and Degree of Unsaturation. Chinese J. Anal. Chem. 2018, 46, 281–287.
- Zverev, L. V.; Prudnikov, S. M.; Vityuk, B. Y.; Dzhioev, T. E.; Panyushkin, V. T. Determination of the Main Fatty Acids in Sunflower-Seed Oil by a Nuclear Magnetic Relaxation Technique. J. Anal. Chem. 2001, 56(11), 1029–1031. DOI: 10.1023/A:1012504708121.
- Nikolskaya, E.; Hiltunen, Y. Molecular Properties of Fatty Acid Mixtures Estimated by Online Time-Domain NMR. Appl. Magn. Reson. 2019, 50(1–3), 159–170. DOI: 10.1007/s00723-018-1046-6.
- Inoue, T.; Hisatsugu, Y.; Ishikawa, R.; Suzuki, M. Solid–Liquid Phase Behavior of Binary Fatty Acid Mixtures: 2. Mixtures of Oleic Acid with Lauric Acid, Myristic Acid, and Palmitic Acid. Chem. Phys. Lipids. 2004, 127(2), 161–173. DOI: 10.1016/j.chemphyslip.2003.10.013.
- Han, T.; Liu, J.; Liu, R.; Chen, W.; Yao, M.; Liu, X.; Xu, K.; Zhang, Z.; Li, C.; Wang, Y., et al. In vivo Near-Infrared Noninvasive Glucose Measurement and Detection in Humans. Appl. Spectrosc. 2022, 76(9), 1100–1111. DOI: 10.1177/00037028221092474.
- Capitani, D.; Sobolev, A. P.; Di Tullio, V.; Mannina, L.; Proietti, N. Portable NMR in Food Analysis. Chem. Biol. Technol. Agric. 2017, 4(1), 1–14. DOI: 10.1186/s40538-017-0100-1.
- Nogi, T.; Okagaki, T. Relationship of the Fatty Acid Composition for the Stored Fat and Intramuscular Fat in the Same Beef. Bull. Tottori. Anim. Husb. Exp. Stn. 2007, 35, 8–13. (in Japanese)
- Ma, S.; Yao, Q.; Masuda, T.; Higaki, S.; Yoshioka, K.; Arai, S.; Takamatsu, S.; Itoh, T. Development of Noncontact Body Temperature Monitoring and Prediction System for Livestock Cattle. IEEE Sensors J. 2021, 21(7), 9367–9376. DOI: 10.1109/JSEN.2021.3056112.
- Blümich, B.; Anders, J. When the MOUSE Leaves the House. Magn. Reson. 2021, 2, 149–160. DOI: 10.5194/mr-2-149-2021.
- Xie, D.; Chen, L.; Liu, L.; Chen, L.; Wang, H. Actuators and Sensors for Application in Agricultural Robots: A Review. Machines. 2022, 10(10), 913. DOI: 10.3390/machines10100913.
- Luo, G.; Xiao, L.; Luo, S.; Liao, G.; Shao, R. A Study on Multi-Exponential Inversion of Nuclear Magnetic Resonance Relaxation Data Using Deep Learning. J. Magn. Reson. 2023, 346, 107358. DOI: 10.1016/j.jmr.2022.107358.