
 ?Mathematical formulae have been encoded as MathML and are displayed in this HTML version using MathJax in order to improve their display. Uncheck the box to turn MathJax off. This feature requires Javascript. Click on a formula to zoom.
ABSTRACT
White chocolate, which does not contain cocoa mass, is less healthy than dark and milk chocolate. Due to its milk content, white chocolate can also cause issues for those with lactose intolerance or dairy allergies. To overcome these problems, a study was conducted by adding highly antioxidant encapsulated cinnamon extract (ECE) to vegan white chocolate formulated with different levels of soy protein isolate (SPI) and coconut flour (CF). This study aimed to examine the chocolate’s total phenolics, flavonoids, antioxidant activity (IC₅₀), protein and fat content, particle size distribution, texture, color, melting point, and sensory characteristics. The results showed that the addition of SPI and CF had a significant impact on the properties of the white chocolate, except for hardness. Incorporating 2% (w/w), ECE significantly increased the total phenolics, flavonoids, and antioxidant activity. Total phenolics and flavonoids were positively correlated with antioxidant activity. Vegan white chocolate formulated with 27% SPI, 10% CF, and 2% ECE was acceptable to panelists, and thus, this product can be potentially consumed by lactose-intolerant and vegan consumers.
Introduction
Chocolate is a processed food made from milled and roasted cocoa beans formulated with other ingredients, including sugar milk and emulsifier (depending on the type).[Citation1] There are three main types of chocolate: dark, milk, and white, which differ in the composition of cocoa solids, milk, and cocoa butter.[Citation2] The process of making chocolate involves several steps, namely mixing, grinding or refining, conching, tempering, molding, demolding, and packaging.[Citation3]
White chocolate differs from dark and milk chocolate as it does not contain cocoa solids, resulting in a lower antioxidant activity and fewer health benefits.[Citation4] This is because cocoa solids contain phenolic compounds, including phenolic acids, procyanidins, and flavonoids.[Citation5–7] Cocoa phenolic compounds have been studied for their human health benefits as antioxidants,[Citation6] antiradicals,[Citation8] and anticarcinogens.[Citation9]
To improve the functionality of white chocolate, additional sources of phenolic compounds and flavonoids can be added to increase its antioxidant activity. Cinnamon (Cinnamomum burmannii) is one of the food ingredients often used as an additive in chocolate products.[Citation10] Cinnamon extract contains phenolic and flavonoid compounds that have antioxidant activity and have been reported to enhance the health benefits of white chocolate.[Citation11] However, phenolic and flavonoid compounds degrade quickly during processing and storage because they are sensitive to light, heat, oxygen, and pH.[Citation12,Citation13] Additionally, cinnamon has a spicy taste and intense aroma, which affects consumer acceptance.
The cinnamon extract can be encapsulated with maltodextrin to mask the intense flavor and aroma. It can protect the phenolic compounds during chocolate processing, increase stability, and reduce size for easier handling.[Citation14] Also, according to Xiao et al.,[Citation15] maltodextrin has good film-forming ability among potential wall materials in encapsulation technology, forming a protective film to provide an antioxidant barrier and improve overall thermal stability. In addition, maltodextrin is widely recognized to have the ability to prevent the coalescence of oil droplets and to increase the solubility of microcapsules. Due to its cost-effectiveness, maltodextrin is extensively used in the food, pharmaceutics, and cosmetic industries, particularly for encapsulating essential oils, natural pigments, oils, probiotics, drugs, and other core materials.
Aside from its antioxidant activity aspect, white chocolate may cause specific issues, particularly for people with lactose intolerance or dairy allergies.[Citation16] A combination of protein-rich (skim) and fat-rich (whole) milk is often used to make white chocolate.[Citation17] According to Glicerina et al.,[Citation18] white chocolate uses only 14% skim and 3.5% whole milk. Milk plays a vital role in shaping the physical properties of white chocolate. Skim milk, as a source of protein, contributes to the compact texture and fluidity of white chocolate. Whole milk, as a source of fat, contributes to the creamy taste and, together with cocoa butter, softens the texture of white chocolate.[Citation19] Thus, an animal-free white chocolate formulation is needed to overcome this. Products free of animal-based ingredients are known as vegan products.[Citation20] Vegan white chocolate has excellent prospects for specific target markets.
Among several types of plant-based protein, soybeans are considered for replacing milk powder in white chocolate because they contain a high protein of approximately 35%, higher than other types of beans.[Citation21] Moreover, one of the products derived from soybeans, soy protein isolate (SPI), contains no less than 90% protein (dry basis).[Citation22] SPI contains amino acids that are protein digestibility-corrected amino acids (PDCAAS) equivalent to animal and egg proteins.[Citation22] It means that the use of SPI also has the potential to increase the protein content of white chocolate. Nevertheless, according to Selamat et al.,[Citation23] too much SPI can make the texture of white chocolate hard and difficult to melt, which consumers do not like.[Citation24] Therefore, a combination of flour-based ingredients that are smooth and soft, high in fat and fiber, gluten-free, high in protein, and have healthy functional properties is needed.
Coconut flour (CF) is a viable alternative for vegan product ingredients. CF is a by-product of coconut milk production. According to Hopkin et al.,[Citation25] the coconut flesh is dried at low temperatures after the coconut milk is extracted. The flesh is then ground into a fine, soft powder. It contains 14–18 grams of protein and 11–14 grams of fat per 100 grams of flour, and approximately 75% of total carbohydrates come from dietary fiber. It is becoming increasingly popular for people on carbohydrate and gluten-free diets.
There is negligible research on vegan white chocolate formulated with SPI and CF. Several studies have focused on using processed soy products in chocolate products. Selamat et al.[Citation23] added 10% SPI to milk chocolate for protein enhancement. Soy flour was added to the milk chocolate compound to increase its texture and hardness by Yeganehzad et al..[Citation26] Different research groups have conducted other studies.[Citation27,Citation28] However, no research has investigated vegan white chocolate’s physicochemical properties formulated with SPI and CF. Previous research shows that formula modification by adding plant-based protein (i.e., mung bean) influenced chocolate’s physical and nutritional properties and altered consumer acceptance of the chocolate.[Citation29,Citation30]
Different studies have been conducted on adding encapsulated extracts of antioxidant compounds to chocolate products.[Citation31] Lonarević et al.[Citation32] added 6, 8, and 10% encapsulated blackberry juice extract to white chocolate, showing increased total phenolics and a significant color difference. Muhammad et al.[Citation33] found that adding 2% encapsulated cinnamon extract (ECE) to white chocolate milk increased total phenolics, flavonoids, and antioxidant activity. However, they found that incorporating encapsulated cinnamon extract can somewhat change chocolates’ quality attributes, including particle size distribution, texture, color, and melting point.
Thus, adding encapsulated cinnamon extract to vegan white chocolate has not yet been carried out up till now. Therefore, it is necessary to investigate the physicochemical, antioxidant, and sensory properties of white chocolate formulated with SPI and CF, incorporating ECE. It would lead to a vegan white chocolate product with health benefits for specific target audiences, especially lactose-intolerant and vegan consumers.
Materials and methods
Materials
Cocoa butter was obtained from Barry Callebaut with a pH of 5–6.2, while cinnamon was purchased from Mount Kerinci, Jambi, Indonesia. Similarly, organic CF and SPI were obtained from Khas Nusantara and Natlab. Other ingredients included sugar, maltodextrin with DE 10–12, soy lecithin, skim milk, cream milk, vanilla powder, and olive oil. Chemical analysis materials, which were analytical grade from Sigma Aldrich or Merck, included ethanol, Kjeldahl tablets, aluminum chloride hexahydrate, DPPH (2.2-diphenyl-1-picrylhydrazyl), gallic acid standard, Folin-Ciocalteu reagent, quercetin standard, methanol, sodium carbonate, n-hexane, sulfuric acid, and distilled water.
Cinnamon extraction
The cinnamon was first dried in an oven for 1 hour, ground in a mill, and sieved until the 80-mesh cinnamon powder was collected. Furthermore, the powder was extracted with an ultrasonicator for 45 minutes at 60% amplitude by dissolving in 96% ethanol at a ratio of 1:5 w/v. The extract was filtered with a vacuum filter and concentrated with a rotary evaporator (R300, BUCHI, Switzerland) at 50°C until the ethanol solvent was completely evaporated.
Cinnamon extract encapsulation
Cinnamon extract was encapsulated according to the studies of Todorović et al.[Citation34] with slight modifications. Maltodextrin and cinnamon were used as the wall and core materials at 10:1 w/w. A total of 150 g of maltodextrin was dissolved in 500 mL of distilled water to prepare the solution of the wall material. Meanwhile, the solution was hydrated overnight on a 500-rpm magnetic stirrer at room temperature.
Approximately 15 g of cinnamon extract was dissolved in 80 mL of distilled water and sonicated for 30 seconds at room temperature. The required amount of dissolved extract was slowly added to the prepared wall material solution using a magnetic stirrer (79–1, Jiangsu Jinyi Instrument Technology Co., Ltd., China) at 1000 rpm for 5 minutes. After stirring, the solution was quantitatively transferred to a centrifuge tube and diluted with distilled water to a volume of 35 mL. Subsequently, the prepared solution was mixed using a mixer homogenizer (GLH-850, Omni, USA) at 10,000 rpm for 1 minute. The solution was frozen and lyophilized using a freeze dryer (ALPHA 1–4 LSCplus, Martin Christ, Germany) for 48 h at − 50°C, 0.38 mbar pressure. In addition, the freeze-dried material obtained was ground into powder using a mortar. The powder was placed in a tightly closed, dark container and stored in a refrigerator.
White chocolate preparation in various formulas
The main ingredients for producing white chocolate consisted of cocoa butter, milk, soy protein isolate (SPI), coconut flour (CF), encapsulated cinnamon extract (ECE), and sugar prepared according to the formula in . The ingredients were mixed and conched in a chocolate refiner, and the process took ±3 hours at a temperature of 45–55°C to obtain a smooth, creamy chocolate texture with no grittiness. It reduces the viscosity and moisture content and increases the aroma of the chocolate. The process continued with tempering, which consisted of three stages aimed at homogenizing the chocolate fat crystals. In the first stage, the chocolate was heated to a temperature of 45°C and was lowered to 27–28°C on a marble table in the second stage while leveling with a scraper. In the third stage, the chocolate was tempered again, reaching a temperature of 31°C. Subsequently, the tempered chocolate was molded and stored in a refrigerator for 24 hours. The bar obtained was packaged using aluminum foil for further analysis.
Table 1. White chocolate samples in different formulations.
Fat extraction (defatting)
Defatting of chocolate was performed to determine total phenolics, total flavonoids, and antioxidant activity (IC₅₀). The procedure was slightly modified by Ioannone et al.,[Citation35] and a 6 g sample was mixed with 37.5 mL of n-hexane. Furthermore, the sample was centrifuged to separate the sediment and the supernatant containing the fatty material. Fat extraction was performed three times before discarding the supernatant, and the hexane pellet was evaporated in an acid cabinet to obtain a defatted sample placed in a dark container for further analysis.
Total phenolic content determination
Total phenolics were determined following the procedure of Indiarto et al.[Citation36] with modifications. In addition, a 200 mg sample was dissolved in distilled water and put into a 25 mL volumetric flask. The sample solution was pipetted to 1 mL before adding 0.5 mL of the 50% Folin-Ciocalteu reagent and 2.5 mL of 20% Na₂CO₃. Meanwhile, the volume was adjusted with distilled water to the limit mark of the volumetric flask. The sample was homogenized and incubated in a dark room for 40 minutes. The absorbance of the sample was also measured against the reagent blank using a UV-Vis spectrophotometer (VIS-7220N, Beijing Rayleigh Analytical Instrument Co., Ltd., China) at a wavelength of 725 nm. The results were used to calculate the total phenolic content of the sample expressed in µg GAE/g sample.
Total flavonoid content determination
Total flavonoids were determined following the procedure of Indiarto et al.[Citation37] with modifications. The samples of 400 mg were dissolved in distilled water to a volume of 10 mL. Subsequently, 1 mL of the sample was added to 3 mL of methanol, 0.2 mL of 10% AlCl₃ and 0.2 mL of 1 M CH₃COOK. Distilled water was also used to adjust the volume to 10 mL, and the sample was incubated for 30 minutes in a dark room. The absorbance of the sample was measured using a UV-Vis spectrophotometer (VIS-7220N, Beijing Rayleigh Analytical Instrument Co., Ltd., China) at 415 nm. Similarly, the total flavonoid content, expressed in µg QE/g sample, was calculated from the absorbance results.
Antioxidant activity (IC₅₀) determination
The antioxidant activity was determined using the method described by Indiarto et al.,[Citation38] with some modifications. To 2 mL of sample, 0.5 mL of DPPH solution (160 ppm) dissolved in methanol was added, and a vortex mixer was used to homogenize the tube. Furthermore, the sample was incubated in a dark room for 30 minutes, and a UV-Vis spectrophotometer (VIS 7220N, Beijing Rayleigh Analytical Instrument Co., Ltd., China) was used to measure absorbance at 517 nm. The results were expressed as an IC₅₀ value, the sample concentration needed to inhibit 50% of the free radicals in DPPH. Additionally, the absorbance value was used to calculate the DPPH inhibition (%) through the following equation:
IC₅₀ value (mg/mL) was calculated by entering 50 in the linear regression equation obtained from the inhibition curve versus sample concentration (ppm).
Protein and fat content analysis
Proximate analysis of protein[Citation39] and fat in chocolate was determined according to the AOAC method.[Citation40] Subsequently, protein and fat contents were expressed as percentages.
Particle size distribution determination
Particle size distribution analysis by laser diffraction analyzer followed the procedure of Feichtinger et al.[Citation41] with slight modifications. A sample of 0.2 grams was melted at 50°C, dissolved in olive oil at room temperature, and homogenized. The solution was sonicated in an ultrasonic bath for 3 minutes to ensure particle dispersion and aggregation breakup. Furthermore, homogenization was carried out by stirring at 2000 rpm before loading the sample into the laser diffraction particle size analyzer (LS 12 320, Beckman Coulter, Inc., US). The analysis results were calculated as volume-based particle distributions using laser diffraction sizing software with parameters d10, d50, and d90. These parameters were used to calculate the Span through the following formula:
Texture profile analysis
The texture of white chocolate was analyzed using the Stable Micro System Texture Analyzer (TA.XTplusC, Stable Micro System Ltd., UK) according to Afoakwa et al.[Citation42] with slight modifications. Chocolate samples were equilibrated at room temperature for 2 hours, and texture analysis was performed using Exponent Lite Express 6.1.16.0 software. In addition, the program adjusted the probe speed to 1.0 mm/s, 5.0 mm/s, and 10.0 mm/s for the pretest, test, and posttest, respectively. The drop distance of the probe was set at 50 mm above the sample surface, penetrated 30 mm downward, and returned to the starting position. Meanwhile, the sample was pressed with a 2 mm diameter probe in a 25 kg load cell, and the parameters observed were hardness, springiness, cohesiveness, adhesiveness, gumminess, chewiness, and resilience.
Melting behavior
The melting behavior of the chocolate was analyzed by Differential Scanning Calorimetry (DSC) (Shimadzu DSC-60 Plus, Japan) following the study of Subroto et al..[Citation43] Samples of approximately 5 mg were placed in a closed aluminum pan, while an empty pan was used as a reference. The chocolate samples were cooled from room temperature to −30°C and heated to 80°C at a rate of 5°C/minute. Furthermore, the airflow was N₂, and the samples were read using TA-60WS software, allowing the thermogram to show the melting profile.
Color characteristics
The color characteristics of chocolate using a chromameter are based on Muhammad et al.[Citation44] with some modifications. Samples were prepared in uniform sizes, and the chromameter (CM 5, Konica Minolta, Japan) used for analysis was calibrated using a calibration plate. The color parameters analyzed include L* (lightness), a* (redness to greenness), and b* (yellowness to blueness). Meanwhile, the determination of the total color difference (∆E) and calculation of the whiteness index (WI) was carried out using the following formula:
The ΔE values were classified into very different (∆E > 3), different (1.5<∆E < 3), and slightly different (∆E < 1.5)[Citation36]
Organoleptic evaluation
The chocolate organoleptic evaluation was adapted from the study of Indiarto et al.,[Citation37] with slight modifications, and the test consisted of 6 variations of the formula. Additionally, the variations were tested using the hedonic test to determine the level of acceptance based on the panelists’ preferences. In this context, the hedonic test was carried out with the participation of 25 semi-trained panelists. The parameters evaluated from each sample included color, aroma, taste, aftertaste, hardness, mouthfeel, and acceptability. The results of the sensory test were known through a scoring filled by a scale of 1–5, namely dislike very much (1), dislike (2), neither like nor dislike (3), like (4), and like very much (5).
Statistical analysis
This study included six white chocolate treatments with three batches measured in duplicate. Moreover, statistical analyses were performed using IBM SPSS Statistics software, version 26.0 for Windows (IBM Corp., Armonk, NY), and the significant effect of the treatment was determined by a one-way analysis of variance. Tukey’s test was used for further comparison when there was a significant difference at the 95% confidence level, and the data were presented as the mean (standard deviation).
Results and discussion
Total phenolic content
Based on , there is a significant effect (p-value <.05) on the total phenolics produced by a white chocolate formulation containing SPI, CF, and ECE. The Tukey test results showed that white chocolate samples had significantly different total phenolics. The total phenolic content of the white chocolate ranged from 26.54 µg GAE/g to 194.63 µg GAE/g. Sample F has the highest total phenolic content, as shown in . Moreover, the addition of 2% ECE was able to increase the total phenolic content of samples E, F, and G by 13.71%, 37.46%, and 22.15%, compared to the initial amount in B, C, and D. The difference in the samples was due to different total phenolic content before adding ECE.
Table 2. Total phenolic content, total flavonoids, and antioxidant activity of white chocolate in different formulations.
A total phenolic content test was also performed on the cinnamon extract; the result was 6.62 mg GAE/g after encapsulation with 0.43 mg GAE/g. The result decreased after the microencapsulation treatment, which was consistent with the study of Santiago-Adame et al.,[Citation45] and the presence of maltodextrin increased the total solids in the microcapsules. Therefore, the measured total phenolics were lower, and the maltodextrin-encapsulating compounds did not react to the bioactive components of microcapsules.
The type of solvent may also affect the total phenolic content of cinnamon extract. The extraction efficiency depends on the like – dissolve – like the principle of a compound that dissolves in the same solvent. Phenolic dissolves in polar solvents such as methanol, ethanol, acetone, and water. Muhammad et al.[Citation11] found that the total phenolic content of the methanol extract of cinnamon was higher than that of ethanol extract. Methanol is toxic and unsafe for human consumption. In contrast, ethanol is safe and produces a higher total yield than other polar solvents.
Another factor affecting the total phenolic content of a cinnamon extract is the extraction method. According to Duval et al.,[Citation46] the UAE method shortens the extraction time, is inexpensive compared to conventional methods, and relies on the extraction ability. The method is still preferred for extracting bioactive compounds from various plants.
The total phenolic content of sample F (194.63 µg GAE/g) is different compared to non-vegan white chocolate with added cinnamon extract (1060.6 µg EE/g) in the study by Muhammad et al..[Citation11] The total phenolics differed because cinnamon oleoresin, a resin and essential oil mixture, was added directly to the white chocolate.[Citation11] Therefore, the phenolic content was high since the encapsulant was not used as the coating material, and the percentage affected the result.
shows that the total phenolics of samples B, C, and D increased by 323.81%, 439.05%, and 183.81% compared to non-vegan white chocolate sample A. Among samples B, C, and D, the total phenolics of C were the highest due to SPI and CF at 1364–1384 µg GAE/g and 408.6–430.6 µg GAE/g, respectively. Moreover, SPI was dominated by flavonoids,[Citation47] while CF consisted of flavonoids and phenolic acids such as gallic, caffeic, salicylic, and p-coumaric acid.[Citation48,Citation49] Among other plants, phenolic compounds were synthesized by soybeans and coconuts as a form of self-defense against adverse environmental conditions.
Sample A has the lowest total phenolics derived from milk at 63 µg GAE/g.[Citation50] Some phenolic compounds in animal milk are phenol, cresol, thymol, and carvacrol.[Citation51] Several studies have shown that the total content of phenolic compounds in white chocolate is very low. Lončarević et al.[Citation52] and Muhammad et al.[Citation11] reported a total phenolic content of 0.0004 µg GAE/g and 47.6 µg EQ/g, respectively. These values are very low compared to dark and milk chocolate 12,710 µg GAE/g and 3630 µg GAE/g, respectively.[Citation53]
Total flavonoid content
shows that formulating white chocolate with SPI, CF, and ECE has a significant effect on the total flavonoids produced (p-value <.05). According to Tukey’s tests, sample A’s total flavonoids significantly differed from B, C, D, E, F, and G. However, sample E was not significantly different from B and D since the total flavonoids of white chocolate ranged from 2.50 µg QE/g to 37.49 µg QE/g. Sample F has the highest total flavonoids, and this is the result of the total phenolic analysis. Gulcin et al.[Citation54] reported that phenolic compounds were dominated by flavonoids, which ECE and the composition of sample F influenced. The addition of 2% cinnamon extract increased the total flavonoids of samples E, F, and G by 33.32%, 57.93%, and 99.85%, compared to the initial amount in B, C, and D. The variation in E, F, and G was due to different total flavonoids before adding ECE.
In the present study, the total flavonoids of the extract were 84.33 µg QE/g, and the ECE was 0.31 mg QE/g. As with the total phenolics, the encapsulated extract was influenced by the percentage of extract used compared to the coating material. In addition, results may be more optimal when maltodextrin is combined with other encapsulation materials. The combination of coating materials improves and complements the functional properties to produce good-quality microcapsules.
Based on , vegan white chocolate’s total flavonoids are higher than non-vegan. Therefore, SPI and CF could increase the total flavonoids of samples B, C, and D by 349.60%, 849.40%, and 550%, compared to A. Sample C had the highest total flavonoids because of SPI and CF compounds. In a study by Bolanho and Beleia,[Citation55] the total flavonoids of SPI were reported to be 788–831 µg QE/g. Isoflavones were the most common compound found in soy, and they showed potential when binding to proteins. Bolanho and Beleia[Citation55] reported that the isoflavone content of soybeans decreased after processing into SPI. It was because the alkaline pH used during the extraction process could change the molecular charge of proteins and affect their binding to isoflavones. Meanwhile, the total flavonoids in coconut were known to be around 8840–115000 µg QE/g. Flavonoid compounds in coconut included flavan-3-ols (catechin, epicatechin, and epigallocatechin), flavonols (myristin, quercetin, and kaempferol), flavonol glycosides (rutin) and flavones (luteolin and apigenin).[Citation56]
Sample A has the lowest content of total flavonoids compared to the others. Cheng et al.[Citation57] also showed that white chocolate had very low flavonoids, approximately 77 µg CAE/g. It was related to the composition of white chocolate, which contained no cocoa solids. Flavonoid compounds such as catechins and epicatechins were found in cocoa beans. The total flavonoids in sample A were derived from milk known to contain flavonoids of 104 µg QE/g.[Citation50] The aglycone compounds quercetin, luteolin, and apigenin were found in small amounts in milk.[Citation58]
Antioxidant activity (IC₅₀)
Based on , the formulation of white chocolate with SPI, CF, and ECE significantly affects (p-value <.05) IC₅₀ value. According to Tukey’s test results, the IC₅₀ of sample A was significantly different from B, C, D, E, F, and G. Sample C showed no statistically significant variance when compared to B and D, which reported the analogous findings observed with F, E, and G. The IC₅₀ of white chocolate ranged from 37.29 mg/mL to 83.87 mg/mL. There was a decrease in the value after adding ECE. Compared to the initial amount in B, C, and D, the IC₅₀ of samples E, F, and G were decreased by 31.02%, 23.47%, and 50.50%.
Sample G has the lowest IC₅₀ value and the strongest antioxidant activity compared to others. The percentage decrease was higher than in the IC₅₀ of dark chocolate with ECE in Praseptiangga et al.,[Citation10] which was 46%. The decrease shows the lower concentration of white chocolate required to counteract DPPH-free radicals. Therefore, the active compounds in the ECE added to the vegan white chocolate could potentially affect the increase in antioxidant activity. Cinnamon antioxidants are derived from phenolic compounds, such as flavonoids, eugenol, cinnamaldehyde, linalool, and terpineol.[Citation59]
The encapsulated and normal cinnamon extract had an IC₅₀ value of 0.234 mg/mL and 0.003 mg/mL, respectively, which is lower than the IC₅₀ value of ascorbic acid 0.0025 mg/mL as standard. However, the ECE IC₅₀ in this study is stronger than the Simbine et al.[Citation60] study, which used cinnamon C. zeylanicum from Chile and encapsulated by spray-drying. The IC₅₀ value of the ECE may be influenced by the type of cinnamon and encapsulation method used. Different types of cinnamon have different active compounds, which affect its antioxidant activity. Phenolic and flavonoid compounds have hydroxyl groups that reduce DPPH free radicals,[Citation6,Citation61] while spray-drying methods may reduce antioxidant activity due to high temperatures.[Citation62]
The IC₅₀ value of vegan white chocolate was lower than non-vegan, showing that SPI and CF could increase antioxidant activity. The IC₅₀ values of samples B, C, and D were lower by 21.46%, 25.07%, and 10.18% compared to A. Sample C had the lowest values of the three vegan white chocolates at 62.84 mg/mL due to the composition of SPI and CF, which contained antioxidants.
According to Ayrancı et al.,[Citation63] soy protein had an antioxidant activity of 2.64 mg/mL. SPI contained phenolic compounds, specifically isoflavones reported to inhibit DPPH free radicals,[Citation64] and CF had an IC₅₀ of 74–80 mg/mL.[Citation49] The antioxidant activity of CF was obtained from vitamins, a natural antioxidant found in coconut fruit.[Citation65] Vuthijumnonk and Rajchasom[Citation65] found that the percentage of DPPH inhibition in cookies increased by substituting wheat flour (10.98%) with CF (32.05%). According to Adeloye et al.,[Citation66] DPPH inhibition in corn flour increased from 56% to 68% after blending with CF in composite flour production.
Sample A had the highest IC₅₀ value compared to the others, and the antioxidant activity was the weakest. It was related to the previous test results’ low total phenolic and flavonoid content. Therefore, the IC₅₀ value was high, showing that the antioxidant activity was very weak. In a previous study by Muhammad et al.,[Citation33] white chocolate reported a weak activity of 0.4 mg TAE/g. The value measured in sample A was derived from milk containing antioxidants from protein, β-carotene, as well as vitamins E and C.[Citation51] The milk’s antioxidant capacity was 31.4 µg TE/mL.[Citation67]
In this research, in the same cases, sample G was found to have higher antioxidant activity despite lower phenolic and flavonoid content (e.g., comparison between G and F as well as G and E). shows that the effect of total flavonoid content is generally more pronounced than total phenolics. This agrees with the previous research by Muhammad et al.,[Citation68] which explains that the antioxidant activity of each compound depends on the number and arrangement of hydroxyl groups in the molecules of interest. Furthermore, it varies depending on the molecular structure and the method used. It implies that flavonoids play a greater role in DPPH radical-scavenging activity than other phenolics. The difference in the type of flavonoid may also be the reason for the higher antioxidant activity in sample G despite lower phenolic and flavonoid content.
Protein content
Based on , the formulation of white chocolate with SPI and CF significantly affected the protein content (p-value <.05). Tukey’s post hoc test results showed that all white chocolate samples had significantly different protein content, ranging from 3.14% to 30.12%.
Table 3. Protein and fat content of white chocolate in different formulations.
shows samples B and A have the highest and lowest protein levels, respectively. The concentration of SPI used was directly proportional to the protein content of white chocolate. According to Alem Zaker et al.,[Citation69] adding 30% SPI to cookies could raise the protein level by 173% from 5.76% to 15.7%. SPI had a protein content of > 90% and better digestibility than flour and soy protein concentrate. In addition, the amino acid composition of SPI was similar to milk, with less methionine and cysteine. It was made by alkaline extraction and isoelectric precipitation. Proteins had an isoelectric point of pH 4–5, and the SPI production process removed anti-nutritional factors with stiff cell walls affecting protein digestibility. In the final stage of intestinal digestion, the highest amino acids of SPI were released for better absorption. A recent study mentioned that the production of SPI-based infant formula was gaining popularity in replacing cow’s milk due to lower allergic reactions.[Citation21] In addition, the increased amount of protein due to using SPI could effectively combat malnutrition, including meeting the protein needs of lactose-intolerant and vegan consumers.[Citation70]
Sample D has the lowest protein content compared to the other vegan samples. This may be due to the higher percentage of CF used in chocolate production. However, it is higher than the non-vegan white chocolate sample A. CF and skim milk’s protein content were 15–22% and 31–35%, respectively.[Citation71] The high protein content results might be due to the percentage of CF (37%) used in the production of chocolate in each formulation, which was higher than skim milk (27%). CF might increase the amount of amino acids, particularly lysine, in food products. Lysine is an essential amino acid that is part of the basic composition of antibodies. The amino acid strengthens body cells’ basic and normal circulation.
The protein content of sample A was derived from milk, and in the study by Lončarević et al.,[Citation72] non-vegan white chocolate had a protein content of 5.28%, higher than the result obtained in this study. The difference in protein content might be due to the types of dairy products used. Commercial dairy products vary in protein content due to several factors, such as the composition of the cow’s milk, including the type of milking, age, disease, and diet. The percentage of skim milk and the use of other protein sources, such as whey powder, in white chocolate products can also affect the protein content.
Fat content
The formulation of white chocolate with SPI and CF significantly affected the fat content (p-value <.05). According to Tukey’s test results, the fat content of sample A was significantly different from that of B and D but not from that of C. The fat content of the white chocolate produced ranged from 39.96% to 49.61%. Based on , Samples D and B have the highest and lowest fat content, respectively. The high-fat content in sample D is due to CF, which is approximately 10.7–33.56%.[Citation73] According to Hossain et al.,[Citation74] adding 30% CF can increase the fat content of cake products by 93%, from 20.23% to 39.10%. Subsequently, Stoin[Citation75] reported that 50% CF could increase the fat content of cookies to 33.48% while being acceptable to panelists in the hedonic test. CF was free of trans and saturated fats, which had negative health effects, such as raising cholesterol levels (LDL).
Sample D used the most CF in the formulation compared to the others, resulting in a high fat content. In sample A, the percentage of solid fat used to manufacture cream milk was only 10%. It was lower than in sample D, where the fat content of cream milk was 27%.[Citation71] White chocolate samples B and C had a lower fat content than D because SPI was a product of fat-free soybeans.
The composition of high-fat ingredients, such as cocoa butter, CF, and cream milk, affected the fat content of white chocolate. The cocoa butter composition was consistent with international standards and requirements in major chocolate-consuming markets. The composition in white chocolate must be ≥ 20% since the sample is within the range of fat content at 31.5–67%.[Citation76]
Particle size distribution
The range of particle size values obtained for white chocolate was 0.47–2.12 µm (). The largest particle size was from samples C and G, while the smallest was from B and E. Particle size is related to the protein and fat content, and in the study of Liang and Hartel,[Citation77] chocolate with high-fat has a larger size. According to Rakin et al.,[Citation78] the particle size of chocolate decreased with increasing protein content. The large size caused sandiness when chocolate was consumed. Even though the small size makes the texture of chocolate not sandy, fat (cocoa butter) is also required to reduce viscosity and hardness.[Citation78]
Table 4. Particle size distribution values of white chocolate in different formulations.
White chocolate’s particle size distribution curve is unimodal for all samples (). The white chocolate samples are homogenized and show a large surface area.[Citation79] According to Afoakwa et al.,[Citation42] the shape of the particle size distribution curve is associated with the d90, which is directly proportional to the number of peaks.
Figure 1. Particle size distribution curves of white chocolate in different formulations. A (skim milk 27%, full-cream milk 10%), B (SPI 37%), C (SPI 27%, CF 10%), D (CF 37%), E (SPI 37%, ECE 2%), F (SPI 27%, CF 10%, ECE 2%), G (CF 37%, ECE 2%), SPI (Soy Protein Isolate), CF (Coconut Flour), ECE (Encapsulated Cinnamon Extract).
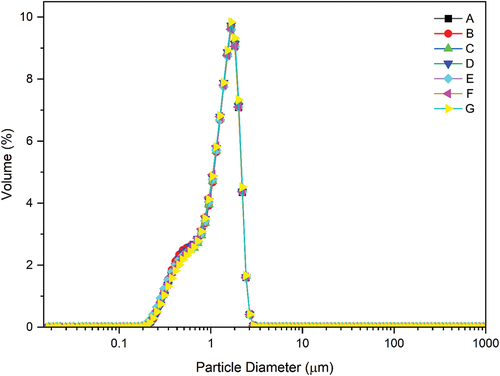
The span value shows the uniformity of the particles in the white chocolate. The closer the span value is to zero, the more uniform the particle distribution is.[Citation79] In addition, the highest and lowest span values were obtained for samples E and G, respectively. The protein content of the sample is directly proportional to the span value due to the increased complexity of the white chocolate structure.[Citation78] The particle size test results in this study are consistent with the chocolate products, having a particle size value of <20 µm, according to Beckett.[Citation80]
Texture profile analysis
The formulation of white chocolate with SPI, CF, and ECE significantly (p-value <.05) affected the resulting texture profile. Tukey’s test results showed that sample A’s hardness significantly differed from B, D, E, and G but not C and F. The hardness of B and E were not significantly different from samples D and G.
Hardness is the force required to produce a given deformation in chocolate. In addition, this force describes the stiffness and brittleness of the chocolate.[Citation33] Sample E had the highest hardness value and protein content, as shown in . There is a directly proportional relationship between the protein content and the hardness value of a product. Some of the functional properties of protein include fat and water absorption, emulsifying power, foaming power, and gelation.[Citation81] According to Selamat et al.,[Citation23] SPI absorbs cocoa butter and reduces viscosity to elevate chocolate’s hardness during molding. Lončarević et al.[Citation32] found that adding blackberry microcapsules could increase the hardness of white chocolate. Microcapsules also increased the solid volume fraction of white chocolate due to increased particle interaction.[Citation33] From the Tukey test, adding extracts did not significantly affect the hardness. Sample D had the lowest hardness value due to the highest fat content, as shown in . The fat in sample D consists of cocoa butter and solid fat from soybean powder. The composition of sample D is higher than that of others, considering the concentration of soy flour in B and C, as well as cream milk in A. Solid fat in white chocolate was useful for softening and lowering the melting point to facilitate the melting properties in the mouth.[Citation82] In addition, hardness is also influenced by the manufacturing process, particularly the tempering[Citation83] method causing the cocoa butter to crystallize properly. Meanwhile, hardness is the result of the interaction of the crystallized fat continuous phase with the dispersed solid particles.[Citation82]
Table 5. Texture profile analysis values of white chocolate in different formulations.
Springiness describes the ability of the product to return to its original shape. This property is measured by the recovery time between the end and the start of the first and second bite.[Citation84] The energy required for chewing is higher when the springiness value is increased.
shows that the higher the SPI, the lower the springiness. Furthermore, the springiness of sample A was significantly different from E but not significantly different from B, C, D, F, and G. In a study by Majzoobi et al.,[Citation85] the property decreased by adding SPI and encapsulated cinnamon extract (ECE) to the product.
Based on , SPI increased the values for cohesiveness, adhesiveness, gumminess, chewiness, and springiness. Cohesiveness shows the strength of the internal bonding of the ingredients in food. The value describes the ability of the product to remain compact when force is applied. The cohesiveness of sample A was significantly different from B and D but not C, E, F, and G. Samples B and E was not significantly different from each other, a trend also observed in C and F, as well as D and G. The addition of ECE had no significant effect on the cohesiveness value. According to Afoakwa et al.,[Citation42] cohesiveness is related to particle size distribution and fat content of white chocolate. High fat content caused an increase in the particle size of white chocolate and resulted in a decrease in the cohesiveness value. Smaller particles fill the spaces between the larger counterparts when sizes with increased surface areas are evenly distributed. This reduced the cohesiveness and consistency of the white chocolate but increased the brittleness.
Adhesiveness describes the attracting force between the surface of the food and other materials. The adhesiveness of sample A is significantly different from B, C, D, E, F, and G. This property is directly proportional to the SPI value of the white chocolate. According to Chandra and Shamasundar,[Citation86] a product with high adhesiveness value must be soft-textured. The rise in the cohesiveness and adhesiveness values is due to the ECE, which increases the solid content of the white chocolate.[Citation33]
Gumminess is the energy required to break down food before chewing and swallowing. The energy needed for chewing is known as chewability. The gumminess of sample A is significantly different from D, E, and G. Samples B and E are not significantly different. This trend is also observed in C and F. Furthermore, the gumminess of sample A is significantly different from D, E, and F. Samples B and E are not significantly different, a trend observed in C and F as well as D and G. The addition of ECE has no significant effect on the chewiness value. Meanwhile, the gumminess and chewiness values increased with the addition of SPI. This is consistent with the study of Yusof et al.,[Citation87] where gumminess and chewiness values were directly proportional to the hardness.
Resilience is the recovery of a sample from deformation in terms of speed and strength.[Citation86] In , sample A is significantly different from B but not significantly different from C, D, E, F, and G. The resilience value that increases with the addition of SPI may be due to the nature of the protein, which can increase the binding power of water and fat, as well as the strength of the material.
Melting behavior
DSC analyzes the melting behavior of white chocolate, and the thermograms for different chocolate formulas are shown in . In the thermogram, the melting behavior can be determined, which consists of Tonset, Tpeak, Tend, and the thermal energy of the material. Based on
Figure 2. DSC thermograms of white chocolate in different formulations. A (skim milk 27%, full-cream milk 10%), B (SPI 37%), C (SPI 27%, CF 10%), D (CF 37%), E (SPI 37%, ECE 2%), F (SPI 27%, CF 10%, ECE 2%), G (CF 37%, ECE 2%), SPI (Soy Protein Isolate), CF (Coconut Flour), ECE (Encapsulated Cinnamon Extract).
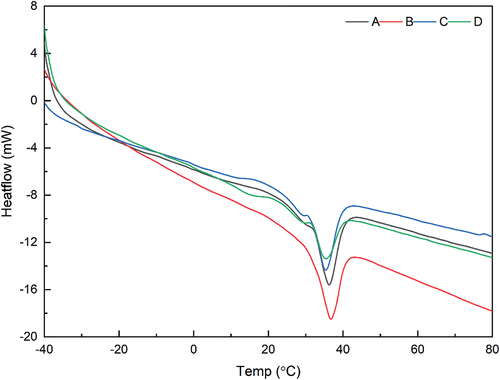
Table 6. Melting behavior values of white chocolate in different formulations.
Low-fat white chocolate (B) melts at a higher temperature and takes longer than high-fat (D). Meanwhile, fat content is the main factor affecting the melting point.[Citation88] Chocolate with a high fat content melts quickly because there are fewer interactions between the particles. The fat fills the voids between the particles and improves the flow properties of the particles, reducing the amount of energy (∆Hmelt) required to melt the chocolate. Furthermore, white chocolate with a small particle size (B) melts at higher temperatures than a larger particle size (D), as shown in . Some studies show the same trend: particle size affects melting point.[Citation89,Citation90] This is because chocolate with a small particle size has a compact texture, has strong interactions between particles, and therefore takes longer to melt.
Color characteristics
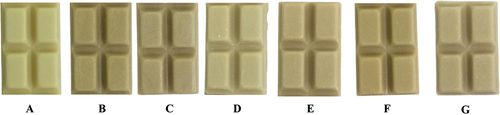
The first impression of a food product is in its visual appearance, as shown in . Additionally, the consumer acceptance of a product largely depends on color. In , vegan white chocolate (B, C, and D) is darker than non-vegan (A). The darkness of the color increased with encapsulated cinnamon extract (ECE) (E, F, and G).
Figure 3. The visual appearance of white chocolate in different formulations. A (skim milk 27%, full-cream milk 10%), B (SPI 37%), C (SPI 27%, CF 10%), D (CF 37%), E (SPI 37%, ECE 2%), F (SPI 27%, CF 10%, ECE 2%), G (CF 37%, ECE 2%), SPI (Soy Protein Isolate), CF (Coconut Flour), ECE (Encapsulated Cinnamon Extract).
The color measurement of white chocolate uses a chromameter tool with the CIELAB system, whose results are expressed in three notations, namely L* (lightness), a* (redness), and b* (yellowness). Each notation has a scale interval to show the color level of the measured object. The L* notation has a value range of 0 to 100 (dark to light), with a* and b* between − 80 to 100 (green to red) and − 70 to 70 (blue to yellow), respectively. The color measurement of white chocolate is shown in .
Table 7. Color analysis values of white chocolate in different formulations.
Based on , the formulation of white chocolate with SPI, CF, and ECE significantly affects the color characteristics (p-value <.05). According to Tukey’s test results, the L* value of sample A was significantly different from B, C, D, E, F, and G. Samples B and F were not significantly different, a trend also similar to D and G. The L* value of white chocolate produced ranged from 66.09 to 78.88.
shows that the L* value of sample A is the highest compared to the others. Using SPI, CF, and ECE decreased the L* value of the white chocolate. Furthermore, the color of SPI and CF was darker than milk, with an L* value of 88.6.[Citation91] SPI also had a yellowish-beige color with a lower L* value than milk, which was 62.6–63.8.[Citation92] Meanwhile, CF had a white color with an L* value lower than milk, which was 63.82–83.77.[Citation93] According to Praseptiangga et al.,[Citation10] the cinnamon extract had a brownish color, increasing the darkness of the white chocolate. The highest L* value of 78.88 was obtained from sample A, where non-vegan white chocolate was brighter than others. This was not different from the color of white chocolate in Lončarević et al.,[Citation32] which had an L* value of 74.6.
a* value of sample A significantly differed from B, C, D, E, F, and G. However, the a* values of samples B and G were not significantly different. The use of SPI, CF, and the addition of ECE increased a* value since samples B, C, D, E, F, and G had a higher reddish color than A. The negative a* value − 1.82 in sample A showed that the color of non-vegan white chocolate was green. This result was consistent with the study of Lončarević et al.,[Citation32] which reported a negative a* value of − 1.00. Sample E at 3.77 obtained the highest a* value, showing redness color.
b* value of sample A significantly differed from B, C, D, E, F, and G. However, samples D and G were not significantly different, and a similar trend was reported in F, B, and C. The use of SPI, CF, and the addition of ECE increased the b* value of white chocolate. Sample A had the lowest b* value, 21.43, compared to the others, and this result was not significantly different from 20.31 in the study of Lončarević et al.[Citation32] due to the type of raw materials. The highest b* value was obtained by sample E (28.67), showing the yellowness color.
Color difference between vegan and non-vegan white chocolate is expressed in the ∆E value. Sample B’s E value significantly differed from C, D, E, F, and G. However, C and F were not significantly different, a trend observed in D and G. Each vegan white chocolate sample had an ∆E value > 3. Sample E had the highest and lowest ∆E values at 15.76 and 5.14, respectively. According to Zyzelewicz et al.,[Citation94] the color difference was visible to the human eye when the obtained ∆E value was greater than 3.
The whiteness index (WI) showed the degree of whiteness of an object and mathematically combined lightness (L*), yellow (a*), and blue (b*) into a term.[Citation91] The WI value of sample A was significantly different from B, C, D, E, F, and G but similar to D and G. According to the L* value, samples A and E had the highest and lowest WI values of 69.86 and 55.42, respectively. This was consistent with Muhammad et al.,[Citation33] who stated that the addition of ECE increased the darkness of the color.
Organoleptic characteristics
Color characteristics: Consumers’ first impression of food products is based on color. Even though a product is considered nutritious, tasty, and has an excellent texture, the color must be attractive.[Citation95] Based on , the color of vegan white chocolate without (B, C, D) and with the addition of ECE (E, F, G) is significantly different (p-value >.05) from non-vegan (A). The average value of the color parameter ranged between 2.27 and 4.73, leading to varying degrees of preference among the panelists, ranging from dislike to like.
Figure 4. A spiderweb graph of sensory attributes of white chocolate in different formulations. A (skim milk 27%, full-cream milk 10%), B (SPI 37%), C (SPI 27%, CF 10%), D (CF 37%), E (SPI 37%, ECE 2%), F (SPI 27%, CF 10%, ECE 2%), G (CF 37%, ECE 2%), SPI (Soy Protein Isolate), CF (Coconut Flour), ECE (Encapsulated Cinnamon Extract).
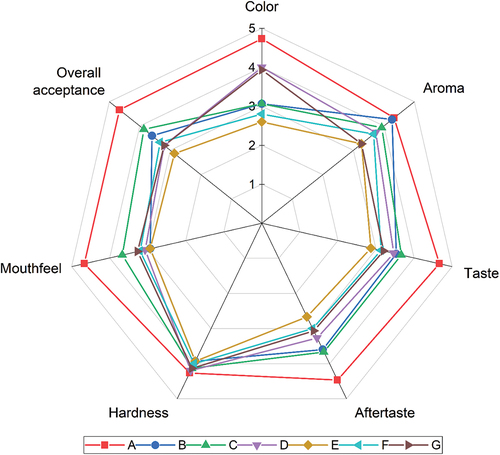
According to the organoleptic test results, the darker the color of the white chocolate, the lower the level of preference of the panelists. The lowest color score was obtained by treatment E, which was 37% SPI, and 2% ECE was added. This result was consistent with the color test, where Treatment E had the lowest whiteness index value compared to others. In line with Praseptiangga et al.,[Citation10] adding cinnamon microcapsules with a white-brown color affected the color of the final chocolate product. Selamat et al.[Citation23] showed that high amounts of SPI could also reduce the brightness of chocolate. Each ingredient of the chocolate composition interacted to produce a specific color in the final product.
Aroma: Aroma is a property of food ingredients related to the sense of smell and is a determining factor of product delicacy.[Citation95] The organoleptic test results show that the aroma of vegan white chocolate B, C, D, and F have no significant difference (p-value >.05). In contrast, samples E and G significantly differ (p-value <.05) with non-vegan white chocolate. The mean value of the parameter ranged from 3.27 to 4.33, leading to varying degrees of preference among the panelists, ranging from normal to like.
Flavor is determined by the ingredients and proportions used to make white chocolate. Besides cocoa butter, the flavor of white chocolate is obtained from milk (A), SPI (B, C, E, F), and CF (C, F, D, G). Cocoa butter is made by processing roasted cocoa beans, containing volatile compounds such as pyrazine, which contributes to the characteristic flavor.[Citation96] The Maillard reaction forms Pyrazine while cocoa beans are being roasted. In sample A, milk provided a creamy/milky flavor that the panelists liked.
SPI is odorless and tasteless due to the absence of carbohydrates.[Citation97] Hence, the flavor of cocoa butter may be more dominant in sample B. Furthermore, adding ECE to white chocolate (E) can affect the flavor. Cinnamon has a distinctive aroma from essential oils whose main components are cinnamaldehyde, eugenol, acetyl eugenol, and other aldehyde compounds. The distinctive aroma may mask the white chocolate.[Citation95] Similarly, CF is known to have a distinctive aroma derived from the fat content. In some foods, CF also affects the flavor and may be preferred by panelists.[Citation98] The percentage used in Sample D is higher than in C since the flavor of the white chocolate may be affected.
Taste: Taste parameters determine the essential sensory quality evaluated by the gustatory sense, which receives stimuli from the combination of ingredients and composition of foods.[Citation95] Based on the organoleptic evaluation of vegan white chocolate without (B, C, D) and with added ECE (E, F, G), a significant difference with non-vegan (A) has been reported. The average value of the taste parameter ranged from 2.60 to 4.67, and the panelists experienced a dislike to like. The vegan white chocolate formula preferred was D, while the formula liked by those with added ECE was F. According to Praseptiangga et al.,[Citation95] the additional ingredients contribute to a more specific flavor of the final product, which largely depends on milk fat. Therefore, milk substitutes can change the flavor of white chocolate, and CF enriches the product’s taste due to its high-fat content. In this context, panelists liked the taste of white chocolate sample D, and the taste parameter values of B, C, and D were not significantly different from E, F, and G. The strong taste of cinnamon could be masked by microencapsulation while reducing negative perceptions. Cinnamaldehyde is responsible for the strong, spicy, and slightly sweet taste.[Citation95]
Aftertaste: The aftertaste is the taste impression that remains in the mouth after eating. The less taste left behind, the better the aftertaste of a product. Based on , the parameters for vegan white chocolate without (B, C, D) and with added ECE (E, F, G) significantly differ from non-vegan white chocolate. The mean value ranged from 2.53 to 4.47, leading to varying degrees of preference among the panelists, ranging from dislike to like.
The additional ingredients contributed to a more specific aftertaste of the final product. SPI tastes bland, while milk in non-vegan white chocolate and CF taste creamy and savory, respectively. It makes the aftertaste different from non-vegan white chocolate. Cinnamon has a spicy, sweet, and warm aftertaste that, if too strong, can mask the distinctive taste of chocolate.
Texture: Texture is the sensation of pressure observed in the mouth when bitten, chewed, swallowed, or by touching fingers. Hardness, mouthfeel, and grittiness are the texture parameters of white chocolate in the organoleptic test. This parameter is the force required to bite into the chocolate, and the descriptions range from very soft to extremely hard. Based on , the hardness of vegan white chocolate showed no significant difference (p-value >.05) from non-vegan chocolate. The mean value of the parameter ranged from 3.97 to 4.27, leading to varying degrees of being liked by the panelists.
The following texture parameter was the mouthfeel, a term used to describe the smoothness or consistency of chocolate when chewed in the mouth, as perceived by the tongue and palate. The commonly used description ranges from very soft to rough in this context. Based on , the parameters of vegan white chocolate without (B, C, and D) and with ECE (E, F, and G) were significantly different (p-value <.05) from non-vegan (A). However, the mouthfeel values of samples B, C, and D were not significantly different from E, F, and G. The mean parameter values ranged from 2.93 to 4.67, leading to varying degrees of being disliked by the panelists.
The particle size distribution and the fat content of the chocolate influence mouthfeel. The larger the particles of the chocolate, the coarser the mouthfeel parameter. In contrast, the smaller the particles and the higher the fat content, the softer the mouthfeel. In line with the particle size distribution test results, vegan white chocolate has a particle size different from non-vegan chocolate. Therefore, the mouthfeel produced is different, and the parameters can also be affected by the chocolate manufacturing processes, such as mixing and conching.
Overall acceptance: The overall acceptance shows the panelists’ preference for each hedonic test. Based on , vegan white chocolate without (B, C, D) and with (E, F, G) ECE has a significant difference (p-value <.05) compared to non-vegan (A). The mean value of the parameters ranged from 4.67 to 2.60, leading to varying degrees of preference among the panelists, ranging from like to dislike. The vegan white chocolate formulation with the highest overall acceptance was sample C (3.67), followed by B (3.47) and D (2.33). For those with ECE, the most favorable overall panelist acceptance was sample F (3.13), followed by E (3.07) and G (2.47).
In this study, it was found that the formula modification resulted in lower consumer acceptance. Nevertheless, several strategies can be conducted to enhance vegan white chocolate’s organoleptic properties and overall acceptability. First, the effect of formula modification on the consumer acceptance of chocolate was ingredient type-dependent. Thus, it strongly indicates the importance of ingredient selection in making vegan chocolate. Changing the composition of vegan chocolate may significantly overcome this problem.[Citation30] Second, information intervention may also increase the overall acceptability of chocolate. This can be done by highlighting the potential health benefits of vegan chocolate enriched with encapsulated cinnamon extract compared to conventional white chocolate. However, to prove this hypothesis, further research indeed is required.[Citation99]
Correlation between the parameters
Correlation analysis aims to determine the amount that shows the strength of the relationship between variables. This study uses the Pearson correlation method to determine the relationship between antioxidant, phenolic, and flavonoid parameters. The correlation coefficient (p) shows the strength of the linear relationship between two variables, and a value close to −1 or 1 represents a better result. According to Schober and Schwarte,[Citation100] coefficient values of 0.00–0.10, 0.10–0.39, 0.40–0.69, 0.70–0.89, and 0.90–1.00 show very weak, weak, moderate, strong, and very strong correlation, respectively.
Based on the results in , the variables of total phenolics and flavonoids have a significance value of p-value <.05, showing a strong positive correlation between the parameters. There is a positive correlation between the parameters from cinnamon since most phenolic compounds are flavonoid groups.
Figure 5. Heatmap of Pearson’s correlation coefficient (r) for various variables. TP (Total Phenolic), TF (Total Flavonoid), IC₅₀ (Antioxidant Activity), Pro (Protein), Fat, H (Hardness), L* (Lightness), a* (Redness), b* (Yellowness), WI (Whiteness Index).
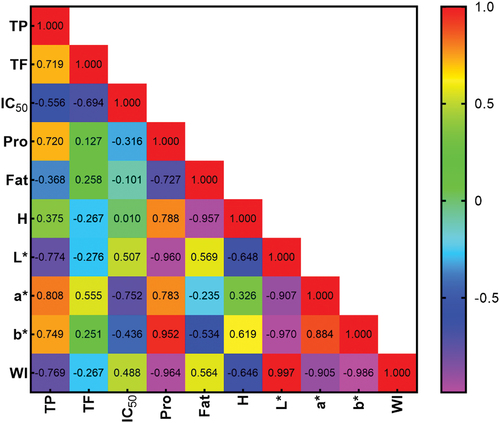
The Pearson correlation test of the total phenolics with the IC₅₀ has a p-value <.05 with the variable IC₅₀. The correlation coefficient (r) showed a moderately negative result due to the binding between proteins and phenolic compounds in white chocolate, which affects the total assay. The mechanism for forming protein-phenolic bonds is highly dependent on the structural details of the phenolic compounds.[Citation101] Protein interactions with phenolic and flavonoid compounds may mask the antioxidant capacity. This negative correlation is caused by the value of antioxidant activity expressed in concentration to stabilize 50% DPPH free radicals.
Total phenolics with color (L*, a*, b) showed a strong correlation between the two variables. This result was consistent with the color test, where ECE and increasing total phenolics also increased redness and yellowness (a* and b*). In contrast, the increase in the parameters caused a decrease in the lightness and whiteness indexes (L* and WI). Cinnamon is known to have carotenoid and tannin pigments, which are responsible for the orange to red-brown colors.[Citation102]
Conclusion
To sum up, the formulation of vegan white chocolate using SPI, CF, and ECE was successfully done in this study. SPI, CF, and ECE significantly improve white chocolate’s total phenolics, flavonoids, and antioxidant activity. Nevertheless, the incorporation of SPI, CF, and ECE changed consumer acceptance and the physical properties of white chocolate, particularly in terms of hardness and color. As such, a decrease in L* and whiteness index was observed. The use of SPI increased protein content and melting points, while the use of CF increased the fat content and decreased the melting point of the chocolate. The formulated vegan chocolate had a lower consumer acceptance than white chocolate. However, the chocolate formulated with 27% SPI, 10% CF, and 2% encapsulated cinnamon extract is acceptable to the panelists. This product may be potentially consumed as a high-protein and antioxidant-rich food for targeted markets, namely lactose-intolerant and vegan consumers.
Acknowledgments
The authors are grateful to the Directorate General of Higher Education, Research, and Technology, the Ministry of Education, Culture, Research, and Technology, the Republic of Indonesia, and Universitas Padjadjaran for supporting this study.
Disclosure statement
No potential conflict of interest was reported by the author(s).
Correction Statement
This article has been republished with minor changes. These changes do not impact the academic content of the article.
Additional information
Funding
References
- Goya, L.; Kongor, J. E.; de Pascual-Teresa, S. From Cocoa to Chocolate: Effect of Processing on Flavanols and Methylxanthines and Their Mechanisms of Action. Int. J. Mol. Sci. 2022, 23(22), 14365. DOI: 10.3390/ijms232214365.
- Ostrowska-Ligęza, E.; Górska, A.; Wirkowska-Wojdyła, M.; Bryś, J.; Dolatowska-Żebrowska, K.; Shamilowa, M.; Ratusz, K. Thermogravimetric Characterization of Dark and Milk Chocolates at Different Processing Stages. J. Therm. Anal. Calorim. 2018, 134(1), 623–631. DOI: 10.1007/s10973-018-7091-4.
- Barisic, V.; Kopjar, M.; Jozinovic, A.; Flanjak, I.; Flanjak, I.; Miličević, B.; Šubarić, D.; Jokić, S.; Babić, J. The Chemistry Behind Chocolate Production. Molecules 2019, 24(17), 3163. DOI:10.3390/molecules24173163.
- Ditchfield, C.; Kushida, M. M.; Mazalli, M. R.; Sobral, P. J. A. Can Chocolate Be Classified As an Ultra-Processed Food? A Short Review on Processing and Health Aspects to Help Answer This Question. Foods 2023, 12(16), 3070. DOI: 10.3390/foods12163070.
- Indiarto, R.; Subroto, E.; Sukri, N.; Djali, M. Cocoa (Theobroma Cacao L.) Beans Processing Technology: A Review of Flavonoid Changes. Asian J. Plant Sci. 2021, 20(4), 684–693. DOI: 10.3923/ajps.2021.684.693.
- Indiarto, R.; Pranoto, Y.; Santoso, U.; Supriyanto, S. In vitro Antioxidant Activity and Profile of Polyphenol Compounds Extracts and Their Fractions on Cacao Beans. Pakistan J. Biol. Sci. 2019, 22(1), 34–44. DOI: 10.3923/pjbs.2019.34.44.
- Indiarto, R.; Pranoto, Y.; Santoso, U.; Supriyanto, S. Evaluation of Physicochemical Properties and Antioxidant Activity of Polyphenol-Rich Cacao Bean Extract Through Water Blanching. Pakistan J. Nutr. 2019, 18(3), 278–287. DOI: 10.3923/pjn.2019.278.287.
- Bordiga, M.; Locatelli, M.; Travaglia, F.; Coïsson, J. D.; Mazza, G.; Arlorio, M. Evaluation of the Effect of Processing on Cocoa Polyphenols: Antiradical Activity, Anthocyanins and Procyanidins Profiling from Raw Beans to Chocolate. Int. J. Food Sci. Technol. 2015, 50(3), 840–848. DOI: 10.1111/ijfs.12760.
- Martin, M. A.; Goya, L.; Ramos, S. Potential for Preventive Effects of Cocoa and Cocoa Polyphenols in Cancer. Food. Chem. Toxicol. 2013, 56, 336–351. DOI: 10.1016/j.fct.2013.02.020.
- Praseptiangga, D.; Invicta, S. E.; Khasanah, L. U. Sensory and Physicochemical Characteristics of Dark Chocolate Bar with Addition of Cinnamon (Cinnamomum Burmannii) Bark Oleoresin Microcapsule. J. Food Sci. Technol. 2019, 56(9), 4323–4332. DOI: 10.1007/s13197-019-03901-8.
- Muhammad, D. R. A.; Tuenter, E.; Patria, G. D.; Foubert, K.; Pieters, L.; Dewettinck, K. Phytochemical Composition and Antioxidant Activity of Cinnamomum Burmannii Blume Extracts and Their Potential Application in White Chocolate. Food Chem. 2021, 340, 127983. DOI: 10.1016/j.foodchem.2020.127983.
- Zhao, B.; Deng, J.; Li, H.; He, Y.; Lan, T.; Wu, D.; Gong, H.; Zhang, Y.; Chen, Z. Optimization of Phenolic Compound Extraction from Chinese Moringa Oleifera Leaves and Antioxidant Activities. J. Food Qual. 2019, 2019, 1–13. DOI: 10.1155/2019/5346279.
- Indiarto, R.; Indriana, L. P. A.; Andoyo, R.; Subroto, E.; Nurhadi, B. Bottom–Up Nanoparticle Synthesis: A Review of Techniques, Polyphenol-Based Core Materials, and Their Properties. Eur. Food Res. Technol. 2022, 248(1), 1–24. DOI: 10.1007/s00217-021-03867-y.
- de Souza, V. B.; Thomazini, M.; Echalar Barrientos, M. A.; Nalin, C. M.; Ferro-Furtado, R.; Genovese, M. I.; Favaro-Trindade, C. S. Functional Properties and Encapsulation of a Proanthocyanidin-Rich Cinnamon Extract (Cinnamomum Zeylanicum) by Complex Coacervation Using Gelatin and Different Polysaccharides. Food Hydrocoll. 2018, 77, 297–306. DOI: 10.1016/j.foodhyd.2017.09.040.
- Xiao, Z.; Xia, J.; Zhao, Q.; Niu, Y.; Zhao, D. Maltodextrin as Wall Material for Microcapsules: A Review. Carbohydr. Polym. 2022, 298, 120113. DOI: 10.1016/j.carbpol.2022.120113.
- Szilagyi, A.; Ishayek, N. Lactose Intolerance, Dairy Avoidance, and Treatment Options. Nutrients 2018, 10(12), 12. DOI: 10.3390/nu10121994.
- Selvasekaran, P.; Chidambaram, R. Advances in Formulation for the Production of Low-Fat, Fat-Free, Low-Sugar, and Sugar-Free Chocolates: An Overview of the Past Decade. Trends Food Sci. Technol. 2021, 113(May), 315–334. DOI: 10.1016/j.tifs.2021.05.008.
- Glicerina, V.; Balestra, F.; Dalla Rosa, M.; Romani, S. Microstructural and Rheological Characteristics of Dark, Milk and White Chocolate: A Comparative Study. J. Food Eng. 2016, 169, 165–171. DOI: 10.1016/j.jfoodeng.2015.08.011.
- Ostrowska-Ligęza, E.; Marzec, A.; Górska, A.; Wirkowska-Wojdyła, M.; Bryś, J.; Rejch, A.; Czarkowska, K. A Comparative Study of Thermal and Textural Properties of Milk, White and Dark Chocolates. Thermochim. Acta. 2019, 671(November 2018), 60–69. DOI: 10.1016/j.tca.2018.11.005.
- Akharume, F. U.; Aluko, R. E.; Adedeji, A. A. Modification of Plant Proteins for Improved Functionality: A Review. Compr. Rev. Food Sci. Food Saf. 2021, 20(1), 198–224. DOI: 10.1111/1541-4337.12688.
- Qin, P.; Wang, T.; Luo, Y. A Review on Plant-Based Proteins from Soybean: Health Benefits and Soy Product Development. J. Agric. Food Res. 2022, 7, 100265. DOI: 10.1016/j.jafr.2021.100265.
- Paulsen, P. V. Isolated Soy Protein Usage in Beverages; Woodhead Publishing Limited, 2009. DOI: 10.1533/9781845695569.3.318.
- Selamat, J.; Hussin, N.; Mohd Zain, A.; Che Man, Y. B. Effects of Soy Protein Isolates on Quality of Chocolates During Storage. J. Food Process Preserv. 1998, 22(3), 185–197. DOI: 10.1111/j.1745-4549.1998.tb00344.x.
- Raghani, R.; Rana, K.; Student, M. S. Development of Chocolate Using Nanosized Soy Protein Isolate, Jaggery and Casein Protein. Int. J. Trend Res. Dev. 2013, 9(2), 32–35.
- Hopkin, L.; Broadbent, H.; Ahlborn, G. J. Influence of Almond and Coconut Flours on Ketogenic, Gluten-Free Cupcakes. Food Chem. X. 2022, 13, 100182. DOI: 10.1016/j.fochx.2021.100182.
- Yeganehzad, S.; Mazaheri-Tehrani, M.; Mohebbi, M.; Habibi Najafi, M. B.; Baratian, Z. Effects of Replacing Skim Milk Powder with Soy Flour and Ball Mill Refining Time on Particle Size and Rheological Properties of Compound Chocolate. J. Agric. Sci. Technol 2012, 15(1), 125–135. DOI: 10.13140/RG.2.1.4970.9288.
- Torregrossa, F.; Cinquanta, L.; Albanese, D.; Cuomo, F.; Librici, C.; Lo Meo, P.; Conte, P. Vegan and Sugar-Substituted Chocolates: Assessing Physicochemical Characteristics by NMR Relaxometry, Rheology, and DSC. Eur. Food Res. Technol. 2024, 250(4), 1219–1228. DOI: 10.1007/s00217-023-04457-w.
- Dumbrava, D.; Popescu, L. A.; Soica, C. M.; Nicolin, A.; Cocan, I.; Negrea, M.; Alexa, E.; Obistioiu, D.; Radulov, I.; Popescu, S., et al. Nutritional, Antioxidant, Antimicrobial, and Toxicological Profile of Two Innovative Types of Vegan, Sugar-Free Chocolate. Foods 2020, 9(12), 1844. DOI: 10.3390/foods9121844.
- Muhammad, D. R. A.; Zulfa, F.; Purnomo, D.; Widiatmoko, C.; Fibri, D. L. N. Consumer Acceptance of Chocolate Formulated with Functional Ingredient. IOP Conf. Ser. Earth Environ. Sci. 2021, 637(1), 012081. DOI: 10.1088/1755-1315/637/1/012081.
- Muhammad, D. R. A.; Zulfa, F.; Purnomo, D.; Widiatmoko, C.; Fibri, D. L. N. Antioxidant Activities and Physical Properties of Milk Chocolate Enriched with Plant-Based Functional Ingredients. Food Res. 2023, 7(Supplementary 1), 268–275. DOI: 10.26656/fr.2017.7(S1).6.
- Muhammad, D. R. A.; Fibri, D. L. N.; Prakash, S. Improving the Functionality of Chocolate by Incorporating Vegetal Extracts. In Trends in Sustainable Chocolate Production; Springer International Publishing: Cham, 2022, 113–152. DOI: 10.1007/978-3-030-90169-1_4.
- Lončarević, I.; Pajin, B.; Fišteš, A.; Tumbas Šaponjac, V.; Petrović, J.; Jovanović, P.; Vulić, J.; Zarić, D. Enrichment of White Chocolate with Blackberry Juice Encapsulate: Impact on Physical Properties, Sensory Characteristics and Polyphenol Content. LWT. 2018, 92, 458–464. DOI: 10.1016/j.lwt.2018.03.002.
- Muhammad, D. R. A.; Saputro, A. D.; Rottiers, H.; Van de Walle, D.; Dewettinck, K. Physicochemical Properties and Antioxidant Activities of Chocolates Enriched with Engineered Cinnamon Nanoparticles. Eur. Food Res. Technol. 2018, 244(7), 1185–1202. DOI: 10.1007/s00217-018-3035-2.
- Todorović, A.; Šturm, L.; Salević-Jelić, A.; Lević, S.; Osojnik Črnivec, I. G.; Prislan, I.; Skrt, M.; Bjeković, A.; Poklar Ulrih, N.; Nedović, V. Encapsulation of Bilberry Extract with Maltodextrin and Gum Arabic by Freeze-Drying: Formulation, Characterisation, and Storage Stability. Processes 2022, 10(10), 1991. DOI: 10.3390/pr10101991.
- Ioannone, F.; Di Mattia, C. D.; De Gregorio, M.; Sergi, M.; Serafini, M.; Sacchetti, G. F. Flavanols, Proanthocyanidins and Antioxidant Activity Changes During Cocoa (Theobroma Cacao L.) Roasting as Affected by Temperature and Time of Processing. Food Chem. 2015, 174, 256–262. DOI: 10.1016/j.foodchem.2014.11.019.
- Indiarto, R.; Rahimah, S.; Subroto, E.; Putri, N. A. G.; Pangawikan, A. D. Antioxidant Activity and Characteristics of a Cocoa Drink Formulated with Encapsulated Green Coffee Extract. Int. J. Food. Prop. 2022, 25(1), 2477–2494. DOI: 10.1080/10942912.2022.2144883.
- Indiarto, R.; Reni, R.; Utama, G. L.; Subroto, E.; Pangawikan, A. D.; Djali, M. The Physicochemical, Antioxidant, and Sensory Properties of Chocolate Biscuits Incorporated with Encapsulated Mangosteen (Garcinia Mangostana L.) Peel Extract. Int. J. Food. Prop. 2023, 26(1), 122–138. DOI: 10.1080/10942912.2022.2159429.
- Indiarto, R.; Herwanto, J. A.; Filianty, F.; Lembong, E.; Subroto, E.; Muhammad, D. R. A. Total Phenolic and Flavonoid Content, Antioxidant Activity and Characteristics of a Chocolate Beverage Incorporated with Encapsulated Clove Bud Extract. CyTA - J. Food 2024, 22(1). DOI: 10.1080/19476337.2024.2329144.
- Aria, P. S. Other Constituents. In Official Methods of Analysis of AOAC INTERNATIONAL; Oxford University Press, 2023. DOI: 10.1093/9780197610145.003.199.
- Aria, P. S. Fat In Official Methods of Analysis of AOAC INTERNATIONAL; Oxford University Press, 2023. DOI: 10.1093/9780197610145.003.198.
- Feichtinger, A.; Scholten, E.; Sala, G. Effect of Particle Size Distribution on Rheological Properties of Chocolate. Food Funct. 2020, 11(11), 9547–9559. DOI: 10.1039/d0fo01655a.
- Afoakwa, E. O.; Paterson, A.; Fowler, M.; Vieira, J. Particle Size Distribution and Compositional Effects on Textural Properties and Appearance of Dark Chocolates. J. Food Eng. 2008, 87(2), 181–190. DOI: 10.1016/j.jfoodeng.2007.11.025.
- Subroto, E.; Indiarto, R.; Pangawikan, A. D.; Lembong, E.; Wulandari, E.; Selica, A.; Hartomo, J. I. Melting Behaviour of Cocoa Butter Substitutes Synthesised by Enzymatic Glycerolysis of Coconut Oil and Palm Stearin Blends. Food Res. 2023, 7(3), 194–202. DOI: 10.26656/fr.2017.7(3).872.
- Muhammad, D. R. A.; Lemarcq, V.; Alderweireldt, E.; Vanoverberghe, P.; Praseptiangga, D.; Juvinal, J. G.; Dewettinck, K. Antioxidant Activity and Quality Attributes of White Chocolate Incorporated with Cinnamomum Burmannii Blume Essential Oil. J. Food Sci. Technol. 2020, 57(5), 1731–1739. DOI: 10.1007/s13197-019-04206-6.
- Santiago-Adame, R.; Medina-Torres, L.; Gallegos-Infante, J. A.; Calderas, F.; González-Laredo, R. F.; Rocha-Guzmán, N. E.; Ochoa-Martínez, L. A.; Bernad-Bernad, M. J. Spray Drying-Microencapsulation of Cinnamon Infusions (Cinnamomum Zeylanicum) with Maltodextrin. LWT - Food Sci. Technol. 2015, 64(2), 571–577. DOI: 10.1016/j.lwt.2015.06.020.
- Duval, J.; Pecher, V.; Poujol, M.; Lesellier, E. Research Advances for the Extraction, Analysis and Uses of Anthraquinones: A Review. Ind. Crops Prod. 2016, 94, 812–833. DOI: 10.1016/j.indcrop.2016.09.056.
- Król-Grzymała, A.; Amarowicz, R. Phenolic Compounds of Soybean Seeds from Two European Countries and Their Antioxidant Properties. Molecules. 2020, 25(9), 1–11. DOI: 10.3390/molecules25092075.
- Mahayothee, B.; Koomyart, I.; Khuwijitjaru, P.; Siriwongwilaichat, P.; Nagle, M.; Müller, J. Phenolic Compounds, Antioxidant Activity, and Medium Chain Fatty Acids Profiles of Coconut Water and Meat at Different Maturity Stages. Int. J. Food. Prop. 2016, 19(9), 2041–2051. DOI: 10.1080/10942912.2015.1099042.
- Smith, L. F.; Patterson, J.; Walker, L. T.; Verghese, M. Antioxidant Potential of Coconut Flour in Caco-2 Colon Cancer Cells. Int. J. Cancer Res 2016, 12(1), 29–39. DOI: 10.3923/ijcr.2016.29.39.
- Park, H.; Lee, M.; Kim, K. T.; Park, E.; Paik, H. D. Antioxidant and Antigenotoxic Effect of Dairy Products Supplemented with Red Ginseng Extract. J. Dairy. Sci. 2018, 101(10), 8702–8710. DOI: 10.3168/jds.2018-14690.
- Ertan, K.; Bayana, D.; Gökçe, Ö.; Alatossava, T.; Yılmaz, Y.; Gürsoy, O. Total Antioxidant Capacity and Phenolic Content of Pasteurized and UHT- Treated Cow Milk Samples Marketed in Turkey. Akad. Gıda 2017, 15(2), 103–108. DOI: 10.24323/akademik-gida.333630.
- Lončarević, I.; Pajin, B.; Tumbas Šaponjac, V.; Petrović, J.; Vulić, J.; Fišteš, A.; Jovanović, P. P. Physical, Sensorial and Bioactive Characteristics of White Chocolate with Encapsulated Green Tea Extract. J. Sci. Food Agric. 2019, 99(13), 5834–5841. DOI: 10.1002/jsfa.9855.
- Barišić, V.; Stokanović, M. C.; Flanjak, I.; Doko, K.; Jozinović, A.; Babić, J.; Šubarić, D.; Miličević, B.; Cindrić, I.; Ačkar, Đ. Cocoa Shell as a Step Forward to Functional Chocolates—Bioactive Components in Chocolates with Different Composition. Molecules. 2020, 25(22), 1–12. DOI: 10.3390/MOLECULES25225470.
- Gulcin, I.; Kaya, R.; Goren, A. C.; Akincioglu, H.; Topal, M.; Bingol, Z.; Cetin Çakmak, K.; Ozturk Sarikaya, S. B.; Durmaz, L.; Alwasel, S. A. Antidiabetic and Antioxidant Activities of Cinnamon (Cinnamomum Verum) Bark Extracts: Polyphenol Contents Analysis by LC-MS/MS. Int. J. Food. Prop. 2019, 22(1), 1511–1526. DOI: 10.1080/10942912.2019.1656232.
- Bolanho, B. C.; Beleia, A. D. P. Bioactive Compounds and Antioxidant Potential of Soy Products. Alim. Nutr. Araraquara 2011, 22(4), 539–546. DOI: out./dez2011.
- Arivalagan, M.; Roy, T. K.; Yasmeen, A. M.; Pavithra, K. C.; Jwala, P. N.; Shivasankara, K. S.; Manikantan, M. R.; Hebbar, K. B.; Kanade, S. R. Extraction of Phenolic Compounds with Antioxidant Potential from Coconut (Cocos Nucifera L.) Testa and Identification of Phenolic Acids and Flavonoids Using UPLC Coupled with TQD-MS/MS; Elsevier Ltd, LWT 2018, 92, 116–126. DOI: 10.1016/j.lwt.2018.02.024.
- Cheng, C. M.; Jalil, A. M. M.; Ismail, A. Phenolic and Theobromine Contents of Commercial Dark, Milk and White Chocolates on the Malaysian Market. Molecules 2009, 14(1), 200–209. DOI: 10.3390/molecules14010200.
- Besle, J. M.; Viala, D.; Martin, B.; Pradel, P.; Meunier, B.; Berdagué, J. L.; Fraisse, D.; Lamaison, J. L.; Coulon, J. B. Ultraviolet-Absorbing Compounds in Milk Are Related to Forage Polyphenols. J. Dairy. Sci. 2010, 93(7), 2846–2856. DOI: 10.3168/jds.2009-2939.
- Ervina, M.; Nawu, Y. E.; Esar, S. Y. Comparison of in vitro Antioxidant Activity of Infusion, Extract and Fractions of Indonesian Cinnamon (Cinnamomum Burmannii) Bark. Int. Food Res. J. 2016, 23(3), 1346–1350.
- Simbine, E. O.; Rodrigues, L. D. C.; Burbarelli, M. F. D. C.; Fávaro-Trindade, C. S.; Viegas, E. M. M.; Enke, D. B. S.; Lapa-Guimarães, J. Cinnamomum Zeylanicum Extracts Reduce Lipid Oxidation in Broadband Anchovy (Anchoviella Lepidentostole) Minced Fish. Food Sci. Technol. 2022, 42, 1–10. DOI: 10.1590/fst.46420.
- Indiarto, R.; Irawan, A. N.; Subroto, E. Meat Irradiation: A Comprehensive Review of Its Impact on Food Quality and Safety. Foods 2023, 12(9), 1845. DOI: 10.3390/foods12091845.
- Nguyen, Q. D.; Dang, T. T.; Nguyen, T. V. L.; Nguyen, T. T. D.; Nguyen, N. N. Microencapsulation of Roselle (Hibiscus Sabdariffa L.) Anthocyanins: Effects of Different Carriers on Selected Physicochemical Properties and Antioxidant Activities of Spray-Dried and Freeze-Dried Powder. Int. J. Food. Prop. 2022, 25(1), 359–374. DOI: 10.1080/10942912.2022.2044846.
- Ayrancı, U. G.; Şeker, A.; Arısoy, S.; Çimen, H.; Üstün-Aytekin, Ö. Antioxidant Activity and Identification of Food Proteins by Digestive Enzyme Supplementation and Fermentation with Lactobacillus Kefiri. Czech J. Food Sci. 2019, 37(3), 155–164. DOI: 10.17221/138/2018-CJFS.
- Bolling, B. W.; Blumberg, J. B.; Chen, C. Y. O. Extraction Methods Determine the Antioxidant Capacity and Induction of Quinone Reductase by Soy Products in vitro. Food Chem. 2009, 116(1), 351–355. DOI: 10.1016/j.foodchem.2009.01.087.
- Vuthijumnonk, J.; Rajchasom, S. Total Dietary Fiber in Coconut Powder Cookies and Their Antioxidant Activity: A Healthy Snack Potentiality. ETP Int. J. Food Eng. 2019, 5(1), 88–91. DOI: 10.18178/ijfe.5.1.88-91.
- Adeloye, J. B.; Osho, H.; Idris, L. O. Defatted Coconut Flour Improved the Bioactive Components, Dietary Fibre, Antioxidant and Sensory Properties of Nixtamalized Maize Flour. J. Agric. Food Res. 2020, 2(February), 100042. DOI: 10.1016/j.jafr.2020.100042.
- Stobiecka, M.; Król, J.; Brodziak, A. Antioxidant Activity of Milk and Dairy Products. Animals 2022, 12(3), 245. DOI: 10.3390/ani12030245.
- Muhammad, D. R. A.; Praseptiangga, D.; Van de Walle, D.; Dewettinck, K. Interaction Between Natural Antioxidants Derived from Cinnamon and Cocoa in Binary and Complex Mixtures. Food Chem. 2017, 231, 356–364. DOI: 10.1016/j.foodchem.2017.03.128.
- Zaker Md, A.; Tr, G. Effects of Defatted Soy Flour Incorporation on Physical, Sensorial and Nutritional Properties of Biscuits. J. Food Process. Technol 2012, 03(04), 04. DOI: 10.4172/2157-7110.1000149.
- Parate Vishal, R.; Sonawane Shriram, S.; Munje Shyam, S. Food Fortification of Soy Protein Isolate for Human Health. Res. J. Chem. Environ. 2018, 22(12), 108–115.
- Huffman, L. M.; de Barros Ferreira, L. Whey - Based Ingredients. In Dairy Ingredients for Food Processing; Chandan, R.C.; Kilara, A.; Eds.; Blackwell Publishing Ltd.: USA, 2011; 179–198. DOI: 10.1002/9780470959169.ch8.
- Lonˇcarevi´c, I.; Pajin, B.; Petrovi´c, J.; Nikoli´c, I.; Maravi´c, N.; Aˇckar, Ð. ¯.; Šubari´c, D.; Zari´c, D.; Miliˇcevi´c, B. White Chocolate with Resistant Starch: Impact on Physical Properties, Dietary Fiber Content and Sensory Characteristics. Molecules 2021, 26(5908), 1–12. DOI: 10.3390/molecules26195908.
- Ramya, H.; Pattan, N. Development and Quality Evaluation of Ready-To-Use Use Coconut Flour. Int. J. Curr. Res. 2019, 11(3), 2512–2514.
- Hossain, S. Incorporation of Coconut Flour in Plain Cake and Investigation of the Effect of Sugar and Baking Powder on Its Baking Quality. Int. J. Nutr. Food Sci. 2016, 5(1), 31. DOI: 10.11648/j.ijnfs.20160501.15.
- Stoin, D. Researches Regarding the Influence of Coconut Flour Addition on the Nutritional Value of Gluten-Free Cookies. J. Agroaliment. Process. Technol 2016, 22(4), 292–300.
- Ergönül, P. G.; Ergönül, B.; Seçkin, A. K. Cholesterol Content and Fatty Acid Profile of Chocolates Mostly Consumed in Turkey Contenido de Colesterol y Perfil de Ácidos Grasos de Los Chocolates Más Consumidos En Turquía. CyTA - J. Food. 2010, 8(1), 73–78. DOI: 10.1080/19476330903205033.
- Liang, B.; Hartel, R. W. Effects of Milk Powders in Milk Chocolate. J. Dairy. Sci. 2004, 87(1), 20–31. DOI: 10.3168/jds.S0022-0302(04)73137-9.
- Rakin, M.; Bulatović, M.; Zarić, D.; Krunić, T.; Lončarević, I.; Petrović, J.; Pajin, B. Influence of Added Whey Proteins and Hydrolysates on Rheological and Textural Characteristics of Milk Chocolate. Food Sci. Technol. Int. 2023, 29(6), 610–618. DOI: 10.1177/10820132221103758.
- Torrecillas, C. M.; Halbert, G. W.; Lamprou, D. A. A Novel Methodology to Study Polymodal Particle Size Distributions Produced During Continuous Wet Granulation. Int. J. Pharm. 2017, 519(1–2), 230–239. DOI: 10.1016/j.ijpharm.2017.01.023.
- Beckett, S. T. Non-Conventional Machines and Processes. 2009. DOI: 10.1002/9781444301588.ch17.
- Małecki, J.; Muszyński, S.; Sołowiej, B. G. Proteins in Food Systems—Bionanomaterials, Conventional and Unconventional Sources, Functional Properties, and Development Opportunities. Polymers 2021, 13(15), 15. DOI: 10.3390/polym13152506.
- Lapčíková, B.; Lapčík, L.; Salek, R.; Valenta, T.; Lorencová, E.; Vašina, M. Physical Characterization of the Milk Chocolate Using Whey Powder. LWT 2022, 154, 154. DOI: 10.1016/j.lwt.2021.112669.
- Wahidin, T.; Danggi, E. Pengaruh Bahan Penyusun Produk Cokelat Batangan Terhadap Waktu Leleh Dan Uji Organoleptik. J. Sains dan Teknol. Pangan 2017, 2(1), 285–297.
- Indiarto, R.; Nurhadi, B.; Dan, E. S. Kajian Karakteristik Tekstur Dan Organoleptik Daging Ayam Asap Berbasis Teknologi Asap Cair Tempurung Kelapa. J. Teknol. Has. Pertan 2012, 5(2), 106–116.
- Majzoobi, M.; Ghiasi, F.; Habibi, M.; Hedayati, S.; Farahnaky, A. Influence of Soy Protein Isolate on the Quality of Batter and Sponge Cake. J. Food Process Preserv. 2014, 38(3), 1164–1170. DOI: 10.1111/jfpp.12076.
- Chandra, M. V.; Shamasundar, B. A. Texture Profile Analysis and Functional Properties of Gelatin from the Skin of Three Species of Fresh Water Fish. Int. J. Food. Prop. 2015, 18(3), 572–584. DOI: 10.1080/10942912.2013.845787.
- Yusof, N.; Jaswir, I.; Jamal, P.; Jami, M. S. Texture Profile Analysis (TPA) of the Jelly Dessert Prepared from Halal Gelatin Extracted Using High Pressure Processing (HPP). Malaysian J. Fundam. Appl. Sci. 2019, 15(4), 604–608. DOI: 10.11113/mjfas.v15n4.1583.
- Goranova, Z.; Alexieva, I.; Petrova, T. Effect of Coconut Products, Mesquite Flour and Stevia on the Thermal and Quality Properties of Dark Chocolate. Ukr. Food J. 2021, 10(4), 774–785. DOI: 10.24263/2304-974x-2021-10-4-11.
- Tan, J.; Kerr, W. L. Determination of Chocolate Melting Properties by Capacitance Based Thermal Analysis (CTA). J. Food Meas. Charact. 2018, 12(1), 641–649. DOI: 10.1007/s11694-017-9677-0.
- Afoakwa, E. O.; Paterson, A.; Fowler, M.; Vieira, J. Influence of Tempering and Fat Crystallization Behaviours on Microstructural and Melting Properties in Dark Chocolate Systems. Food. Res. Int. 2009, 42(1), 200–209. DOI: 10.1016/j.foodres.2008.10.007.
- Milovanovic, B.; Djekic, I.; Miocinovic, J.; Djordjevic, V.; Lorenzo, J. M.; Barba, F. J.; Mörlein, D.; Tomasevic, I. What Is the Color of Milk and Dairy Products and How Is it Measured? Foods. 2020, 9(11), 1–17. DOI: 10.3390/foods9111629.
- O’Flynn, T. D.; Hogan, S. A.; Daly, D. F. M.; O’Mahony, J. A.; McCarthy, N. A. Rheological and Solubility Properties of Soy Protein Isolate. Molecules 2021, 26(10), 3015. DOI: 10.3390/molecules26103015.
- Naik, A.; Venu, G. V.; Prakash, M.; Raghavarao, K. S. M. S. Dehydration of Coconut Skim Milk and Evaluation of Functional Properties. CyTA - J. Food. 2014, 12(3), 227–234. DOI: 10.1080/19476337.2013.833296.
- Zyzelewicz, D.; Krysiak, W.; Nebesny, E.; Budryn, G. Application of Various Methods for Determination of the Color of Cocoa Beans Roasted Under Variable Process Parameters. Eur. Food Res. Technol. 2014, 238(4), 549–563. DOI: 10.1007/s00217-013-2123-6.
- Praseptiangga, D.; Nabila, Y.; Muhammad, D. R. A. Kajian Tingkat Penerimaan Panelis Pada Dark Chocolate Bar Dengan Penambahan Bubuk Kayu Manis (Cinnamomum Burmannii). J. Caraka Tani 2018, 33(1), 78–88. DOI: 10.20961/carakatani.v33i1.19582.
- Anita-Sari, I.; Murti, R. H.; Misnawi Putra, E. T. S.; Susilo, B.; Setyawan, A. W.; Susilo, A. W. Flavor Characteristics of Three Indonesian Cocoa Clones in Four Environments. Agronomy 2023, 13(10), 2658. DOI: 10.3390/agronomy13102658.
- Wang, Y.; Yan, H.; Zhuang, Y.; Tian, Y.; Yang, H. Effect of Soy Protein Isolate, Egg White Protein and Whey Protein Isolate on the Flavor Characteristics of Silver Carp (Hypophthalmichthys Molitrix) Surimi. LWT. 2023, 186, 115237. DOI: 10.1016/j.lwt.2023.115237.
- Raczyk, M.; Kruszewski, B.; Michałowska, D. T. Nutritional and Sensory Properties of Baked Wheat. Molecules 2021, 26(15), 4641. DOI: 10.3390/molecules26154641.
- Muhammad, D. R. A.; Marettama, N. M.; Fauza, G.; Affandi, D. R. Can Ingredients and Information Interventions Affect the Hedonic Level and (Emo-Sensory) Perceptions of the Milk Chocolate and Cocoa Drink’s Consumers? Open Agri. 2022, 7(1), 847–856. doi: 10.1515/opag-2022-0146.
- Schober, P.; Boer, C.; Schwarte, L. A. Correlation Coefficients: Appropriate Use and Interpretation. Anesth. Analg. 2018, 126(5), 1763–1768. DOI: 10.1213/ANE.0000000000002864.
- Ao, L.; Liu, P.; Wu, A.; Zhao, J.; Hu, X. Characterization of Soybean Protein Isolate-Food Polyphenol Interaction via Virtual Screening and Experimental Studies. Foods 2021, 10(11), 2813. DOI: 10.3390/foods10112813.
- Cornelia, M.; Tunardy, A. M.; Sinaga, W. S. L. The Effect of Cinnamon Extract (Cinnamomum Burmanii L.) Addition Towards the Characteristics of Soy Milk Ice Cream. Adv. Biol. Sci. Res 2022, 16, 32–38.