
 ?Mathematical formulae have been encoded as MathML and are displayed in this HTML version using MathJax in order to improve their display. Uncheck the box to turn MathJax off. This feature requires Javascript. Click on a formula to zoom.
ABSTRACT
The objective of this research was to check the effect of prebiotics extracted from citrus peels on the growth of both probiotic bacteria i.e. Lactobacillus reuteri and Bifidobacterium and enteric bacteria i.e. Escherichia coli in a milk-based model. For this purpose, the prebiotic from citrus peels was extracted using ultrasound-assisted extraction and their prebiotic activity scores were calculated for two probiotic bacterial strains i.e. Lactobacillus reuteri and Bifidobacterium. Afterwards, their growth patterns were studied in a milk-based model in different concentrations of prebiotics in individual and co-culture systems of both probiotic and enteric bacteria. The results showed significant effect of prebiotic concentration on the growth of bacteria supporting the growth of beneficial bacteria and hindering the growth of E. coli. This effect was more pronounced when enteric bacteria (E. coli) were co-cultured with probiotic bacteria i.e. L. reuteri and Bifidobacterium. Similarly, the growth of E. coli was hindered when grown in co-culture of L. reuteri, Bifidobacterium and E. coli. Conclusively, the citrus peel prebiotic was found to modulate the growth of probiotic bacteria while hindering the growth of enteric bacteria.
Introduction
The International Scientific Association for Probiotics and Prebiotics (ISAPP) reports that prebiotics are substrates that are selectively utilized by host microorganisms conferring a health benefit.[Citation1] These are indigestible substances that promote the growth of beneficial organisms in the human gut. Preferably, oligosaccharides are considered important substrate for the growth of lactic acid bacteria in the colon providing potential health benefits. At the same time, prebiotics inhibit the growth of pathogens like Salmonella and Escherichia coli.[Citation2,Citation3] The word “prebiotics” was initially coined by Roberfroid and Gibson. A number of criteria have been used to further develop the concept of prebiotics, such as gastric acid resistance, enzymes hydrolysis, and absorption through gastrointestinal track, microflora fermentation in intestine, and selectively stimulated growth or activity of intestinal bacteria.[Citation4,Citation5]
Dietary fiber (DF) is becoming increasingly popular as a food supplement these days. In this respect, horticultural crops and their by-products are considered vital to obtain soluble and insoluble dietary fibers. To maintain good gut health, it is recommended that the consumption of DF should be increase to 25–30 g/day. Consuming those products that are able to contribute fiber to regular intake of food should be increased. Adding fiber in widely consumed meals may help to compensate for the fiber inadequacy. However, prebiotic intake is difficult to assess since there is no analytical test or commonly acknowledged method, and prebiotic sources are in a broad variation of food categories and also supplements.[Citation6]
Dietary fibers hold significant potential to be used in different products for health promotion and disease prevention.[Citation7] The main citrus-producing nations globally are China, India, Nigeria, Brazil, Mexico, and Pakistan.[Citation8] However, the major ecological and economic problem is the millions of tons of waste that can only be tackled through proper waste management. There are numerous by-products streams that are recovered when processing fruits and vegetables including peels, seeds, and pomace etc. Amongst these, peels are extraordinary source of bioactive compounds and oligosaccharides having prebiotic potential.[Citation9] Citrus peels can be used for numerous applications in the food, nutraceutical, cosmetic industries, and biofuels production. Furthermore, phenolic compounds having antimicrobial, anti-inflammatory and antiaging properties have also been extracted from citrus peel. Moreover, citrus peels contain pectin (20–30%) which is the main prebiotic oligosaccharide with numerous health benefits and thus a potential source of multifunctional ingredient in the food industry.[Citation10] Hence, citrus peel is of great importance due to the presence of abundant fiber in it. Dietary fiber can be obtained from citrus peel via ultrasonication, acid/ alkali or enzymes treatment, or by combination of these techniques.[Citation11]
Prebiotics differ in their chemical characteristics and functional properties.[Citation12] A number of microbes, both beneficial and harmful, reside in the human gastrointestinal tract (GIT). If the population of harmful bacteria increases in the intestine, it can result in different health implications including diarrheal infections or hepatic disorder.[Citation13] The use of prebiotics favors the growth of good bacteria thereby lowering the incidence of negative health effects as probiotics produce beneficial compounds that support good gut health.[Citation14]
Commercially, prebiotics are frequently produced from waste of vegetables and fruits by techniques as the enzymatic breakdown of polysaccharides obtained from starch or DF. Among the potential prebiotic polysaccharides are lactulose, lactose, soybean oligosaccharides, palatinose, iso-malto-oligosaccharides, gluco-oligosaccharides, and xylo-oligosaccharides. Previous studies have indicated that prebiotic carbohydrates boost the viability of probiotics when exposed to gastric conditions.[Citation15]
The prebiotic component tends to stimulate certain intestinal beneficial bacteria, importantly lactic acid producing bacteria such as Lactobacilli and Bifidobacterium that are residents of the gut rather than introducing some exogenous species.[Citation16] Probiotic strains, especially Lactobacillus and Lactococcus species, are important for inhibiting the growth of bad bacteria, by occupying epithelial and mucosal layer and by producing bacteriocins or bacteriocin-like molecules that are antimicrobial agents, hydrogen and organic acids that help in suppressing the growth of microorganisms.[Citation17,Citation18] The main advantage of probiotic bacteria is the development of microbiota environment in a way to keep proper balance between beneficial bacteria and pathogens.[Citation19] Another function is to counter the pathogens in intestine that are introduced from the environment or contaminated food.[Citation20] That is why probiotic inhibit the proliferation of pathogenic bacteria like Campylobacter jejuni, Escherichia coli, Salmonella Enteritidis and Clostridium perfringens, various other species of Staphylococcus, Yersinia, Shigella, this way preventing from food poisoning.[Citation20,Citation21]
Although, a plethora of investigations on prebiotics is available but in general, there are limited studies in context to prebiotic potential of citrus fruit peels. The current research focused on extraction, characterization, and prebiotic evaluation of citrus peel oligosaccharides in a milk-based model to access the prebiotic activity using probiotic bacteria including Lactobacillus reuteri & Bifidobacterium and enteric bacteria i.e. E. coli. Milk has been used as a medium for both probiotic and enteric bacteria based on the fact that all the bacteria utilized in the study are lactose fermenting bacteria. The research work was done to determine the prebiotic efficacy of citrus peels extracted prebiotic and its effect on the growth of individual and co-cultured bacteria.
Materials and methods
Extraction of prebiotic using ultrasound assisted extraction
The prebiotic from citrus peel was extracted using ultrasound assisted extraction. For the purpose, citrus peel was initially mixed with 2 M HNO3 at 2.5 pH at 40°C for 30 min to remove proteins. Then the sample was washed using distilled water and residues were further mixed with 0.08 M phosphate buffer (1:50 m/v) and the pH was adjusted to 6. The mixture was ultrasonicated for 9 min at 25°C using ultrasonic probe (Sonomechanics) with 40% amplitude. The mixture was then added with ethanol (2×) and the suspension was allowed to precipitate for 60 min. The obtained residues were filtered then washed with 80% ethanol, and then oven-dried at 40°C to obtain concentrated prebiotics fiber. The extraction yield was determined using the following formula.[Citation4]
Estimation of soluble (SF), insoluble (ISF) and total fiber content
The method of Kaur et al.[Citation22] was used for estimation of soluble and insoluble fiber fractions. The obtained fraction from previous step was centrifuged at 5000 g for 15 min. The resulting solid material was rinsed with distilled water, dried, and identified as insoluble fiber. The liquid portion was combined with 95% ethanol (4×) and kept for 2 h to precipitate. The collected residue was washed with absolute ethanol and dried to obtain soluble fiber. The amounts of soluble and insoluble fiber were added to determine the total fiber content.
FTIR analysis
The FTIR spectrometer (Bruker, Alpha II, Germany) was used and the spectra between 500–4000 cm−1 wavenumbers were obtained to characterize citrus peel powder and its soluble and insoluble fractions from the extract.
Preparation of extract for phytochemical and antioxidant screening
The obtained prebiotic (1 g) was dissolved in 20 mL of aqueous ethanol (30%). The solution was mixed on orbital shaker at 4°C for 16 hr at 120 rpm. The mixture was then centrifuged at 5000 rpm for 20 min at 4°C, and the liquid fraction was collected and stored at −20°C till further analyses.[Citation23]
Total flavonoid content (TFC)
For the determination of TFC, prebiotic extract (800 µL) was mixed with 1.2 mL sodium nitrite solution (5%) and 80 µL of aluminum chloride (2%). The mixture was then allowed to stay at room temperature for 2.5 hr and then the absorbance was taken at 440 nm. The TFC was quantified from the standard curve of quercetin (0–50 µg/mL) and the final results were expressed as milligram quercetin equivalents per gram dry weight (mg QE/g dw).[Citation24]
Diphenyl-2-picrylhydrazyl (DPPH) antioxidant activity
To estimate DPPH scavenging activity of prebiotic, 400 µL of the extract was mixed with 2.6 mL of 0.1 M DPPH solution in methanol, and the mixture was incubated at room temperature for 30 min. The absorbance was taken at 517 nm. The percent reduction in DPPH radicals was estimated compared to control.[Citation25]
ABTS+ scavenging activity
To generate the ABTS+ cation radical, a solution of potassium persulfate (140 mM) and ABTS (7 mM) and in methanol were mixed and kept in the dark at room temperature for 12–16 h. The solution was then diluted until it reached the absorbance of 0.70 ± 0.02 at 734 nm. Afterwards, 100 µL of the extract was added to 2.90 mL of ABTS+ solution and rested for 6 min before measuring its absorbance at 734 nm. The percent reduction in ABTS+ radicals was estimated compared to control.[Citation26]
Water holding capacity
In order to determine water retention ability of fiber concentrate from citrus peels, 20 mL of distilled water was added to 0.5 g sample and thoroughly mixed. The mixture was soaked for 24 h, after which it was centrifuged for 10 minutes at 4000×g. The resulting supernatant was syphoned, and the residue was weighed. The water holding capacity (WHC) was calculated using the following expression.[Citation27]
where, W1 is initial weight of the sample, W2 is final weight of the residue.
Oil holding capacity (OHC)
To estimate OHC of the citrus peel prebiotic fiber, 0.5 g of sample was mixed with 10 mL of vegetable oil and kept at room temperature for 1 h. The mixture was then centrifuged for 10 min at 4000×g, and the supernatant was syphoned. The residue was then weighed, and the OHC was calculated using the below formula.[Citation28]
where, O1 is initial weight of the sample, O2 is final weight of the residue.
Prebiotic effect on the growth of probiotics
To check the effect of prebiotic extract from citrus peel, various concentrations of prebiotic were used as shown in . The growth of probiotics was observed using plate count method against different concentrations of prebiotic.
Table 1. Treatment plan.
Culture acquisition
For the starter strains the probiotic bacteria L. reuteri (ReuFLORATM, UniCare) and Bifidobacterium (GutCareTM, Searle) were revived from probiotic sachets in deMan Rogosa Sharpe (MRS) broth then streaked on MRS agar and were kept in petri plates with MRS agar under refrigeration to be used later. The strains were also preserved in 40% (v/v) glycerol stock at −80°C for further usage. The identification of the strains was made on morphological characteristics.
Prebiotic activity score
For the prebiotic activity assay, the L. reuteri culture was streaked on MRS agar and incubated at 37°C for 48 h, Bifidobacterium was also streaked on MRS agar and incubated at 37°C. E. coli was streaked on Tryptic Soy Agar (TSA) and incubated at 37°C for 24 h. A bacterial colony from the MRS plates was transferred into 10 mL MRS broth and incubated at 37°C for 16 h and one colony from the TSA plates was transferred into 10 mL Tryptic Soy Broth (TSB), and incubated at 37°C for 16 hr. The 100 µL of overnight cultures were transferred to 20 mL of MacConkey MRS media having added prebiotic and MRS media with added glucose for L. reuteri and Bifidobacterium. Whereas, inoculum from E. coli was transferred to M9 Media having added prebiotic and TSB for glucose. Culture tubes were vortexed to mix the components and inoculums were spread on MRS agar for L. reuteri and Bifidobacterium and on TSA for E. coli, respectively. The cultured plates were incubated at 37°C for 24 hr. The log colony forming units (CFU) were calculated and compared between prebiotic and glucose plates after 24 hr of incubation to calculate the prebiotic activity score.[Citation29]
Total viability of L. reuteri and Bifidobacterium on modified MRS media
The prebiotic activity was determined through the growth of L. reuteri, and Bifidobacterium as described with minor modification. The modified MRS broth (mMRS) was prepared using bacteriological peptone (10 g/L), Lab Lemco powder (8 g/L), yeast extract (4 g/L), Tween 80 (1 g/L), dipotassium hydrogen phosphate (2 g/L), sodium acetate trihydrate (5 g/L), ammonium citrate tribasic (2 g/L), magnesium sulfate heptahydrate (0.2 g/L), and manganese sulfate tetrahydrate (0.05 g/L) in Milli-Q water. The steps were repeated by using glucose as a positive control and non-glucose added as a negative control. The pH of the mMRS broth medium was adjusted to 6.2 ± 0.2 at 25°C before autoclaving (121°C, 15 psi, 15 min). After that the mMRS broth was transferred into test tubes and prebiotic was added in different concentrations (1, 2, 3, 4 and 5 g/100 mL, separately). The overnight grown probiotic culture (1% v/v) L. reuteri (1–2 × 10⁹ CFU/mL) and Bifidobacterium were aseptically inoculated into the sterile mMRS broth and incubated at 37°C for 24 hr while shaking at 120 rpm. The bacterial colonies were plated on MRS agar in anaerobic conditions and incubated at 37°C for 24, 48, 72 and 96 hr, separately. All samples including positive and negative control were performed in triplicate.[Citation30] The bacterial viable cell count was determined using the following formula:
Milk fermenting model
The milk-fermentation model used for assessment of effect of citrus peel prebiotic is described in . The isolated bacteria were resuspended in sterile MRS broth for prebiotic and Tryptic Soy broth for E. coli and incubated for 24 h in the shaking incubator at 37°C for 24 h with agitation (120 rpm). UHT treated milk was diluted three folds with sterile water as (1:3) and pasteurized at 72°C for 15 s. The prebiotic was added to the milk (1, 2, 3, 4 and 5 g) and a control (with no added prebiotic) was also prepared. Lately, bacterial strains were inoculated to the treatments combinations as per the experimental model individually and in combinations and incubated at 37°C for 24 h. Afterwards, the grown bacterial strains were inoculated to MRS and MacConkey agars for different combinations, respectively as detailed in and incubated for 24 h at 37°C. Then, the bacterial counts for each treatment were calculated using the following formula:
Table 2. Description of milk fermentation model.
Statistical analysis
The data related to the parameters was handled using Microsoft Excel (365). Analysis of Variance was used to determine statistical significance (p < .05) between the treatments using Statistix (v8.1) software.
Results
Characterization of prebiotic extracted from citrus peel
The quality parameters of prebiotic extracted from citrus peel included its yield, soluble and insoluble dietary fiber, total flavonoids, DPPH and ABTS radical scavenging activity, water and oil holding capacity and prebiotic activity score for Lactobacillus and Bifidobacterium. The results pertaining to these parameters are shown in . It was seen that a sufficient yield was observed to be 76.48 ± 3.60%. The total amount of soluble dietary fiber extracted per 100 g of peel powder was 64.82 ± 2.46 g and insoluble fiber was 11.66 ± 1.14 g. FTIR spectrometer analysis showed larger number of peaks identified in citrus peel powder and soluble fraction of citrus peel extract compared to insoluble fraction of citrus peel extract (). The peaks indicated the presence of C – H, O – H and C=O stretching vibrations. However, the intensity of the peaks was different between insoluble and soluble fractions compared to citrus peel powder.
Figure 1. FTIR transmittance spectra for citrus peel powder, insoluble and soluble fractions of citrus peel powder extracts.
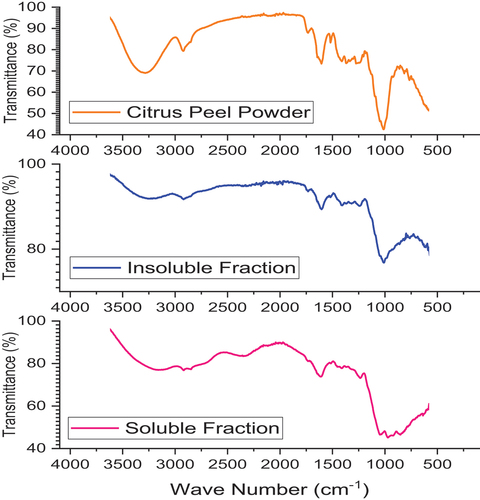
Table 3. Characterization of prebiotic extracted from citrus peel.
The total flavonoid contents were found to be 14.28 ± 0.01 mg QE/g of prebiotic. The antioxidant activity was 73.36 ± 0.09% against DPPH radical whilst, 89.14 ± 0.08% antiradical activity was noticed against ABTS+ radical. The prebiotic extracted from citrus peel represented quite promising water holding and oil holding capacities as evident from the results as 7.79 ± 0.033 g/g and 3.22 ± 0.008 g/g, respectively. It was observed that prebiotic activity score of the citrus peel oligosaccharides was better for Bifidobacterium than L. reuteri however, for both probiotics, a promising prebiotic activity scores were noticed as 1.54 ± 0.05 for L. reuteri and 2.93 ± 0.05 for Bifidobacterium.
Prebiotic efficacy of the extracted prebiotic
The efficacy of the prebiotic was tested at various concentrations as T1 (1 g/100 mL), T2 (2 g/100 mL), T3 (3 g/100 mL), T4 (4 g/100 mL) and T5 (5 g/100 mL). Statistical analysis indicated that growth of probiotic strains was significantly (p < .05) affected with respect to prebiotic concentration and time length for growth ().
Table 4. Mean squares for microbial growth affected by prebiotic as a function of time.
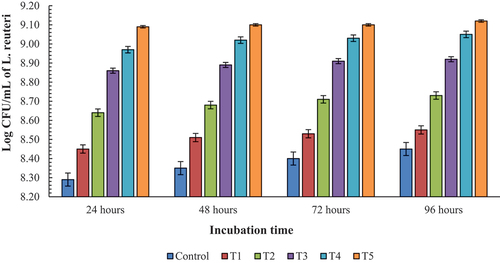
represents a gradual increase in the growth of L. reuteri with the increasing concentration of prebiotics along with the increasing time. The growth was minimum in the control i.e. with no prebiotics added. While maximum growth was observed in T5 gradually increasing with time till 96 h. However, the growth pattern of the T1 and control treatments were statistically different from each other. In general, the increasing concentration of prebiotics supported the growth of bacteria alongside change in time.
Figure 2. Growth of L. reuteri over the period of time at different concentrations of prebiotic.
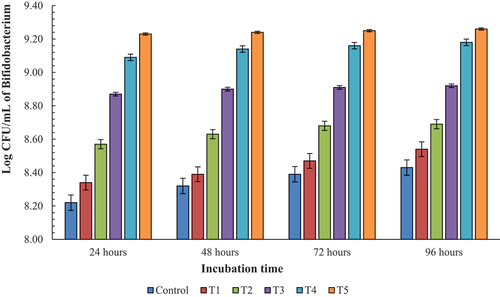
represents the average growth of Bifidobacterium over the period of time as affected by prebiotic concentration during incubation. A gradual increase in bacterial population was observed over the period of time. The lowest bacterial population was noticed after 24 h in control followed by T1 as 8.34 log CFU/mL at 24 h. Although, the prebiotic in T1 supported the growth of bacteria better than control over the period of time, the growth pattern of control and T1 were statistically alike. Similarly, there was similar effect on the growth of Bifidobacterium in T4 and T5 but statistically different from T3. Moreover, there was little change in growth of Bifidobacterium in T3 as the incubation time progressed.
Figure 3. Growth of Bifidobacterium over the period of time at different concentrations of prebiotic.
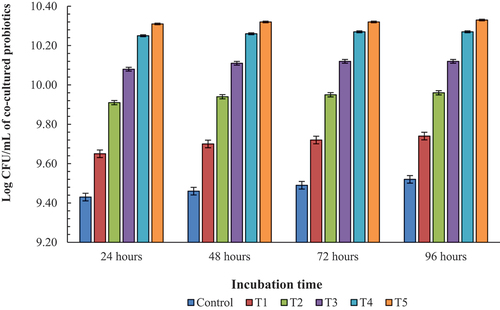
The data shown in represented a gradual increase in the growth of co-culture of both probiotics with the increasing concentration of prebiotic and also along with the increasing time interval. The growth was minimum for the Control as 9.43 log CFU/mL after 24 h that increased to 9.48 log CFU/mL after 96 h. Moreover, there was observed no significant difference in growth of co-culture bacteria at T3, T4 and T5 i.e., 10.08, 10.25, 10.31 log CFU/mL at 24 h. Furthermore, for all the treatments no significant increase in the log CFU/mL was seen at different incubation periods showing nearly similar growth after 24 h till 96 h of incubation time.
Figure 4. Growth of L. reuteri and Bifidobacterium in co-culture system over the period of time at different concentrations of prebiotic.
Effect of prebiotic on growth of L. reuteri, Bifidobacterium and E. coli in milk model
Statistically significant (p < .05) results were seen with respect to growth of L. reuteri, Bifidobacterium and E. coli in milk model (). represents the growth pattern for L. reuteri, Bifidobacterium, co-culture of both probiotic bacteria and E. coli. As per the observed trend the growth of L. reuteri increased from control to 2 g and then it remained constant through 4 g, and a slight increase was observed in the log CFU/mL at 4 g. Similar trend was observed for Bifidobacterium. Yet an increasing trend was observed for co-culture with respect to increasing prebiotic concentration. Moreover, an increase in log CFU/mL was observed for E. coli at Control and a gradual decline was observed with the increasing concentration of prebiotic.
Figure 5. Growth of L. reuteri (L1), Bifidobacterium (B1), E. coli (E1) and co-culture of probiotic bacteria (LbB1) at different concentrations of prebiotic (spread plated on MRS and MacConkey agar).
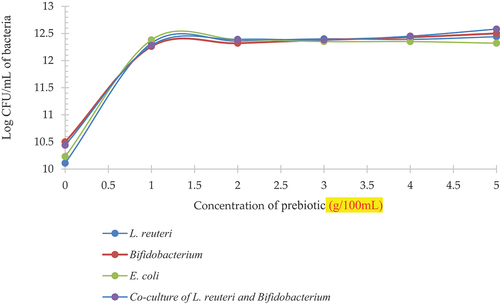
Table 5. Mean squares for microbial growth affected by prebiotic in milk.
Statistically significant (p < .05) results were seen with respect to growth of bacterial co-cultures in milk model grown on MacConkey agar (). depicts log CFU/mL for Growth of E. coli on MacConkey agar previously incubated as a mix of L. reuteri and E. coli indicated as E2, and log CFU/mL for Growth of E. coli on MacConkey agar previously incubated as a mix of Bifidobacterium and E. coli indicated as E3, and log CFU/mL for Growth of E. coli on MacConkey agar previously incubated as a mix of L. reuteri, Bifidobacterium and E. coli indicated as E4.
Figure 6. Log CFU/mL of E. coli incubated with L. reuteri (E2), E. coli incubated with Bifidobacterium (E3), E. coli incubated with L. reuteri and Bifidobacterium (E4) at different concentrations of prebiotic (spread plated on MacConkey agar).
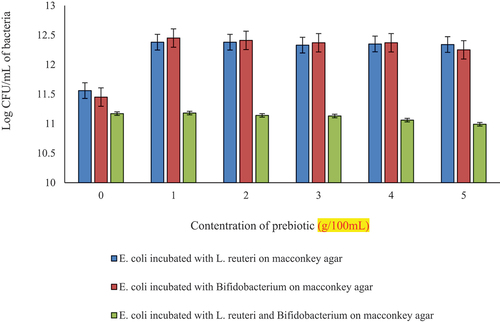
Table 6. Mean squares for microbial growth affected by prebiotic in milk grown on MacConkey agar.
E2 has been observed to have an increase in growth compared to Control to 1 g then a decline was observed until 5 g a similar trend was observed for E3 as well, yet a slightly more decrease was observed at 5 g. While E4 was observed to have very low log CFU/mL that gradually decreased with the increasing prebiotic concentration.
Statistically significant results were seen with respect to growth of bacterial co-cultures in milk model grown on MRS media (). exhibits log CFU/mL for Growth of L. reuteri on MRS agar previously incubated as a mix of L. reuteri and E. coli indicated as L2, and log CFU/mL for Growth of Bifidobacterium on MRS agar previously incubated as a mix of Bifidobacterium and E. coli indicated as B2, and log CFU/mL for Growth of L. reuteri and Bifidobacterium on MRS agar previously incubated as a mix of L. reuteri, Bifidobacterium and E. coli indicated as LbB2.
Figure 7. Log CFU of L. reuteri incubated with E. coli (L2), Bifidobacterium incubated with E. coli (B2), L. reuteri and Bifidobacterium incubated with E. coli (LbB2) at different concentrations of prebiotic (spread plated on MRS agar).
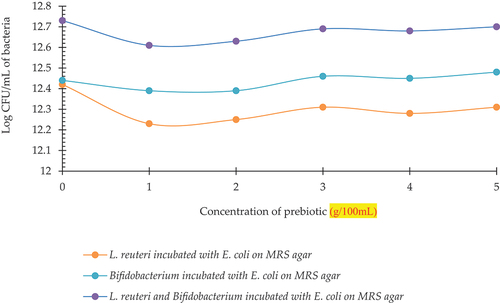
Table 7. Mean squares for microbial growth affected by prebiotic in milk grown on MRS agar.
The growth pattern indicated a decline in growth of L2 at 1 g then it increased until 3 g and with a slight decline at 4 g it again increased at 5 g. A similar trend was observed for Bifidobacterium but with a slight decline till 2 g than L2 but having higher log CFU/mL values than L. reuteri. The highest log CFU/mL was observed for LbB2 following a similar trend as others.
Statistically significant results were seen with respect to growth of E. coli individually and with Lactobacilli and Bifidobacterium, separately (). exhibited log CFU for growth of E. coli indicated as E1, and log CFU for Growth of E. coli on MRS agar previously incubated as a mix of L. reuteri and E. coli indicated as E5, and log CFU for Growth of E. coli on MRS agar previously incubated as a mix of Bifidobacterium and E. coli indicated as E6.
Figure 8. Log CFU/mL of E. coli (E1), E. coli incubated with L. reuteri (E5), E. coli incubated with Bifidobacterium (E6) at different concentrations of prebiotic (spread plated on MRS agar).
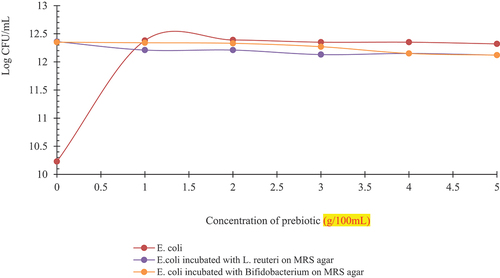
Table 8. Mean squares for microbial growth affected by prebiotic in milk grown on MRS agar.
The trend indicated an increase in growth at control then a gradual decline was observed until 5 g for E1. Similarly, a slight increase was observed for E5 at 2 g then it again decreased at 2 g and remained the same at 4 g and 5 g. A constant but slightly higher value from E5 was observed for E6 that seen a decline at 4 and 5 g.
Discussion
Prebiotics are vital components in the diet of humans that may directly influence the growth of intestinal microflora.[Citation16] The main advantage of probiotic bacteria is the development of microbiota environment in a way to keep proper balance between beneficial bacteria and pathogens.[Citation19] Prebiotics resist to digestion by the enzymes in small intestine but bacteria in the large intestine can ferment these substances. Short-chain fatty acids most importantly propionate, acetate, and butyrate, produced as a result of fermentation which cause the decrease in pH can result in possible reduction of pathogenic microorganisms. The fermentation of prebiotics also improves the host’s health by stimulating and enhancing absorption of minerals like Ca, Fe and Mg and producing compounds that help in preventing colon cancer.[Citation31,Citation32]
The results of our research for prebiotic efficacy are in line with previous research that showed similar effects.[Citation30] They used Banana, Citrus and Watermelon peels and checked their effect on the growth of probiotic bacteria. They found out that the survivability of probiotic increased with the concentration of peel powder justifying that fiber is a good source of oligosaccharides being reduced with the intervals to be available for the bacteria to take up and grow. It could be inferred that high CFU count was attributed to the readily available glucose and then degraded sugars from the prebiotic.[Citation30]
For the milk model, the individual strains of L. reuteri, Bifidobacterium when grown together with prebiotic in media showed significantly higher CFU/mL as compared to individual CFU/mL. Similarly, CFU/mL for co-culture of individual prebiotic with E. coli represented more growth than the co-culture of probiotic and E. coli that represented a sharp decline in growth of E. coli. The results of present research were confirmed by the work done by Fooks and Gibson[Citation33] on the effect of probiotics and prebiotics on human intestinal pathogens. Each of the pathogenic pathogens evaluated using plate assays E. coli, was partially inhibited by all of the probiotic strains tended to restrict enteric bacterial development to a larger extent than that reported for the other strains included, especially with E. coli.
There is a wealth of knowledge about the alleged probiotic action of L. reuteri, which is mostly linked to the development of reuterin, an antimicrobial protein that requires glycerol in the growing medium to be synthesized.[Citation34,Citation35] Since it is unknown how much glycerol would be present in the gut to be used by L. reuteri to produce reuterin, it is not known how much glycerol would be available. Using well diffusion experiments, six B. bifidum strains were investigated and found to suppress the development of Salmonella typhosa and E. coli to varying degrees. A number of harmful bacteria have been shown to be inhibited by eight different bifidobacteria species, including B. bifidum.[Citation36]
The main metabolic byproducts of Lactobacilli and Bifidobacterial fermentations are acetate and lactate, which are, cause the pH of the culture to fall. When fructooligosaccharides, inulin, xylooligosaccharides, and mixes thereof were used as the carbohydrate sources in both plate assay and co-culture tests, the pH of the cell-free extract was low.[Citation37] Low pH does, in fact, operate as the main inhibitory parameter, although some data contradict this conclusion, which makes this claim ambiguous. A decrease in pH increased the antagonistic properties against enteric bacteria during incubation time. But it is proposed that the anion buildup caused by a pH gradient in the bacterial cytoplasm is the mechanism behind the mechanistic explanation. The concentration of anionic species, in the more alkaline core depends on a pH gradient, due to fermentation acid dissociation across the membrane.[Citation38]
Although E. coli strains possess the genetic information to synthesize sugars de novo, it is clearly in their interest to scavenge sugars from the surrounding environment. Polysaccharides are extensively degraded by the Probiotic bacteria. In contrast to E. coli, which is limited to growth on mono- or disaccharides, the endogenous microbiota can also use oligosaccharides, and even in some cases preferentially uses oligosaccharides rather than the corresponding monomers.[Citation38]
Bacteria tend to consume the preferable sugars sequentially, through a process known as catabolite repression, during the growth on the mixture of sugars, first consume the sugar yielding the highest growth rate. They do this by repressing the expression of the genes involved in metabolizing the less preferred sugars. The classic example involves the growth of the bacterium Escherichia coli on glucose and lactose, where E. coli will consume glucose before lactose.[Citation39] This could be the possible reason for low growth of E. coli. Another study showed that the absence of nitrogen source could hinder the uptake of glucose and thus limit the growth of E. coli.[Citation40] As the bacteria were grown in milk and not in minimal media this might be the limiting factor in the growth of E. coli.
Based on the findings of the current research it can be concluded that prebiotic oligosaccharides are effective in enhancing the beneficial microbiota and hindering the growth of enteric bacteria specifically, when used in synbiotics and can be incorporated in many functional foods. Further research needs to be done to determine the effect of prebiotic on the intestinal system.
Conclusion
This scientific investigation showed that prebiotic oligosaccharides extracted from citrus peel waste is an effective prebiotic as evidenced from its positive effect on growth of probiotic bacterial strains i.e. Lactobacillus reuteri and Bifidobacterium. It was also found that citrus peel oligosaccharides suppress the growth of pathogenic bacteria i.e., E. coli, when it is co-cultured with probiotic bacteria i.e., Lactobacillus reuteri and Bifidobacterium. Furthermore, milk-based model used in this study has shown that citrus peel probiotic is effective to promote Lactobacillus reuteri and Bifidobacterium, and hindering the growth of E. coli in co-cultured food system. Hence, citrus peel prebiotic can be a potential candidate for development of synbiotic and functional food products. However, further research is needed using in vivo models to investigate the effect of citrus oligosaccharides on gut health.
Acknowledgments
The research of this project was funded by Kauser Abdulla Malik School of Life Sciences (KAM-SLS), Forman Christian College (A Chartered University), Lahore, Punjab, Pakistan. This project was supported by Researchers Supporting Project number (RSP2025R5), King Saud University, Riyadh, Saudi Arabia.
Disclosure statement
No potential conflict of interest was reported by the author(s).
Data availability statement
Data will be shared upon request.
References
- Bevilacqua, A.; Campaniello, D.; Speranza, B.; Racioppo, A.; Sinigaglia, M.; Corbo, M. R. An Update on Prebiotics and on Their Health Effects. Foods. 2024, 13(3), 446. DOI: 10.3390/foods13030446.
- Davani-Davari, D.; Negahdaripour, M.; Karimzadeh, I.; Seifan, M.; Mohkam, M.; Masoumi, S. J.; Berenjian, A.; Ghasemi, Y. Prebiotics: Definition, Types, Sources, Mechanisms, and Clinical Applications. Foods. 2019, 8(3), 92. DOI: 10.3390/foods8030092.
- Macfarlane, G. T.; Cummings, J. H. Probiotics and Prebiotics: Can Regulating the Activities of Intestinal Bacteria Benefit Health? BMJ. 1999, 318(7189), 999–1003. DOI: 10.1136/bmj.318.7189.999.
- Oloye, M. T.; Jabar, J. M.; Adetuyi, A. O.; Lajide, L. Extraction and Characterization of Pectin from Fruit Peels of Irvingia Gabonensis and Pulp of Cola Milleni and Theobroma Cacao as Precursor for Industrial Applications. Biomass Conv. Bioref. 2021, 13(3), 1–9. DOI: 10.1007/s13399-021-01366-4.
- Boesmans, L.; Valles-Colomer, M.; Wang, J.; Eeckhaut, V.; Falony, G.; Ducatelle, R.; Van Immerseel, F.; Raes, J.; Verbeke, K.; Cotter, P. D. Butyrate Producers as Potential Next-Generation Probiotics: Safety Assessment of the Administration of Butyricicoccus Pullicaecorum to Healthy Volunteers. Msystems 2018, 3(6), 10–128. DOI: 10.1128/mSystems.00094-18.
- Miller, K. B. Review of Whole Grain and Dietary Fiber Recommendations and Intake Levels in Different Countries. Nutr. Rev. 2020, 78(Supplement_1), 29–36. DOI: 10.1093/nutrit/nuz052.
- Panwar, D.; Saini, A.; Panesar, P. S.; Chopra, H. K. Unraveling the Scientific Perspectives of Citrus By-Products Utilization: Progress Towards Circular Economy. Trends Food Sci. Technol. 2021, 111, 549–562. DOI: 10.1016/j.tifs.2021.03.018.
- Zhong, G.; Nicolosi, E. Citrus Origin, Diffusion, and Economic Importance. In Citrus Genome, Gentile, A.; La Malfa, S.; Deng, Z.; Eds.; Compendium of Plant Genomes: Springer, Cham, 2020; 5–21. Doi: 10.1007/978-3-030-15308-3_2.
- Kamal, M. M.; Kumar, J.; Mamun, M. A. H.; Ahmed, M. N. U.; Shishir, M. R. I.; Mondal, S. C. Extraction and Characterization of Pectin from Citrus sinensis Peel. J. Biosyst. Eng. 2021, 46(1), 16–25. DOI: 10.1007/s42853-021-00084-z.
- Dhalaria, R.; Verma, R.; Kumar, D.; Puri, S.; Tapwal, A.; Kumar, V.; Nepovimova, E.; Kuca, K. Bioactive Compounds of Edible Fruits with Their Anti-Aging Properties: A Comprehensive Review to Prolong Human Life. Antioxidants. 2020, 9(11), 1123. DOI: 10.3390/antiox9111123.
- Li, Y.; Niu, L.; Guo, Q.; Shi, L.; Deng, X.; Liu, X.; Xiao, C. Effects of Fermentation with Lactic Bacteria on the Structural Characteristics and Physicochemical and Functional Properties of Soluble Dietary Fiber from Prosomillet Bran. LWT. 2022, 154, 112609. DOI: 10.1016/j.lwt.2021.112609.
- Ahmad, A. M. R.; Ahmed, W.; Iqbal, S.; Javed, M.; Rashid, S. Prebiotics and Iron Bioavailability? Unveiling the Hidden Association-A Review. Trends Food Sci. Technol. 2021, 110, 584–590. DOI: 10.1016/j.tifs.2021.01.085.
- Zhang, Y.-J.; Li, S.; Gan, R.-Y.; Zhou, T.; Xu, D.-P.; Li, H.-B. Impacts of Gut Bacteria on Human Health and Diseases. Int. J. Mol. Sci. 2015, 16(4), 7493–7519. DOI: 10.3390/ijms16047493.
- Swanson, K. S.; Gibson, G. R.; Hutkins, R.; Reimer, R. A.; Reid, G.; Verbeke, K.; Scott, K. P.; Holscher, H. D.; Azad, M. B.; Delzenne, N. M. The International Scientific Association for Probiotics and Prebiotics (ISAPP) Consensus Statement on the Definition and Scope of Synbiotics. Nat. Rev. Gastroenterol. Hepatol. 2020, 17(11), 687–701. DOI: 10.1038/s41575-020-0344-2.
- Yadav, M. K.; Kumari, I.; Singh, B.; Sharma, K. K.; Tiwari, S. K. Probiotics, Prebiotics and Synbiotics: Safe Options for Next-Generation Therapeutics. Appl. Microbiol. Biotechnol. 2022, 106(2), 505–521. DOI: 10.1007/s00253-021-11646-8.
- Wang, S.; Xiao, Y.; Tian, F.; Zhao, J.; Zhang, H.; Zhai, Q.; Chen, W. Rational Use of Prebiotics for Gut Microbiota Alterations: Specific Bacterial Phylotypes and Related Mechanisms. J. Funct. Foods. 2020, 66, 103838. DOI: 10.1016/j.jff.2020.103838.
- Ballan, R.; Battistini, C.; Xavier-Santos, D.; Saad, S. M. I. Interactions of Probiotics and Prebiotics with the Gut Microbiota. Prog. Mol. Biol. Transl. Sci. 2020, 171, 265–300.
- McCuaig, B.; Goto, Y. Immunostimulating Commensal Bacteria and Their Potential Use as Therapeutics. Int. J. Mol. Sci. 2023, 24(21), 15644. DOI: 10.3390/ijms242115644.
- Rueda-Robles, A.; Rodríguez-Lara, A.; Meyers, M. S.; Sáez-Lara, M. J.; Álvarez-Mercado, A. I. Effect of Probiotics on Host-Microbiota in Bacterial Infections. Pathogens. 2022, 11(9), 986. DOI: 10.3390/pathogens11090986.
- Khaneghah, A. M.; Abhari, K.; Eş, I.; Soares, M. B.; Oliveira, R. B.; Hosseini, H.; Rezaei, M.; Balthazar, C. F.; Silva, R.; Cruz, A. G. Interactions Between Probiotics and Pathogenic Microorganisms in Hosts and Foods: A Review. Trends Food Sci. Technol. 2020, 95, 205–218. DOI: 10.1016/j.tifs.2019.11.022.
- Chingwaru, W.; Vidmar, J. Potential of Zimbabwean Commercial Probiotic Products and Strains of Lactobacillus Plantarum as Prophylaxis and Therapy Against Diarrhoea Caused by Escherichia coli in Children. Asian Pac. J. Trop. Med. 2017, 10(1), 57–63. DOI: 10.1016/j.apjtm.2016.12.009.
- Kaur, B.; Panesar, P. S.; Thakur, A. Extraction and Evaluation of Structural and Physicochemical Properties of Dietary Fiber Concentrate from Mango Peels by Using Green Approach. Biomass Conv. Bioref. 2021, 1–10. DOI: 10.1007/s13399-021-01740-2.
- Peng, D.; Zahid, H. F.; Ajlouni, S.; Dunshea, F. R.; Suleria, H. A. Lc-Esi-Qtof/ms Profiling of Australian Mango Peel By-Product Polyphenols and Their Potential Antioxidant Activities. Processes 2019, 7(10), 764. DOI: 10.3390/pr7100764.
- Ali, A.; Wu, H.; Ponnampalam, E. N.; Cottrell, J. J.; Dunshea, F. R.; Suleria, H. A. Comprehensive Profiling of Most Widely Used Spices for Their Phenolic Compounds Through LC-ESI-QTOF-MS2 and Their Antioxidant Potential. Antioxidants 2021, 10(5), 721. DOI: 10.3390/antiox10050721.
- Shang, H.-M.; Zhou, H.-Z.; Yang, J.-Y.; Li, R.; Song, H.; Wu, H.-X.; Agbor, G. In vitro and in vivo Antioxidant Activities of Inulin. PLOS ONE. 2018, 13(2), e0192273. DOI: 10.1371/journal.pone.0192273.
- Iqbal, Y.; Ponnampalam, E. N.; Suleria, H. A.; Cottrell, J. J.; Dunshea, F. R. LC-ESI/QTOF-MS Profiling of Chicory and Lucerne Polyphenols and Their Antioxidant Activities. Antioxidants 2021, 10(6), 932. DOI: 10.3390/antiox10060932.
- Zhang, W.; Zeng, G.; Pan, Y.; Chen, W.; Huang, W.; Chen, H.; Li, Y. Properties of Soluble Dietary Fiber-Polysaccharide from Papaya Peel Obtained Through Alkaline or Ultrasound-Assisted Alkaline Extraction. Carbohydr. Polym. 2017, 172, 102–112. DOI: 10.1016/j.carbpol.2017.05.030.
- Huang, X.; Dou, J.-Y.; Li, D.; Wang, L.-J. Effects of Superfine Grinding on Properties of Sugar Beet Pulp Powders. LWT. 2018, 87, 203–209. DOI: 10.1016/j.lwt.2017.08.067.
- Figueroa-Gonzalez, I.; Rodriguez-Serrano, G.; Gomez-Ruiz, L.; Garcia-Garibay, M.; Cruz-Guerrero, A. Prebiotic Effect of Commercial Saccharides on Probiotic Bacteria Isolated from Commercial Products. Food Sci. Technol. 2019, 39(3), 747–753. DOI: 10.1590/fst.07318.
- Leong, S. S.; Rahim, E. F. A.; Sarbini, S. R.; Latif, K.; Malahubban, M. Banana (Musa Acuminata), Orange (Citrus Reticulata), and Watermelon (Citrullus lanatus) Peels as Prebiotic. Borneo J. Res. Sci. Technol. 2022, 12(1), 81–94. DOI: 10.33736/bjrst.4528.2022.
- Ribeiro, J. A.; dos Santos Pereira, E.; de Oliveira Raphaelli, C.; Radünz, M.; Camargo, T. M.; da Rocha Concenço, F. I. G.; Cantillano, R. F. F.; Fiorentini, Â. M.; Nora, L. Application of Prebiotics in Apple Products and Potential Health Benefits. J. Food Sci. Technol. 2022, 59(4), 1249–1262.
- Sehrawat, N.; Yadav, M.; Singh, M.; Kumar, V.; Sharma, V. R.; Sharma, A. K. Probiotics in Microbiome Ecological Balance Providing a Therapeutic Window Against Cancer. Semin. Cancer Biol. 2021, 70, 24–36.
- Fooks, L. J.; Gibson, G. R. In vitro Investigations of the Effect of Probiotics and Prebiotics on Selected Human Intestinal Pathogens. FEMS Microbiol. Ecol. 2002, 39(1), 67–75. DOI: 10.1111/j.1574-6941.2002.tb00907.x.
- Sun, M.-C.; Hu, Z.-Y.; Li, D.-D.; Chen, Y.-X.; Xi, J.-H.; Zhao, C.-H. Application of the Reuterin System as Food Preservative or Health-Promoting Agent: A Critical Review. Foods. 2022, 11(24), 4000. DOI: 10.3390/foods11244000.
- Bell, H. N.; Rebernick, R. J.; Goyert, J.; Singhal, R.; Kuljanin, M.; Kerk, S. A.; Huang, W.; Das, N. K.; Andren, A.; Solanki, S. Reuterin in the Healthy Gut Microbiome Suppresses Colorectal Cancer Growth Through Altering Redox Balance. Cancer Cell 2022, 40(2), 185–200.e6. DOI: 10.1016/j.ccell.2021.12.001.
- Markowiak, P.; Śliżewska, K. Effects of Probiotics, Prebiotics, and Synbiotics on Human Health. Nutrients. 2017, 9(9), 1021. DOI: 10.3390/nu9091021.
- Abouloifa, H.; Khodaei, N.; Rokni, Y.; Karboune, S.; Brasca, M.; D’Hallewin, G.; Salah, R. B.; Saalaoui, E.; Asehraou, A. The Prebiotics (Fructo-Oligosaccharides and Xylo-Oligosaccharides) Modulate the Probiotic Properties of Lactiplantibacillus and Levilactobacillus Strains Isolated from Traditional Fermented Olive. World J. Microbiol. Biotechnol. 2020, 36(12), 1–12. DOI: 10.1007/s11274-020-02961-9.
- Bertin, Y.; Chaucheyras‐Durand, F.; Robbe‐Masselot, C.; Durand, A.; de La Foye, A.; Harel, J.; Cohen, P. S.; Conway, T.; Forano, E.; Martin, C. Carbohydrate Utilization by Enterohaemorrhagic E Scherichia Coli O 157: H 7 in Bovine Intestinal Content. Environ. Microbiol. 2013, 15(2), 610–622. DOI: 10.1111/1462-2920.12019.
- Ammar, E. M.; Wang, X.; Rao, C. V. Regulation of Metabolism in Escherichia coli During Growth on Mixtures of the Non-Glucose Sugars: Arabinose, Lactose, and Xylose. Sci. Rep. 2018, 8(1), 609. DOI: 10.1038/s41598-017-18704-0.
- Bren, A.; Park, J. O.; Towbin, B. D.; Dekel, E.; Rabinowitz, J. D.; Alon, U. Glucose Becomes One of the Worst Carbon Sources for E. Coli on Poor Nitrogen Sources Due to Suboptimal Levels of cAMP. Sci. Rep. 2016, 6(1), 24834. DOI: 10.1038/srep24834.