Abstract
A new high-performance liquid chromatography (HPLC) method is described for the determination of oxolinic acid and flumequine, with ultraviolet laser-induced fluorescence detection (UV-LIFD). Near-UV excitation at 325 nm was obtained by using an He/Cd laser. Data obtained using UV-LIFD and conventional fluorimetry (Xenon flash, λexc 325/ λem 365) are compared under the same chromatographic conditions, connecting in series both detectors, in terms of linearity, reproducibility and repeatability. The HPLC separation is carried out on a Synergi MAX-RP column with water–acetonitrile (2:1, v/v) adjusted at pH 2.5, with formic acid, as mobile phase and completed in less than 9 min. The detection limits of oxolinic acid and flumequine at a signal-to-noise ratio of 3 were 0.43 pg and 0.76 pg on column with UV-LIFD detection, making this method considerably more sensitive than traditional fluorescence detector (16.15 pg and 14.17 pg) having some obvious advantages.
En este trabajo proponemos un nuevo método de cromatografía líquida de alta eficacia para el análisis de ácido oxolínico y flumequina con detección por fluorescencia inducida por Láser. La excitación ultravioleta cercana a 325 nm se obtiene usando un laser HE/Cd. Los datos obtenidos usando esta excitación se compararon con los obtenidos por fluorescencia normal (Xenon flash, λexc 325/λem 365) en las mismas condiciones cromatográficas, conectando en serie los dos detectores, en términos de linearidad, reproducibilidad y repetibilidad. La separación por HPLC se llevó a cabo con una columna Synergi MAX-RP con una fase móvil agua/acetonitrilo (2:1, V/V) ajustada a pH 2.5 con ácido fórmico, completándose en menos de 9 min. Los límites de detección, para una señal/ruido de 3, fueron 0.43 pg y 0.76 pg en columna para oxolínico y flumequina respectivamente, haciendo este método considerablemente más sensible que el tradicional detector por fluorescencia (16.15 pg y 14.17 pg), lo que tiene ventajas obvias.
Palabras clave:
Introduction
Oxolinic acid (OA) and flumequine (FLU) are synthetic antibiotics in the quinolone group, and are broad-spectrum antibacterial agents used in human and veterinary medicine ().
Figure 1. Chemical structures of oxolinic acid and flumequine.
Figura 1. Estructuras químicas del ácido oxolínico y de la flumequina.
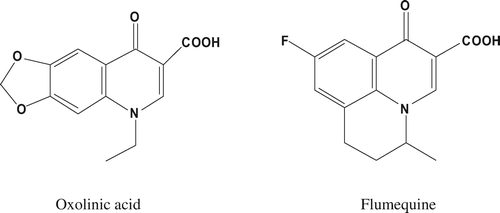
Quinolones act directly on the DNA gyrase, a type 2 topoisomerase involved in DNA replication, genetic recombination and DNA repair. They also inhibit topoisomerase IV. OA is a long-acting antibacterial agent, used orally in the treatment of urinary tract infections caused by susceptible gram-negative organisms. FLU is a first-generation broad spectrum acidic quinolone derivative with a fluorine atom substituted at the sixth-position fact that increases gyrase inhibition, often used in veterinarian medicine for the treatment of enteric infections.
In recent years, OA and FLU have been used for the treatment of infectious diseases in veterinary medicine, with a potential impact on human health. The World Health Organization has defined a list of “critically important drugs for human medicine” that require special risk assessment and management. Flumequine is included as critically important on this list (WHO, 1998). OA and FLU are subjected to regulation. The Maximum Residue Limit (MRL) in different animal species and target tissues was established according to EU legislation (European Commision, 2002).
Several analytical methods have been developed for the determination of OA and FLU. A extensive and recent review of quinolone residues in edible animal products (Hernández-Arteseros et al., Citation2002) shows that most methods (84%) are based in liquid chromatographic separations, which use fluorimetric detection in about 62% of the determinations. Also, gas chromatography, high-performance thin-layer chromatography, luminescence or inmunochemicals methods are used. Oral bioavailability, tissue distribution and depletion of flumequine in food producing animals were established recently by Anadón et al. (Citation2008)
The present work describes for the first time the analysis of OA and FLU using near UV laser-induced native fluorescence detection. This is the first time that high-performance laser-induced chromatography-laser-induced fluorescence detection (HPLC-LIFD) has been used for the determination of these compounds. Only capillary electrophoresis (CE) with laser-induced fluorescence (LIF) to determine moxifloxacin quinolone has been reported previously (Möller et al., Citation1998). In fact, LIF, coupled to CE, is one of the most popular detection methods, and has had a great impact as a tool in biomedical research, drug analysis, clinical and forensic practice (Couderc et al., Citation1998; Páez & Hernández, Citation2001).
Transitions in free cadmium atoms result in milliwatt emission at 325 nm in the near ultraviolet with an He-Cd laser. This light has characteristic properties which distinguish it from that produced by other sources: mainly beam-width, intensity, coherence and monochromaticity.
In the present study, the performance of LIFD and Xe-lamp as excitation sources in fluorescence detection after liquid chromatography for determination of OA and FLU is examined. It is particularly interesting because OA and FLU are native fluorescent compounds having maximum λexc at 325 nm and a laser line is available at this wavelength.
Materials and methods
Reagents and chemicals
FLU and OA (98% puriss) are supplied by Sigma (St. Louis, MO, USA), acetonitrile was purchased from Merck (Darmstadt, Germany). Formic acid 98–100% was from Riedel-de Haën (Seelze, Germany). Milli-Q organic free water was used (Millipore, Bedford, MA, USA). All reagents were of analytical grade.
Standards solutions were prepared by dissolving the compounds in aqueous NaOH 10 mM at a concentration of 100 mg ml−1. These solutions were stored at 4 °C in dark glass bottles and prepared fresh weekly. Standard working solutions were prepared each day by dilution with water of the stock solutions.
Liquid chromatographic
The HPLC system consisted of 980-PU pump (Jasco, Tokio, Japan), a sample injector model 7725 with 5 μl loop, (Rheodyne, Cotati, USA). Chromatographic separation was achieved on a 150 × 2.00 mm Synergi 4 m MAX-RP 80A, a reversed phase column from Phenomenex (Torrance, CA, USA). For each 10 injections, the column was washed with acetonitrile/water (80/20) at 0.3 ml min−1 for 5 min and then equilibrated with the mobile phase for 10 min before next injection.
The column was operated isocratically with a mobile phase consisting of a mixture of water–acetonitrile (2:1 v/v), adjusted at pH 2.5 with formic acid, at a flow rate of 0.3 ml min−1. The eluent was carefully degassed by filtration and vacuum/sonication.
System detectors
The HPLC system was coupled to a fluorescence detector and a laser-induced fluorescence detector connected in series for simultaneous analyses as shown in .
Figure 2. Scheme of HPLC and system detectors.
Figura 2. Esquema del sistema de HPLC con los detectores.
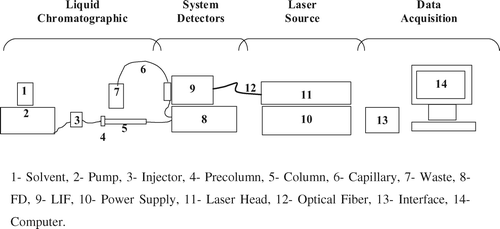
The fluorescence detector (FD) used a HP 1046A (Hewlett-Packard, Waldbronn, Germany), set to an excitation wavelength of 325 nm and an emission wavelength of 365 nm as suggested earlier (Horie et al., Citation1992; Munns et al., Citation1998; Pouliquen & Morvan, Citation2002).
Furthermore, other parameters were selected in the FD: signal amplification, flash frequency, and response time. To find the best signal amplification the PMT gain was raised stepwise from 11 up to 17; this function defines the voltage across the dynodes inside the photomultiplier. Finally, there was an improvement in signal-to-noise up to 15. Above 15, the noise increased proportionally to the signal, with no improvement in the appearance of the peak. The lamp flash frequency of 5 W/220 Hz has the lowest noise and therefore the highest sensitivity. Selecting the best response time can decrease the contribution of the interfering baseline noise to the signal. The data reduction interval was selected at 4000 ms. The LIF system consisted of a 325 nm He-Cd laser of 15 mW and High Voltage Power Supply LC500-220RC (Omnicrohome, Melles Griot Laser Group, Carlsbad, CA) coupled to a ZETALIF detector (Picometrics, Ramonville, France). Flexible Fused Silica Capillary Tubing with standard polyimide coating, 320 mm ID, 435 mm OD, and 18 mm of coating thickness (Galiza Analítica, Vigo, Spain) was connected to the output of the FD. On-column fluorescence detection is performed by removing a portion of polyimide coating from the capillary by burning. Also necessary was a microscope to adjust capillary and flow cell position. The fluorescence intensity was calibrated using a quinine sulfate hidrate solution (10−2 M) in sulfuric acid 50 mM as fluorescence calibrator solution. At the beginning of each work day, the capillary was washed with 0.1 M NaOH (2 min) and water (2 min). The ZETALIF detector was operated under following conditions: photomultiplier high voltage 570 V; rise time 0 sec; max. power 10 mW and with a fluorescence range of 2 Relative Fluorescence Units (R.F.U.).
External interfaces for the acquisition of data Hercule-Lite (JMBS Developements, Le Fontanil, France) were used, and chromatographic data were recorded and processed with Jasco-Borwin software.
Results and discussion
Chromatographic conditions
Liquid chromatography separation of quinolones is habitually achieved in reversed-phased columns, chiefly C18 or C8. The charge of the compound and stationary phase may be altered, depending on its ionizability and its pKa relative to the pH of the mobile phase, due to ion-exchange with residual silanols (Si-OH) on the support material. These reasons, and interactions such as hydrogen bonding, result in poor peak shape, variations in retention time and tailing peaks, using traditional C18 columns, overcoated for flumequine.
Most workers have used acid mobile phase conditions and the addition of modifiers in mobile phase was employed (Hernández-Arteseros et al., Citation2002). shows flumequine chromatograms using different columns and mobile phase.
Figure 3. Chromatograms obtained (a) with a Synergi 4 m MAX-RP (150 × 2.00 mm i.d.); mobile phase: 20 mM-H3PO4/ACN (2:1 v/v); flow rate: 0.3 ml min−1; (b) with a Luna C18(2) 5 m (150 × 4.6 mm i.d.); mobile phase: H2O/ACN (70:30 v/v), adjusted at pH 2.5 with formic acid; flow rate: 0.3 ml min−1; (c) with a Synergi 4 m MAX-RP (150 × 2.00 mm); mobile phase: H2O/ACN (2:1 v/v), adjusted at pH 2.5 with formic acid; flow rate: 0.3 ml min−1.
Figura 3. Cromatogramas obtenidos (a) con la columna Synergi 4 m MAX-RP (150 × 2.00 mm i.d.); fase móvil: 20 mM-H3PO4/ACN (2:1 v/v); flujo: 0.3 ml min−1; (b) with a Luna C18(2) 5 m (150 × 4.6 mm i.d.); fase móvil: H2O/ACN (70:30 v/v), ajustado a pH 2.5 conácido fórmico; flujo: 0.3 ml min−1; (c) con una columna Synergi 4 m MAX-RP (150 × 2.00 mm); fase móvil: H2O/ACN (2:1 v/v), ajustada a pH 2.5 con ácido fórmico; flujo: 0.3 ml min−1.
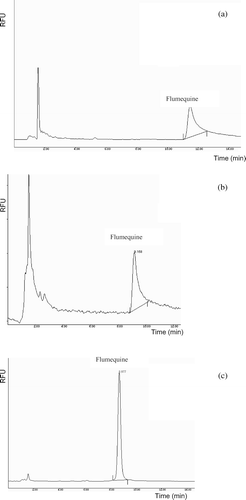
Finally, peak shape was somewhat improved with Synergi MAX-RP column and was operated isocratically with a mobile phase water–acetonitrile (2:1 v/v), adjusted at pH 2.5 with formic acid, which reduced peak tailing, at a flow rate of 0.3 ml min−1.
Conventional fluorescence vs. laser-induced fluorescence
A highly sensitive new HPLC method with near UV laser-induced native fluorescence detection for the analyses of oxolinic acid and flumequine is described and compared with conventional fluorescence detection based in Xenon flash lamp. This work demonstrates the first application of HPLC-LIFD for the analysis of oxolinic acid and flumequine.
It is clear that the sensitivity of a fluorescence detector depends on the minimum signal intensity that can be detected with a user selected S/N ratio. In fluorescence, a crucial characteristic is the fluorescence quantum yield (Φf) (1) defined as the ratio photons emitted (I f) to photons absorbed (I a) and this is given by:
Fluorescence becomes stronger as fluorescent quantum efficiency approaches 1.0. The relation between fluorescence intensity (F) and the amount of a component at low concentrations (c) is defined by the equation:
From this point of view, the insertion of LIF detection in liquid chromatography seems suitable. A previous article (van de Nesse et al., Citation1995) reviews the aspects that need to be considered when applying lasers instead of conventional lamps in fluorescence detection, such as Rayleigh and Raman scatter from the liquid chromatography eluent, background luminescence and laser light reflected and refracted phenomenons at the flow cell. In any case, we are in agreement with this review, that only a few authors have extensively compared their LIF results with data obtained using a conventional fluorescence detector under the same chromatographic conditions. Furthermore, most attention has been devoted to LIF as a detection system in capillary electrophoresis.
Traditionally, LIF-based detection has some limitations. The substance must show native fluorescence at available laser wavelength, and, if not, a previous chemical derivatization will be necessary to convert the analyte in fluorescent compound. In any case, there is a laser evolution technology very close to offering the broadest possible range of lasers compatible with analytical applications. Fluorescence derivatization of non or weakly fluorescent compounds into strong fluorescent derivatives is possible pre- or post-chromatographic elution, with specific reactive group selection and using an extensive number of fluorescent reagents.
Because fluorescence intensity is dependent on both path length and incident power, the use of lasers as an excitation source greatly improves the detection sensitivity. The detection limits reported here using continuous wave (CW) excitation in the UV part of spectrum provided by the compact helium-cadmium laser are superior to values reported by common fluorescence detection. The advantages offered by the LIF as a sensitive detection system suggest interesting perspectives when applying lasers instead of conventional lamps in fluorescence detection and when combined with liquid chromatography in the analysis of residues in terms of specificity and limits of detection, because a very sensitive technique is needed to detect chemical substances at low concentrations.
With the quinolones assayed in this work, we have obtained, at a signal-to-noise (S/N) ratio of 3, a limit of detection (LOD) for OA by LIF detection in aqueous solution was calculated to be 0.08 ng ml−1. With an injection volume of 5 μl, this value corresponds to 1.64 fmol (or 0.43 pg), enhancing 40 times the sensitivity in comparison with conventional fluorescence detection, which shows a LOD of 3.23 ng ml−1.
LIF detection for FLU is very nearly 19 times better than FD. The limit of quantification (LOQ) reported for FLU is 14.69 pg/injection by FD and 0.79 pg/injection by LIF. Summarised results are shown in .
Table 1. Studied ranges, LODs, LOQs and method precision of both quinolones with laser-induced fluorescence and conventional fluorescence detection methods.
Tabla 1. Rangos estudiados, LODs, LOQs y precisión para ambas quinolonas usando los métodos de fluorescencia inducida por láser y fluorescencia convencional.
The advantages offered by the LIF as a sensitive detection system suggest interesting perspectives when applying lasers instead of conventional lamps in fluorescence detection combined with liquid chromatography in the analysis of residues in terms of specificity and limits of detection.
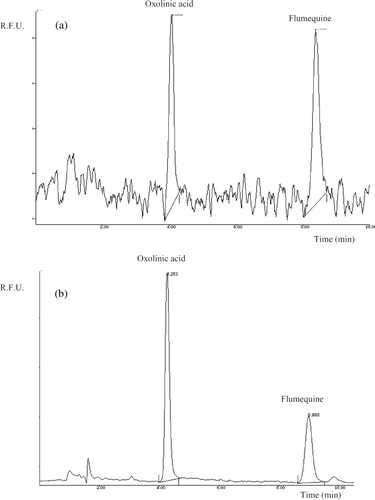
shows chromatograms with HPLC-FD and HPLC-LIFD for the same standard solution (25 ng ml−1) corresponding to 0.125 ng on column. The signal-to-noise ratio is important when measuring analytes in trace analysis. The chromatogram obtained from LIFD shows a more regular base line in comparison with FD, and it is also clear that the LIF detector has a higher response for the same concentration analytes under the same chromatographic conditions.
Figure 4. Chromatograms obtained from standard solution of 25 ng ml−1, corresponding to an injection of 0.125 ng on column for both quinolones by HPLC-FD (a) and HPLC-LIFD (b).
Figura 4. Cromatogramas obtenidos con una solución estandard de 25 ng ml−1, correspondiente a una inyección de 0.125 ng en columna para ambas quinolonas por HPLC-FD (a) y HPLC-LIFD (b).
Calibration curves for both quinolones by HPLC-FD and HPLC-LIFD were constructed in the same range (2–50 ng ml−1) injecting 0.01, 0.025, 0.05, 0.125, and 0.25 ng of OA and FLU. Detection responses were linear with good correlation coefficients (r). The linear regression equation was y = 28.157x + 0.0163 (r = 0.9999) for OA and y = 31.583x + 0.0113 (r = 0.9991) for FLU, by HPLC-FD. LIFD shows better sensitivity for OA. The linear calibration graphs were obtained in the same concentration range 2–50 ng ml−1. The linear regression equation and (r) were y = 295.41x + 0.0110 (r = 0.9998) for OA, and y = 161.54x + 0.014 (r = 0.9999) for FLU, by HPLC-LIFD.
The precision of the method was demonstrated by interday and intraday studies in all concentration ranges. Five replicate quality control samples at each concentration were assayed on the same day during three non-consecutive days. Within-day and day-to-day reproducibility were similar using both methods of detection. Expressed as the higher relative standard deviation (RSD) were found to be less than 4.4% and 1.5% for OA, 3.4% and 1.8% for FLU by FD, and 2.9% and 3.9% for OA, and 3.2% and 2.4% for FLU by LIF detection.
HPLC in conjunction with LIF detection is a powerful sensitive system that improves the analytical methods based on common fluorescent detection. It is our belief that in the near future studies on the LIF of native-fluorescent compounds or analytes derivatized with different fluorescent reagents will see a notable increase. After this first study, we are developing new methods for the detection of other quinolones and their metabolites which exhibit native fluorescence.
Acknowledgements
Xesús Feás acknowledges a scholarship within the program “Formación de Personal Investigador” from Ministerio de Ciencia y Tecnología, Spain, and Ana Carreira for technical collaboration.
References
- Anadón , A. , Martínez , M. A. , Martínez , M. , De La Cruz , C. , Díaz , M. J. and Martínez-Larrañaga , M. R. 2008 . Oral bioavailability, tissue distribution and depletion of flumequine in food producing animal, chicken for fattening . Food and Chemical Toxicology , 46 : 662 – 670 .
- Couderc , F. , Causse , E. and Bayle , C. 1998 . Drug analysis by capillary electrophoresis and laser-induced fluorescence . Electrophoresis , 19 : 2777 – 2790 .
- European Commision Regulation (EC) . N 1181/2002 of 1 July 2002 (OJ N L 172, 2.7.2002)
- Hernández-Arteseros , A. , Barbosa , J. , Compañó , R. and Prat , M. D. 2002 . Review on: Analysis of quinolone residues in edible animal products . Journal of Chromatography A , 945 : 1 – 24 .
- Horie , M. , Saito , K. , Nose , N. and Nakazawa , H. 1992 . Simultaneous determination of quinolone antibacterials in fish and meat by high performance liquid chromatography . Journal of Food Hygiene Society of Japan , 33 : 442 – 448 .
- Möller , J.-G. , Staß , H. , Heinig , R. and Blaschke , G. 1998 . Capillary electrophoresis with laser-induced fluorescence: A routine method to determine moxifloxacin in human body fluids in very small sample volumes . Journal of Chromatography B , 716 : 325 – 334 .
- Munns , R. K. , Turnipseed , S. B. , Pfenning , A. P. , Roybal , J. E. , Holland , D. C. Long , A. R. 1998 . Liquid chromatographic determination of flumequine, nalidixic acid, oxolinic acid, and piromidic acid residues in catfish (Ictalurus punctatus) . Journal of AOAC International , 81 : 825 – 826 .
- Páez , X. and Hernández , L. 2001 . Biomedical applications of capillary electrophoresis with laser-induced fluorescence detection . Biopharmaceutics and Drug Disposition , 22 : 273 – 289 .
- Pouliquen , H. and Morvan , M. L. 2002 . Determination of residues of oxolinic acid and flumequine in freeze-dried salmon muscle and skin by HPLC with fluorescence detection . Food Additives and Contamminants , 19 : 223 – 223 .
- Van de Nesse , R. J. , Velthorst , N. H. , Th Brinkman , U. A. and Gooijer , C. 1995 . Review on: Laser-induced fluorescence detection of native-fluorescent analytes in column liquid chromatography, a critical evaluation . Journal of Chromatography A , 704 : 1 – 25 .
- World Health Organization . 1998 . “ Use of quinolones in food animals and potential impact on human health ” . Report and proceedings of a WHO Meeting WHO/EMC/ZDI/98.12