
ABSTRACT
The quality of the preschool environment may affect preschooler's levels of physical activity and sedentary time. In this paper, we aimed to assess the quality of the preschool movement environment and associations between the movement environment and children's physical activity and sedentary time in Norwegian preschools. A sample of 71 departments within 46 preschools provided data on the Movement Environment Rating Scale (MOVERS). 794 children aged 3–5 years provided accelerometer data (ActiGraph GT3X+). Associations were examined using multivariate pattern analysis. Our results indicate that the movement environment is of minimal quality in Norwegian preschools. We found positive associations for light and moderate intensity physical activity and negative associations for sedentary time with the overall MOVERS score, as well as for several items and sub-scales. Our findings suggest that higher quality of the preschool movement environment is associated with more movement and less sedentary time.
Introduction
Physical activity (PA) is important for normal growth and development during childhood and has been positively associated with cardiometabolic and psychosocial health, cardiovascular fitness, bone and skeletal health, as well as motor and cognitive development in preschoolers (Carson et al. Citation2017; Veldman et al. Citation2021). Reducing screen time and sedentary behaviors may also play a role for health promotion and disease prevention in children, though the importance of sedentary time (SED) independent of PA is unclear (Cliff et al. Citation2016; Poitras et al. Citation2017). PA and SED are known to track during childhood and into adulthood (Jones et al. Citation2013; Telama et al. Citation2014), which means establishing healthy behaviors early in life may be an effective public health strategy.
In Norway, preschools have high attendance rates (97% of children aged 3–5 years), and children spend a large proportion of the day in the preschool setting (SSB Citation2021). The preschool setting is therefore of great importance for children's PA (Nilsen et al. Citation2019). Internationally, levels of PA during preschool hours are highly variable (O’Brien et al. Citation2018). This variation can partly be explained by methodological variation between studies, but it may also result from differences in the quality of the movement environment between preschools (Finn, Johannsen, and Specker Citation2002; Pate et al. Citation2004). As a result, there is a growing number of studies investigating how the quality of the preschool environment can affect children's PA and SED (Bower et al. Citation2008; Dowda et al. Citation2009; Johannessen et al. Citation2020; Tandon et al. Citation2020; Zhang et al. Citation2021).
The quality of the preschool environment is multidimensional and can be categorized into structure and process quality (Archer and Siraj Citation2017). Structure quality refers to the resources used in the provision of care and includes, for example, features of indoor and outdoor spaces, presence of play equipment, and organizational structures such as educator qualifications, written policies, and time spent outdoors and in PA (Tonge, Jones, and Okely Citation2015; Zhang et al. Citation2021). Process quality refers to social, emotional, and physical educator-child and peer-child interactions while being involved in PA, play, and other activities (Archer and Siraj Citation2017).
Several observation instruments have been developed to assess the quality of the preschool environment, for example, ‘The Early Childhood Environment Rating Scale – Revised (ECERS-R)’ (Harms, Clifford, and Cryer Citation2005), ‘Assessing Quality in Early Childhood Education and Care: Sustained Shared Thinking and Emotional Well-being (SSTEW)’ (Siraj, Kingston, and Melhuish Citation2015) and ‘Environment and Policy Assessment and Observation (EPAO)’ (Ward et al. Citation2008). However, ECERS-R and SSTEW mainly focus on children's development in the social/emotional or cognitive/language domains and EPAO does not assess the quality of educator-child interaction or aspects regarding motor skills (Kazmierska-Kowalewska et al. Citation2021). Moreover, findings for associations between ECERS-R and PA has been conflicting: While ECERS-R was positively associated with children's MVPA in a study conducted in the USA (Dowda et al. Citation2009), it was negatively associated with children's MVPA in a study conducted in Norway (Johannessen et al. Citation2020).
With these limitations in mind, a new observational instrument, The Movement Environment Rating Scale (MOVERS) (Archer and Siraj Citation2017), which addresses both structure and process quality of the movement environment, has been developed. To our knowledge, this instrument has not been used to assess the quality of the movement environment in Norwegian preschools and only one study has investigated associations between PA and preschool environmental quality using this instrument (Zhang et al. Citation2021). This study found modest quality and positive associations for the overall score and the sub-scales ‘Curriculum, environment, and resources for physical development’ and ‘Pedagogy for physical development’ with children's moderate-to-vigorous PA (MVPA) (Zhang et al. Citation2021), and negative associations for these sub-scales with SED. However, the study included a relatively small sample of children (n = 118), limiting generalizability of the findings.
Against this background, there is a need for more knowledge about the movement quality of Norwegian preschools and a better understanding of how both structure and process quality of the preschool environment affect preschoolers’ PA and SED in different contexts. The main aim of the current study was therefore to comprehensively examine associations between preschool environmental quality using MOVERS and children's intensity-specific PA and SED.
Materials and methods
Study design and participants
Active Learning Norwegian Preschool(er)s (ACTNOW) is a large cluster randomized controlled trial of staff professional development to promote PA, motor skills, cognition, and learning in preschoolers, conducted in the western part of Norway 2019–2022. Details about the study design is described elsewhere (Aadland et al., Citation2020c). The present study used cross-sectional baseline data from ACTNOW where a total of 1265 children enrolled in 104 departments (i.e. rooms) within 46 preschools were eligible for analysis. We provided oral and written information about the study to parents of all participating children and all parents gave their written consent prior to testing. We informed all preschools about the study and they also agreed to participate prior to testing. Relevant procedures were sought explained to all children given their levels of understanding. All procedures and methods are in agreement with the ethical guidelines outlined by the World Medical Association's Declaration of Helsinki and its subsequent revisions. ACTNOW was approved by the institutional ethics committee and the Norwegian Centre for Research Data (reference number 248220), and was registered in clinicaltrials.gov 7 August 2019 (identifier NCT04048967).
Measures
PA was measured objectively using the ActiGraph GT3X+ accelerometer over seven consecutive days. This accelerometer is the most used and validated instrument in the field (O’Brien et al. Citation2018). Children were instructed to wear the accelerometer on the right hip throughout the whole day. Accelerometer files were analyzed using the KineSoft analytical software version 3.3.80 (KineSoft, Loughborough, UK) aggregated at 1-second epochs to correctly capture short burst of PA given the sporadic activity pattern of this age group (Cain et al. Citation2013; Aadland, Andersen et al., Citation2020a). Consecutive periods of zero counts over ≥20 minutes were defined as non-wear time (Esliger et al. Citation2005). To examine associations between preschool quality and children's preschool PA levels, PA data was restricted to care hours (08:30–15:30) on weekdays, with a wear-time criterion of ≥5 hours/day and ≥3 days. Results were reported for total PA (counts per minute (cpm)) and for minutes spent sedentary (<100 cpm), in light PA (LPA, 100–2295 cpm), in moderate PA (MPA, 2296-4011 cpm), in vigorous PA (VPA, ≥4012 cpm), and in MVPA (≥2296 cpm) (Evenson et al. Citation2008).
The preschools’ movement environment quality and educational practice were examined using MOVERS (Archer and Siraj Citation2017). The observation was conducted by three trained researchers. Inter-rater reliability was 0.82. For assessing MOVERS in ACTNOW, the researchers spent a whole day (08:30-15:00) in each department, followed by a discussion with an educational leader. The observation was supplemented by a review of documentation and written plans. MOVERS consists of 11 items that form four sub-scales () relating to the overall structure and process quality of the preschool department. The items are scored from 1 to 7, where 1 = inadequate, 3 = minimal, 5 = good, and 7 = excellent, similar to other environment ratings scales, for example, ECERS-R. Each item has several indicators that describe practice. Achieving a score for an item requires meeting all indicators at this level and lower. For example, a score of 5 is credited when all indicators at level 1 are marked as NO, all indicators at level 3 are marked as YES and all indicators at level 5 are marked as YES. The observation starts with an evaluation of level 1 and each level is then scored systematically. Sub-scales were calculated as the mean of their items. Further information about the scoring in MOVERS is presented elsewhere (Archer and Siraj Citation2017). The movement environment was assessed in all preschools. If a preschool had multiple departments, only departments with ≥10 children enrolled in ACTNOW were assessed.
We measured children's body weight to the nearest 0.1 kg using an electronic scale (Seca 899, SECA GmbH, Hamburg, Germany) and height to the nearest 0.1 cm using a portable stadiometer (Seca 217, SECA GmbH, Hamburg, Germany). We calculated body mass index (BMI, kg/m2) and thereafter classified children as normal weight (including underweight), overweight, or obese according to the criteria suggested by Cole et al. (Citation2000). We reported parental educational level as the highest level of the mother or father (≤high school, university <4 years, university ≥4 years).
Statistical analysis
Characteristics of children were reported as means and standard deviations (SD) or frequencies. MOVERS scores were described as means, SDs, and minimum-maximum values, and their interrelation were determined using Pearson correlations (r). Due to multicollinearity of the MOVERS items and sub-scales, associations between MOVERS (independent variables) and children's PA and SED (dependent variables) were examined using multivariate pattern analysis. Partial least squares (PLS) regression analyzes (Wold et al. Citation1984) can model any number of collinear explanatory variables by decomposing these variables into a few orthogonal PLS components that maximizes the covariance with the outcome variable (Wold et al. Citation1984). We used Monte Carlo resampling (Kvalheim et al. Citation2018) with 1000 repetitions to validate the numbers of PLS components in the models, by randomly using 50% of the subjects in an external validation dataset. The importance of each MOVERS item and sub-scale in the multivariate space was shown using target projection (Kvalheim and Karstang Citation1989; Rajalahti and Kvalheim Citation2011) followed by reporting of multivariate correlation coefficients with 99% confidence intervals (CIs) (Rajalahti et al. Citation2009a; Rajalahti et al. Citation2009b; Aadland et al. Citation2019). We adjusted SED and PA for sex, age, BMI, parental education, and accelerometer wear time prior to using these variables in PLS regression by obtaining residuals from linear regression models (i.e. we derived residualized scores for SED and PA by including these variables as outcomes and covariates as explanatory variables in these models). We performed multivariate pattern analyzes using Sirius version 11.5 (Pattern Recognition Systems AS, Bergen, Norway). Linear mixed models were used to determine intra-class correlations (ICC) for SED and PA across departments (variance explained by departments/total variance) using SPSS version 27 (IBM SPSS Statistics for Windows, Armonk, NY: IBM Corp., United States).
Results
Description of the sample
The movement environment was assessed for 94 of the 104 departments included in ACTNOW, of which we obtained valid data on all items for 71 departments. Missing item scores are due to a lack of information from some educators. In total, 902 children were enrolled in these 71 departments, of whom 827 children provided valid accelerometer data and 749 children provided valid data on all covariates. Thus, we included 71 departments and 749 children () in the analysis.
Table 1. Children's characteristics.
MOVERS scores were generally low, with mean scores for all sub-scales around ‘minimal quality’ (range of mean values 2.2–3.5) (). The highest score was found for the sub-scale ‘Curriculum, environment and resources for physical development’. Within this sub-scale the items ‘Gross motor skills’ and ‘Arranging environmental space to promote PA’ had the highest scores. The scores on each item ranged from 1 to 7, except for item 9, indicating high variation in movement environment quality between departments. Intercorrelations between items (r = 0.00–0.61) and sub-scales (r = 0.23–0.68) are shown in Supplemental Table 1.
Table 2. Departments’ MOVERS scores.
Associations between MOVERS and children’s PA
Department explained 14.6–17.6% of the variation in children's intensity-specific PA and SED levels (ICC = 0.164, 0.158, 0.176, 0.176, 0.146, and 0.157 for CPM, SED, LPA, MPA, VPA, and MVPA, respectively). MOVERS scores were significantly associated with SED, LPA, and MPA (explained variances = 4.71, 6.22, and 6.97%, respectively), whereas associations for other PA variables were non-significant. Thus, MOVERS explained approximately one-third of the children's SED, LPA, and MPA explained by the departments.
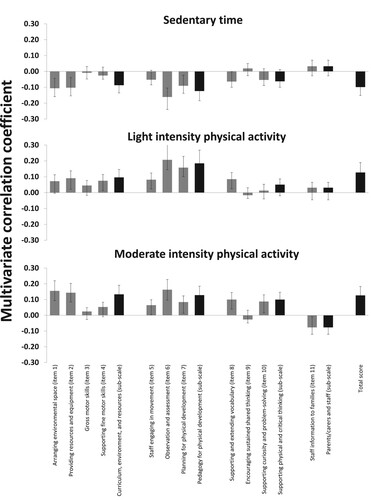
Association patterns for MOVERS with PA and SED derived from the significant regression models are shown in . Associations were generally negative for SED and positive for LPA and MPA, including significant negative (SED) and positive associations (LPA, MPA) with the overall MOVERS score. The strongest and most consistent associations were found for the ‘Pedagogy for physical development’ sub-scale, where all items were positively associated with LPA and MPA, and all items, except ‘Staff engage in movement with children’, were negatively associated with SED. For the sub-scale ‘Curriculum, environment and resources for physical development’, associations were negative for SED and positive for LPA and MPA. The strongest (positive) associations were found for the items ‘Arranging environmental space to promote PA’ and ‘Providing resources including portable and/or fixed equipment’ with MPA, whereas associations for other items were non-significant except a positive association for ‘Body movement to support fine motor skills’ with LPA. Associations for the sub-scale ‘Supporting physical and critical thinking’ were positive for MPA but non-significant for SED and LPA. Associations for the ‘Parents/carers and staff’ sub-scale/item were generally weak and non-significant, though a significant negative association was indicated for MPA.
Figure 1. Multivariate association patterns for the preschool movement environment with physical activity and sedentary time. Results are reported as multivariate correlation coefficients that for each outcome are derived from a joint model including all MOVERS items and sub-scales. Multivariate correlation coefficients can be interpreted equivalent to bivariate correlations, though they are derived from a multivariate model. Error bars are 99% CIs.
Discussion
The present study assessed the quality of the movement environment in Norwegian preschools by using MOVERS, and examined associations between MOVERS and children's accelerometer-determined PA and SED. Generally, the movement environment was found to be of minimal quality. The overall MOVERS score was positively associated with LPA and MPA and negatively associated with SED. The strongest positive associations were seen between the sub-scale ‘Pedagogy for physical development’ and children's LPA and MPA. This sub-scale was also negatively associated with SED.
According to the MOVERS instrument, the mean overall score and mean sub-scale scores on MOVERS indicate that the movement environment generally is of ‘minimal’ quality (score of 3) in Norwegian preschools. Our mean overall score was 2.7, whereas sub-scales ranged from 2.2 to 3.5. These scores are somewhat lower than scores observed in previous studies using MOVERS (Kazmierska-Kowalewska et al. Citation2021; Zhang et al. Citation2021) although all three studies rate the movement environment to be of minimal quality. An Australian study found overall MOVERS scores of 3.15 and 3.16 on two repeated observations (Kazmierska-Kowalewska et al. Citation2021). A Canadian study reported an overall score of 3.39, with sub-scale scores ranging from 2.74 to 4.11 (Zhang et al. Citation2021). To be rated higher than minimal quality on the sub-scales, deliberate practices by educators are required (Kazmierska-Kowalewska et al. Citation2021; Archer and Siraj Citation2017). Hence, according to MOVERS, there is a potential to improve the movement environment in preschools through a more deliberate pedagogy regarding physically active play. However, when visiting preschools, we observed that educators faced several challenges regarding their capacity to engage in deliberate play with children. For example, organization of breaks, meetings, or planning time for educators were often scheduled after lunch, resulting in few educators being available for children during the part of the day where children primarily were outdoors and had the best opportunities for PA. Furthermore, educators revealed that staff, primarily assistants (staff without teacher education), did not feel competent to facilitate PA indoors or outdoors. Hence, some staff members may intentionally avoid initiation and participation in PA. This is in line with the study by Copeland et al. (Citation2012), reporting that educators’ personal attitudes and low self-efficacy toward delivering PA might be barriers for children's PA opportunities. The high number of assistants, and thus lack of qualified educators, in Norwegian preschools (>50% of staff) (The Norwegian Directorate of Education Citation2016) may also limit the quality of child-educator interactions, and may partly explain the relatively low MOVERS scores in general.
It should be noted that although departments obtained low scores, some indicators of higher quality were fulfilled. Hence, the scoring procedure might have led to an impression of lower quality than was the case. Notably, the validity of the standard scoring procedure of rating scales similar to the MOVERS, for example, ECERS-R, has been discussed with respect to its structure and ordering of quality indicators (Gordon et al. Citation2015). Furthermore, as MOVERS is developed in preschool contexts different from the Norwegian, some indicators may not be culturally relevant in Norwegian preschools. For example, Norwegian preschools spend much time outdoors (Ylvisåker et al. Citation2022) and primarily facilitate physically active play while being outdoors, resulting in less focus on physical active play indoors and thus relatively low scores related to indoor movement play.
In our study, the strongest associations between MOVERS and intensities of PA (LPA and MPA) and SED were observed for the sub-scale ‘Pedagogy for physical development’, which mainly concerns indicators of process quality (educator engagement, observation, and planning). Partly in line with our findings, Zhang et al. (Citation2021) found associations for this sub-scale with MVPA and SED, but not with LPA. However, both epoch and cut points differ between these studies, possibly explaining part of the discrepancy. We used 1 s epoch and the cut points by Evenson et al. (Citation2008) (i.e. MVPA ≥ 2296 cpm), whereas Zhang et al. (Citation2021) used 15 s epoch and the cut points by Pate et al. (Citation2006) (i.e. MVPA ≥ 1680 cpm). This difference might explain a positive association for LPA in our study but not by Zhang et al. (Citation2021) given that part of the activity captured as LPA in the present study was captured as MPA by Zhang et al. (Citation2021). Nevertheless, the positive associations for PA with the ‘Pedagogy for physical development’ sub-scale from these two studies highlight the importance of educators promoting children's PA. This sub-scale includes, for example, information about how the educators engage in movement activities, how written plans are used to facilitate PA, or how the educators use observation as a tool to improve children's movement opportunities (Archer and Siraj Citation2017). Our findings might also support the hypothesis by Tonge, Jones, and Okely (Citation2015), postulating that educators can influence children's PA through engagement, creativity, and role modeling during physically active play. Recent studies also suggest that educators’ levels of PA and SED can have a positive influence on preschoolers PA levels (Carson et al. Citation2020; Fossdal et al. Citation2018; Tonge, Jones, and Okely Citation2021). The importance of educators’ involvement is also evident in the study by Copeland et al. (Citation2012), indicating that children could have different movement experiences even within the same environment, based on the beliefs, creativity, and level of engagement of the educators.
Both our study and the study by Zhang et al. (Citation2021) found positive associations between PA and the sub-scale ‘Curriculum, environment and resources for physical development’. As for the previous sub-scale, we found positive associations for this sub-scale with LPA and MPA (and negative associations with SED), whereas Zhang et al. (Citation2021) found a positive association with MVPA (and a negative association with SED). This sub-scale includes criteria regarding structure quality elements, which also previously have been associated with higher levels of MVPA, such as presence of an outdoor environment, larger play space and time spent outdoors (Johannessen et al. Citation2020; Tandon et al. Citation2018; Tonge, Jones, and Okely Citation2015; Truelove et al. Citation2018). These findings may be explained by opportunities to participate in unstructured free play involving running, jumping, and other gross motor activities of moderate to vigorous intensities outdoors (Tremblay et al. Citation2015). To provide children unstructured free play opportunities outdoors is an important part of the Norwegian framework plan (curriculum) (The Norwegian Directorate for Education and Training Citation2017) and highly valued by Norwegian preschools, which spend much time outdoors during all seasons (Ulset et al. Citation2017; Ylvisåker et al. Citation2022). However, in MOVERS, outdoor space, environment, and time are only included in some few indicators within the items construing the much broader sub-scale, and the lack of associations for this sub-scale with MVPA might be explained by other indicators. For example, a higher rating on the sub-scale requires that the educators integrate curriculum content with PA. As such, unstructured free play outdoors does not mean that a department achieve good or excellent quality on this sub-scale since educators’ roles and actions are essential for the quality of the outdoor time. Consistent with this point, Alhassan et al. (Citation2013) found that structured outdoor time increased children's PA levels more than unstructured free play. However, a study by Kallestad and Ødegaard (Citation2013) showed that only 20% of children's activities in Norwegian preschools were planned and that the planned subject areas primarily were art, culture, and creativity, and minimally involved PA. Kallestad and Ødegaard (Citation2013) also observed that educators mostly had a passive and observational role with regard to children's activities. Findings by Johannessen et al. (Citation2020) indicate that when educator-child interactions occur, these often hinder rather than facilitate PA through restricting risky or rough and tumble play. Johannessen et al. (Citation2020) investigated associations between the ECERS-R scale and children's MVPA among 30 Norwegian preschool departments and observed consistent negative associations for safety practices and supervision of children in gross motor activities with outdoor time and MVPA. Together, these findings suggest that with respect to promotion of PA in preschool, prevailing pedagogical practices and educator-child interactions should be focused toward deliberate engagement in and facilitation of movement play, rather than observation and restriction of such activities to avoid potential hazards.
The final two sub-scales were only associated with MPA, where the sub-scale ‘Supporting physical activity and critical thinking’ was positively associated and the sub-scale ‘Parents/carers and staff’ was negatively associated. A possible explanation for these weaker associations is that these subscales are more distant to PA and SED as measured by accelerometry. Regarding the weak association between MPA and critical thinking, spending time on movement vocabulary, communication, curiosity, and problem-solving may as well detract from time spent in higher intensity PA as well as increase it, but irrespective of this association support children's development. Hypothetically, if educators spend time on information to parents when picking up their child, this might also detract from time educators are involved in children's movement activities. Such associations were not found by Zhang et al. (Citation2021) and need verification by future studies. In contrast to Zhang et al. (Citation2021), we did not find any associations with MVPA or VPA. Although we lack a good explanation for this finding, it may suggest that educators should promote and deliberately engage in PA of higher intensities with children.
Strengths and limitations
The main strengths of this study are the objective measurement of PA and SED and the use of a preschool environment rating scale that provide a comprehensive measure of both structure and process environmental quality relating to children's movement opportunities. Further strengths are the large sample of children and preschool departments included and the use of an analytic approach making it possible to analyze associations of the whole MOVERS scale with PA and SED. Given the moderate to strong associations between the different MOVERS items and sub-scales, using multivariate pattern analysis that can handle a high number of multicollinear explanatory variables (Wold et al. Citation1984) provide a comprehensive description of the joint association patterns.
Limitations of the study are the cross-sectional design, which precludes conclusions regarding causality, and well-known limitations by accelerometry (Cain et al. Citation2013). The accelerometer does not provide any information about the type of PA, and activities such as cycling and activities involving upper-body movement are challenging to capture correctly. As mentioned above, methodological challenges relating to the choice of intensity cut points or other accelerometer settings may have influenced the results. Furthermore, children's PA levels were assessed over 5 weekdays but vary over time (Aadland et al., Citation2020bb). Although MOVERS has shown excellent test-retest reliability (Kazmierska-Kowalewska et al. Citation2021) some variability will also be expected in environment quality scores over time. For several days of observation, some educators were on sick leave or were not present of other reasons, which likely limited the educators’ capacity to initiate and facilitate PA, or the use of temporary workers may have led to atypical practices being assessed. Since monitoring of PA and SED and observation of environmental quality was completed over a short period of time but not necessarily the same days, such measurement error of MOVERS scores and/or PA levels will attenuate associations and bias associations towards the null hypothesis (Hutcheon, Chiolero, and Hanley Citation2010).
Conclusion
This study has shown that educators have a unique opportunity to facilitate PA in the preschool arena by, for example, engaging in physical active play, use observation and assessments to provide better movement opportunities, use available resources to promote PA, and arranging movement activities that include all preschoolers. The present study also suggests that structure quality of the preschool environment such as access to indoor and outdoor spaces, access to fixed and portable equipment that promote PA, and planning for physical development indoors and outdoors are important for preschooler's movement opportunities. Development of pedagogical practices that support a favorable movement environment may be achieved through education and professional development and may be a sustainable long-term solution to promote more PA of higher quality in preschools.
Supplemental Material
Download PDF (116.1 KB)Acknowledgements
We thank all participating children, parents, and preschool staff for their contribution to the study and their excellent cooperation during the data collection. We also thank colleagues and students at the Western Norway University of Applied Sciences as well as the ACTNOW study group for making this research possible.
Disclosure statement
No potential conflict of interest was reported by the authors.
Additional information
Funding
References
- Aadland, E., L. B. Andersen, S. A. Anderssen, G. K. Resaland, and O. M. Kvalheim. 2020a. “Accelerometer Epoch Setting is Decisive for Associations Between Physical Activity and Metabolic Health in Children.” Journal of Sports Sciences 38 (3): 256–263. doi:10.1080/02640414.2019.1693320.
- Aadland, E., L. B. Andersen, G. K. Resaland, and O. M. Kvalheim. 2019. “Interpretation of Multivariate Association Patterns Between Multicollinear Physical Activity Accelerometry Data and Cardiometabolic Health in Children—A Tutorial.” Metabolites 9 (7): 129. https://www.mdpi.com/2218-1989/9/7/129.
- Aadland, E., A. K. O. Nilsen, E. Ylvisåker, K. Johannessen, and S. A. Anderssen. 2020b. “Reproducibility of Objectively Measured Physical Activity: Reconsideration Needed.” Journal of Sports Sciences 38 (10): 1132–1139. doi:10.1080/02640414.2020.1743054.
- Aadland, E., H. E. Tjomsland, K. Johannessen, A. K. O. Nilsen, G. K. Resaland, Ø Glosvik, O. Lykkebø, et al. 2020c. “Active Learning Norwegian Preschool(er)s (ACTNOW) – Design of a Cluster Randomized Controlled Trial of Staff Professional Development to Promote Physical Activity, Motor Skills, and Cognition in Preschoolers.” Frontiers in Psychology 11: 1382–1382. doi:10.3389/fpsyg.2020.01382.
- Alhassan, S., O. Nwaokelemeh, K. Lyden, T. Goldsby, and A. Mendoza. 2013. “A Pilot Study to Examine the Effect of Additional Structured Outdoor Playtime on Preschoolers’ Physical Activity Levels.” Child Care in Practice 19 (1): 23–35. doi:10.1080/13575279.2012.712034.
- Archer, C., and I. Siraj. 2017. Movement Environment Rating Scale (MOVERS) for 2–6-Year-Olds Provision: Improving Physical Development Through Movement and Physical Activity. London: Trentham Book.
- Bower, J. K. M., D. P. Hales, D. F. Tate, D. A. Rubin, S. E. Benjamin, and D. S. Ward. 2008. “The Childcare Environment and Children’s Physical Activity.” American Journal of Preventive Medicine 34 (1): 23–29. doi:10.1016/j.amepre.2007.09.022.
- Cain, K. L., J. F. Sallis, T. L. Conway, D. Van Dyck, and L. Calhoon. 2013. “Using Accelerometers in Youth Physical Activity Studies: A Review of Methods.” Journal of Physical Activity & Health 10 (3): 437–450. doi:10.1123/jpah.10.3.437.
- Carson, V., K. B. Adamo, N. Ogden, G. S. Goldfield, A. D. Okely, N. Kuzik, M. Crozier, S. Hunter, and M. Predy. 2020. “Sedentary Time and Physical Activity Associations Between Child Care Educators and Children.” American Journal of Preventive Medicine 58 (4): e105–e111. doi:10.1016/j.amepre.2019.11.016.
- Carson, V., E.-Y. Lee, L. Hewitt, C. Jennings, S. Hunter, N. Kuzik, J. A. Stearns, et al. 2017. “Systematic Review of the Relationships Between Physical Activity and Health Indicators in the Early Years (0-4 Years).” BMC Public Health 17 (Suppl 5): 854–854. doi:10.1186/s12889-017-4860-0.
- Cliff, D. P., K. D. Hesketh, S. A. Vella, T. Hinkley, M. D. Tsiros, N. D. Ridgers, A. Carver, et al. 2016. “Objectively Measured Sedentary Behaviour and Health and Development in Children and Adolescents: Systematic Review and Meta-Analysis.” Obesity Reviews 17 (4): 330–344. doi:10.1111/obr.12371.
- Cole, T. J., M. C. Bellizzi, K. M. Flegal, and W. H. Dietz. 2000. “Establishing a Standard Definition for Child Overweight and Obesity Worldwide: International Survey.” British Medical Journal 320 (7244): 1240–1243. doi:10.1136/bmj.320.7244.1240.
- Copeland, K. A., C. A. Kendeigh, B. E. Saelens, H. J. Kalkwarf, and S. N. Sherman. 2012. “Physical Activity in Child-Care Centers: Do Teachers Hold the key to the Playground?” Health Education Research 27 (1): 81–100. doi:10.1093/her/cyr038.
- Dowda, M., W. H. Brown, K. L. McIver, K. A. Pfeiffer, J. R. O’Neill, C. L. Addy, and R. R. Pate. 2009. “Policies and Characteristics of the Preschool Environment and Physical Activity of Young Children.” Pediatrics 123 (2): e261–e266. doi:10.1542/peds.2008-2498.
- Esliger, D. W., J. L. Copeland, J. D. Barnes, and M. S. Tremblay. 2005. “Standardizing and Optimizing the Use of Accelerometer Data for Free-Living Physical Activity Monitoring.” Journal of Physical Activity & Health 2 (3): 366–383. doi:10.1123/jpah.2.3.366.
- Evenson, K. R., D. J. Catellier, K. Gill, K. S. Ondrak, and R. G. McMurray. 2008. “Calibration of two Objective Measures of Physical Activity for Children.” Journal of Sports Sciences 26 (14): 1557–1565. Article Pii 906177578. doi:10.1080/02640410802334196.
- Finn, K., N. Johannsen, and B. Specker. 2002. “Factors Associated with Physical Activity in Preschool Children.” Journal of Pediatrics 140 (1): 81–85. doi:10.1067/mpd.2002.120693.
- Fossdal, T. S., K. Kippe, B. H. Handegård, and P. Lagestad. 2018. ““Oh oobe doo, I wanna be like you” Associations Between Physical Activity of Preschool Staff and Preschool Children.” PLoS One 13 (11): e0208001. doi:10.1371/journal.pone.0208001.
- Gordon, R. A., K. G. Hofer, K. A. Fujimoto, N. Risk, R. Kaestner, and S. Korenman. 2015. “Identifying High-Quality Preschool Programs: New Evidence on the Validity of the Early Childhood Environment Rating Scale-Revised (ECERS-R) in Relation to School Readiness Goals.” Early Education and Development 26 (8): 1086–1110. doi:10.1080/10409289.2015.1036348.
- Harms, T., R. Clifford, and D. Cryer. 2005. Early Childhood Environment Rating Scale (Rev. ed.). New York: Teacher College Press.
- Hutcheon, J. A., A. Chiolero, and J. A. Hanley. 2010. “Random Measurement Error and Regression Dilution Bias.” BMJ 340: c2289. doi:10.1136/bmj.c2289.
- Johannessen, K., E. Bjørnestad, A. K. O. Nilsen, E. Ylvisåker, M. Nornes-Nymark, M. Engeseter, L. Pedersen, and E. Aadland. 2020. “Associations for Preschool Environmental Quality with Outdoor Time and Moderate-to-Vigorous Physical Activity in Norwegian Preschools.” Journal for Research in Arts and Sports Education 4(2): 7–25. doi:10.23865/jased.v4.2485.
- Jones, R. A., T. Hinkley, A. D. Okely, and J. Salmon. 2013. “Tracking Physical Activity and Sedentary Behavior in Childhood: A Systematic Review.” American Journal of Preventive Medicine 44 (6): 651–658. doi:10.1016/j.amepre.2013.03.001.
- Kallestad, J. H., and E. E. Ødegaard. 2013. “Children’s Activities in Norwegian Kindergartens. Part 1: An Overall Picture.” Cultural-Historical Psychology 9 (4): 74–82.
- Kazmierska-Kowalewska, K. M., A. D. Okely, I. Siraj, C. Archer, and R. A. Jones. 2021. “A Validation and Reliability Study of the Movement Environmental Rating Scale (MOVERS).” European Early Childhood Education Research Journal 29 (5): 733–746. doi:10.1080/1350293X.2021.1968464.
- Kvalheim, O. M., R. Arneberg, B. Grung, and T. Rajalahti. 2018. “Determination of Optimum Number of Components in Partial Least Squares Regression from Distributions of the Root-Mean-Squared Error Obtained by Monte Carlo Resampling.” Journal of Chemometrics, doi:10.1002/cem.2993.
- Kvalheim, O. M., and T. V. Karstang. 1989. “Interpretation of Latent-Variable Regression-Models.” Chemometrics and Intelligent Laboratory Systems 7 (1-2): 39–51. doi:10.1016/0169-7439(89)80110-8.
- Nilsen, A. K. O., S. A. Anderssen, E. Ylvisaaker, K. Johannessen, and E. Aadland. 2019. “Physical Activity among Norwegian Preschoolers Varies by Sex, Age, and Season.” Scandinavian Journal of Medicine & Science in Sports 29 (6): 862–873. doi:10.1111/sms.13405.
- The Norwegian Directorate for Education and Training. 2017. Framework Plan for Kindergartens. https://www.udir.no/globalassets/filer/barnehage/rammeplan/rammeplan-for-barnehagen-bokmal 2017.pdf.
- The Norwegian Directorate of Education. 2016. Statistikkportalen. https://www.udir.no/tall-og-forskning/statistikk/statistikk-barnehage/.
- O’Brien, K. T., L. M. Vanderloo, B. A. Bruijns, S. Truelove, and P. Tucker. 2018. “Physical Activity and Sedentary Time Among Preschoolers in Centre-Based Childcare: A Systematic Review 11 Medical and Health Sciences 1117 Public Health and Health Services.” The International Journal of Behavioral Nutrition and Physical Activity 15 (1): 117. doi:10.1186/s12966-018-0745-6.
- Pate, R. R., M. J. Almeida, K. L. McIver, K. A. Pfeiffer, and M. Dowda. 2006. “Validation and Calibration of an Accelerometer in Preschool Children.” Obesity (Silver Spring) 14 (11): 2000–2006. doi:10.1038/oby.2006.234.
- Pate, R. R., K. A. Pfeiffer, S. G. Trost, P. Ziegler, and M. Dowda. 2004. “Physical Activity among Children Attending Preschools.” Pediatrics 114 (5): 1258–1263.
- Poitras, V. J., C. E. Gray, X. Janssen, S. Aubert, V. Carson, G. Faulkner, G. S. Goldfield, J. J. Reilly, M. Sampson, and M. S. Tremblay. 2017. “Systematic Review of the Relationships Between Sedentary Behaviour and Health Indicators in the Early Years (0-4 Years).” BMC Public Health 17 (Suppl 5): 868–868. doi:10.1186/s12889-017-4849-8.
- Rajalahti, T., R. Arneberg, F. S. Berven, K. M. Myhr, R. J. Ulvik, and O. M. Kvalheim. 2009a. “Biomarker Discovery in Mass Spectral Profiles by Means of Selectivity Ratio Plot [Article].” Chemometrics and Intelligent Laboratory Systems 95 (1): 35–48. doi:10.1016/j.chemolab.2008.08.004.
- Rajalahti, T., R. Arneberg, A. C. Kroksveen, M. Berle, K. M. Myhr, and O. M. Kvalheim. 2009b. “Discriminating Variable Test and Selectivity Ratio Plot: Quantitative Tools for Interpretation and Variable (Biomarker) Selection in Complex Spectral or Chromatographic Profiles.” Analytical Chemistry 81 (7): 2581–2590. doi:10.1021/ac802514y.
- Rajalahti, T., and O. M. Kvalheim. 2011. “Multivariate Data Analysis in Pharmaceutics: A Tutorial Review.” International Journal of Pharmaceutics 417 (1-2): 280–290. doi:10.1016/j.ijpharm.2011.02.019.
- Siraj, I., D. Kingston, and E. Melhuish. 2015. Assessing Quality in Early Childhood Education and Care: Sustained Shared Thinking and Emotional Well-Being (SSTEW) Scale for 2-5-Year-Olds Provision. London: Institute of Education Press.
- SSB. 2021. Preschool Attending Rates. https://www.ssb.no/barnehager.
- Tandon, P., N. Hassairi, J. Soderberg, and G. Joseph. 2020. “The Relationship of Gross Motor and Physical Activity Environments in Child Care Settings with Early Learning Outcomes.” Early Child Development and Care 190 (4): 570–579. doi:10.1080/03004430.2018.1485670.
- Tandon, P. S., B. E. Saelens, C. Zhou, and D. A. Christakis. 2018. “A Comparison of Preschoolers’ Physical Activity Indoors Versus Outdoors at Child Care.” International Journal of Environmental Research and Public Health 15(11). doi:10.3390/ijerph15112463.
- Telama, R., X. Yang, E. Leskinen, A. KankaanpÄÄ, M. Hirvensalo, T. Tammelin, J. S. A. Viikari, and O. T. Raitakari. 2014. “Tracking of Physical Activity from Early Childhood Through Youth Into Adulthood.” Medicine Science in Sports & Exercise 46 (5): 955–962. doi:10.1249/MSS.0000000000000181.
- Tonge, K. L., R. A. Jones, and A. D. Okely. 2015. “Correlates of Children’s Objectively Measured Physical Activity and Sedentary Behavior in Early Childhood Education and Care Services: A Systematic Review.” Preventive Medicine 89: 129–139. doi:10.1016/j.ypmed.2016.05.019.
- Tonge, K. L., R. A. Jones, and A. D. Okely. 2021. “The Relationship Between Educators’ and Children’s Physical Activity and Sedentary Behaviour in Early Childhood Education and Care.” Journal of Science and Medicine in Sport 24 (6): 580–584. doi:10.1016/j.jsams.2021.02.003.
- Tremblay, M. S., C. Gray, S. Babcock, J. Barnes, C. C. Bradstreet, D. Carr, G. Chabot, et al. 2015. “Position Statement on Active Outdoor Play.” International Journal of Environmental Research and Public Health 12 (6): 6475–6505. doi:10.3390/ijerph120606475.
- Truelove, S., B. A. Bruijns, L. M. Vanderloo, K. T. O’Brien, A. M. Johnson, and P. Tucker. 2018. “Physical Activity and Sedentary Time During Childcare Outdoor Play Sessions: A Systematic Review and Meta-Analysis.” Preventive Medicine 108: 74–85. doi:10.1016/j.ypmed.2017.12.022.
- Ulset, V., F. Vitaro, M. Brendgen, M. Bekkhus, and A. I. H. Borge. 2017. “Time Spent Outdoors During Preschool: Links with Children’s Cognitive and Behavioral Development.” Journal of Environmental Psychology 52: 69–80. doi:10.1016/j.jenvp.2017.05.007.
- Veldman, S. L. C., Chin A Paw, M. J. M. & Altenburg, and T. M. 2021. “Physical Activity and Prospective Associations with Indicators of Health and Development in Children Aged <5 Years: A Systematic Review.” International Journal of Behavioral Nutrition and Physical Activity 18 (1): 1–11. doi:10.1186/s12966-020-01072-w.
- Ward, D., D. Hales, K. Haverly, J. Marks, S. Benjamin, S. Ball, and S. Trost. 2008. “An Instrument to Assess the Obesogenic Environment of Child Care Centers.” American Journal of Health Behavior 32 (4): 380–386. doi:10.5993/AJHB.32.4.5.
- Wold, S., A. Ruhe, H. Wold, and W. J. Dunn. 1984. “The Collinearity Problem in Linear-Regression – The Partial Least-Squares (PLS) Approach to Generalized Inverses.” Siam Journal on Scientific and Statistical Computing 5 (3): 735–743. doi:10.1137/0905052.
- Ylvisåker, E., A. K. O. Nilsen, K. Johannessen, and E. Aadland. 2022. “The Role of Weather Conditions on Time Spent Outdoors and in Moderate-to-Vigorous Physical Activity Among Norwegian Preschoolers.” Journal of Sports Sciences 40 (1): 73–80. doi:10.1080/02640414.2021.1976490.
- Zhang, Z., N. Kuzik, K. B. Adamo, N. Ogden, G. S. Goldfield, A. D. Okely, M. Crozier, S. Hunter, M. Predy, and V. Carson. 2021. “Associations Between the Child Care Environment and Children’s In-Care Physical Activity and Sedentary Time.” Health Education & Behavior 48 (1): 42–53. doi:10.1177/1090198120972689.