
ABSTRACT
Understanding organizational culture and practices (OCPs) is crucial for business success, yet current assessments rely heavily on self-reports. We developed the “Dictionary of Organizational Culture and Practices”, the first theory-based text analysis tool designed to quantify OCPs as an alternative to surveys. Our approach integrates computational natural language processing with expert human judgement, using a 26 million words large corpus consisting of employee reviews of 526 companies, 1,121 mission and vision statements, and 285 company websites. We replicate Hofstede’s six-dimensional model of OCPs, not to be confused with Hofstede’s widely known model of national culture. Criterion validity is established by comparing our tool to existing ones that used data-driven approaches. Notably, our tool demonstrates construct validity through the striking similarity of the dimensional structure with survey-based measures. The level of alignment varied depending on the type of text, with congruence coefficients exceeding .9. Our findings offer valuable insights for academics and managers seeking to understand and shape an organization’s culture more effectively.
Introduction
Culture matters for organizations. They seek to assess it, typically via self-report surveys (Hofstede et al., Citation1990; Maher, Citation2000; Schein, Citation2010). However, self-reports have limitations, and organizational culture is expressed in numerous other ways (Denison et al., Citation2014; Reader et al., Citation2020). Current and former employees anonymously review companies on workplace rating sites, and companies present themselves to the outside world on their own websites and in reports addressed to their stakeholders and the general public. Such digital data hold information about organizational culture that is fundamentally different from answers to questionnaires. They are rather unobtrusive indicators of organizational culture (Reader & Gillespie, Citation2022; Webb et al., Citation1966) – without the direct engagement of employees. We set out to assess whether models largely based on self-report survey data are applicable to this type of data and aim to create the first theory-driven text analysis tool for measuring organizational culture. We do so relying on the organizational-culture framework, the Multi-Focus Model on Organizational Culture by Hofstede et al. (Citation1990),Footnote1 which is predominantly used in the business literature (Caprar et al., Citation2022).
The culture of an organization manifests in its organizational practices, and these are a good indicator of its functioning and adaptiveness. Organizational practices influence a variety of indicators, such as knowledge sharing and innovation promotion (Connelly et al., Citation2012), but also employee health (Varonen & Mattila, Citation2000). Consequently, organizational culture impacts a company’s performance. According to 92% of interviewed North American senior executives, the culture of a firm is a key determinant of its market value (Graham et al., Citation2016). Given these links, it is of obvious importance to assess organizational culture. Here, we develop and validate measurement tools for extracting organizational culture from text data.
There are countless definitions of culture (Baldwin et al., Citation2006), but it is most generally referred to as a shared meaning system (Fischer, Citation2009) or the collective programming of the human mind (Hofstede et al., Citation2010). Organizational culture, more specifically, can be defined as shared organizational practices that distinguish one organization from another. Practices are the observable and visible manifestations of organizational culture and are thus measurable (Hofstede et al., Citation1990).
Organizational culture research has overwhelmingly used survey data (Fischer et al., Citation2014; Hofstede et al., Citation1990; Maher, Citation2000; Schein, Citation2010). Structured self-reports are attractive (e.g., standardization, ease of administration; Cheung, Citation2021), but they are prone to common method variance, social desirability, and response style biases (Baumgartner et al., Citation2021; He et al., Citation2014). At least partially, these limitations could be overcome by alternative ways of assessment. There has recently been a strong call to utilize complementary methodologies (Field et al., Citation2021; Shenkar et al., Citation2020) and digital data, such as words and phrases used within and around an organization. Studies so far range from textual analyses of the core values and goals of companies (Sull et al., Citation2019) to establishing a culture dictionary via machine learning (Li et al., Citation2021) and coding pictures of offices for capturing the organizational culture (Byrne et al., Citation2022). However, most importantly, it is not clear whether theoretically established constructs will be structurally similar when measured with different data sources and types; for example, is the relationship between the Hofstede organizational culture and practices (OCP) dimensions of Customer Orientation and Organizational Effectiveness the same in text data as in survey data?
There are different ways of assessing organizational culture in natural language. In-depth interviews are time-intensive and not easily scaled, whilst text analysis takes time when done manually. Automated text analysis, in contrast, is fast and objective in terms of treating every text produced about an organization equally. Most importantly, natural language-based analyses can be closer to the actual behaviour and may capture real-world organizational practices better (Boyd & Pennebaker, Citation2017). Employees’ unstructured and spontaneous talking or writing about the companies they work for in private is a more natural source than structured survey items. If the text has been written by or for companies, such as companies’ marketing texts, the results will reflect the organization’s own perspective; that is how it wants to be seen, not the organizational culture as such. When texts are selected carefully, text analysis may overcome some of the biases associated with self-completion surveys.
Increasing digitalization has made textual data more available for research (Pollach, Citation2012), such as texts published by companies about themselves (e.g., websites, annual reports), publicly accessible employee reviews (e.g., on www.Glassdoor.com or www.Kununu.com), or social media postings about and by companies (e.g., X, Facebook). Dedicated software and programming packages are widely available to analyse these textual data using different approaches. Dictionary-based approaches count the frequency of words appearing in a text, allowing for quantitative analysis of qualitative data; researchers assign words to known or unknown categories. The dictionary approach is rooted in the “bag-of-words’’ assumption where the word order is irrelevant, and documents are treated as containers (a bag). The “bag-of-words’’ assumption can be followed in supervised models where the researcher knows both input and output, or unsupervised models where categories are created automatically (Banks et al., Citation2018). The dictionary approach can be considered a supervised model in this respect.
The quantitative computational linguistic analysis of text data is a new measurement method available to science and practice. Semantic analysis can predict and understand psychological constructs from textual data (Arnulf et al., Citation2014), with open-ended questions demonstrating equal or higher validity and reliability compared to closed-ended numerical rating scales (Kjell et al., Citation2019). Grunenberg et al. (Citation2024) outperformed traditional recruiter judgements in assessing applicants’ Big Five personality traits based on CVs and short text responses. Ponizovskiy et al. (Citation2020) found correlations between measured and self-reported scores for 7 out of 10 basic human values from Schwartz’ theory (Schwartz, Citation1992). All these studies focus on individual-level psychological constructs; there is limited adoption in organizational contexts (Banks et al., Citation2018; Hickman et al., Citation2022; Schmiedel et al., Citation2019) and a research gap in validating established theories through text. Yet, two projects stand out in the literature of analysing organizational culture through text. First, relying on 1.2 million employee reviews (ER), the MIT SMR/Glassdoor Culture 500 project (Sull et al., Citation2019) assesses nine cultural values (agility, collaboration, customer, diversity, execution, innovation, integrity, performance, respect); the nine values were selected based on the frequency of more than 60 distinct values that companies listed in value statements on their websites. ER from Glassdoor, an employee review site, were extracted and assigned to topics. The final Culture 500 dictionary contains over 20,000 words assigned to 90 topics, finally clustered into nine values. The project is data-driven, but the authors mention a partial conceptual overlap with the 6-dimensional Organizational Culture Profile by O’Reilly et al. (Citation2014). In the second project, Li et al. (Citation2021) start with the most frequently mentioned values of S&P 500 firms on their websites: innovation, integrity, quality, respect, and teamwork. They utilize the Q&A section of over 60,000 earning call transcripts of over 7,000 companies. While the Culture 500 project by Sull et al. (Citation2019) relied on a “painstaking process” (p. 8) of a lot of manual reviewing and mapping terms to topics, Li et al. (Citation2021) applied a computational linguistics approach with few human interventions. They apply the “word embedding model”, a model they use to identify words and phrases that commonly appear in the context of their five target values and their synonyms. The validation of their 1800-term dictionary with external indices suggests a correlation between their dictionary-based results and firms’ performance on the five indicators. Further, firms with high scores on these indicators demonstrate superior financial performance, particularly during economic hardship.
These two projects suggest that a computational linguistics approach generally works for assessing organizational culture from digital data; however, neither has there been objective evidence of validation published for the Sull et al. (Citation2019) instrument, nor can the Li et al. (Citation2021) instrument directly be linked to theory. Both instruments, respectively, rely on only one type of text – the Culture 500 dictionary is created and applied to employee reviews and is not even expected to work with other types of text; Li et al.’s dictionary was tested only on earning calls, and it is not clear how the dictionary would perform on other types of text.
The present study
Employing natural language processing techniques, we establish a dictionary building upon: Hofstede et al. (Citation1990) organizational culture scale, referred to as the Multi-Focus Model by practitioners and which is still a standard reference study (Maddux et al., Citation2021). The Multi-Focus Model on Organizational Culture consists of six dimensions:
D1 Effectiveness, Means- vs Goal-Orientation: In a means-oriented culture, emphasis is on work processes (the “how”), whereas in a goal-oriented culture, emphasis is on achieving specific internal goals or results (the “what”).
D2 Customer Orientation, Internal vs External: Internally-driven cultures prioritize business ethics and self-determined customer service standards, while externally-driven cultures stress meeting customer needs pragmatically and achieving results.
D3 Control, Easy-going vs Strict: An easy-going culture values improvisation and has a fluid structure, while a strict one places a premium on cost-consciousness, punctuality, and seriousness.
D4 Focus, Local vs Professional: In a local culture, employees identify with their boss or unit and tend to be short-term focused, while in a professional culture, they identify with their profession or job content.
D5 Approachability, Open vs Closed: Open cultures readily welcome newcomers and are inclusive, while closed cultures are less accessible and more protective of internal knowledge.
D6 Management Philosophy: Employee vs Work-Oriented: Employee-oriented organizations prioritize employee welfare, even at the expense of work, whereas work-oriented cultures emphasize task completion, potentially at the expense of employees.
Hofstede et al.’s organizational culture approach has been validated and applied frequently (Caprar et al., Citation2022; Verbeke et al., Citation2000).
The product of our study will be a text analysis tool, the “Dictionary of Organizational Culture and Practices” (DOCP). Our dictionary is based on the methodology developed by Ponizovskiy et al. (Citation2020). They created a personal values dictionary using publicly available texts to measure human values according to Schwartz’s (Citation1992) theory. Our dictionary quantifies organizational culture based on the Hofstede-based Multi-Focus Model. The entries of the dictionary are words and phrases, each being assigned to one or several dimension poles such as a goal-, customer-, or employee-oriented culture. Using natural language processing software such as LIWC (Linguistic Inquiry and Word Count; Tausczik & Pennebaker, Citation2010) or the corresponding R packages (Benoit et al., Citation2018), the DOCP might be used to analyse any text containing information about an organization’s culture and practices. We validate the dictionary against a dictionary on corporate cultural values of Li et al. (Citation2021) because it is established in the literature of LIWC-like dictionaries on organizational cultural values and has been validated against a number of external measures such as operational efficiency or firm value, and is publicly accessible. We finally compare the data structure of dictionary-based results in text to the survey results of the well-established and widely used model originating from Hofstede et al. (Citation1990).
Our study is the first, to our knowledge, with a theory-driven rather than a data-driven dictionary for assessing organizational culture, grounded in Hofstede’s et al. (Citation1990) seminal work on measuring organizational culture through practices. In addition, unlike the previous studies by Li et al. (Citation2021) or Sull et al. (Citation2019) that have focused on a narrow selection of text, we use a wide range of textual types around organizations to create our dictionary of words and phrases used within and around organizations: mission and vision statements (MVS), company websites (CW), employee reviews (ER), interview transcripts, and terms used in various organizational practices surveys items (see Table S1 in the supplementary material for a more detailed comparison of studies).
Method
The Dictionary of Organizational Culture Practices (DOCP) was developed in English, following the conventional steps to build such a dictionary (Ponizovskiy et al., Citation2020; Tausczik & Pennebaker, Citation2010) as can be seen in : (1) obtaining the source data (various text corpora), (2) generating and selecting candidate words, (3) mapping the candidate words to the dimensions to develop the provisional dictionary, (4) refinement, and (5) validation. Steps 1, 3, and 4 are mostly guided by human expert judgement, whereas Steps 2 and 5 apply data science algorithms and computational linguistics.
Figure 1. Dictionary development process.
To address the limitation of single-sourced texts of earlier studies (Li et al., Citation2021; Sull et al., Citation2019), we chose text corpora in Step 1 that can be divided into three main categories: companies talking about themselves, employees talking about these companies, and generic texts describing organizational culture and practices (OCPs; for a detailed overview of sources for candidate words and their reasons for inclusion see Table S2 in the supplementary material). For companies talking about themselves, we obtained mission and vision statements (MVS) from 1,121 companies with more than 420,000 words and website texts of 25 million words from 285 companies overlapping with the companies for which we had MVS. For employees talking about these companies, we included 2.5 million words of reviews of 372,447 employees working in 257 matched companies that represented various industries. For generic texts describing OCPs, we included item texts of various questionnaires that assess organizational culture and interview questions from in-depth interviews on OCPs.
Candidate words and phrases are referred to as n-grams (see for examples). Due to the very different sizes and nature of source data, different methods were used to generate candidate words in Step 2. The first method is based on frequency; the second method involves instrumentalizing a pre-trained natural language model (Honnibal et al., Citation2020) to extract noun phrases as n-grams. Companies with diverse organizational cultural profiles were selected based on high or low scores on the six dimensions of our theoretical model. These scores were derived from pre-existing survey assessments. Employee reviews and website texts were used as data sources. The supplementary material (S3) provides a detailed description of the data extraction process.
Table 1. Examples of n-grams, the building blocks of a dictionary.
We ended up with a list of 17,522 terms in total. The authors went through the terms to categorize them into relevant keywords (for example, “professional development”, “strong support”, “lack motivation”) and non-relevant keywords to be eliminated (for example, “tea people”, “consulting firms”, “comfy shoes”). This elimination procedure gave us 3,134 keywords categorized as related to OCPs. An additional 514 words and phrases were manually selected from survey items of the instruments measuring OCPs and from interview questions used by the consulting company Hofstede Insights Ltd to assess OCPs. These 514 words and phrases were directly assigned to the poles of the six dimensions. For a detailed overview and references of the sources used, see Table S2; provides an overview of the number of n-grams extracted from the various source data.
Table 2. Selection and distribution of n-grams across sources of data.
In Step 3, 11 certified consultants were recruited from within Hofstede Insights Ltd as experts to allocate n-grams to dimension poles. All experts had previously been trained in working with the Multi-Focus Model and hence had good working knowledge. The experts, who were financially compensated, mapped altogether 3,442 unique n-grams to the 12 poles of the 6 organizational-culture dimensions (Hofstede et al., Citation1990) of the Multi – focus Model or categorized the n-gram as not related to OCPs. To complete this procedure, we presented the n-grams to the experts as keywords in context (KWICs) – eight words before and after the keywords were displayed based on the context in which the n-gram appeared in the original text corpora (Manning & Schuetze, Citation1999). The online appendix (S4) contains the concrete instructions that were sent to the experts. As the selected n-grams appeared in the original text corpora in many different contexts, the same n-gram was displayed in two different contexts to every expert. Two experts mapped each n-gram, resulting in up to four different contexts. The candidate words were allocated to one or more of the dimension poles of the Multi-Focus Model to link the terms to the existing theory. In total, 8,690 mappings were completed in 3,119 employee contexts and 5,570 company contexts; hence, on average, every expert completed 790 mappings. We subsequently coded the dimension allocations by the experts as shown in Table S5 to establish the provisional dictionary.
This preliminary version of the DOCP enabled us to create the document by term matrices for the different corpora. During the last stage of the development phase, Step 4, we relied on the subsets of three corpora: Mission and Value Statements, Employee Reviews, and Company Websites. We used only a randomly selected 70% of the corpora when conducting the following analyses, reserving the remaining 30% for estimating the internal consistency of the DOCP dimension poles.
During this stage, we further applied an exploratory factor analysis with weighted least squares extraction and oblique rotation to the raw word counts for each pole of the six dimensions, with the aim of n-gram reduction and verification. We eliminated the words and phrases with factor loadings lower than .10 to eliminate words and phrases that were unrelated to other terms belonging to the same dimension pole or not distinctive enough to be kept in the refined dictionary. A larger reference value for the required minimum factor loading would have reduced the number of included words unnecessarily. Then, we checked for internal consistency of the DOCP dimension poles estimated using the binary (one-hot) scoring method: this method uses a binary count of the presence/absence of a word in a text and the reliability is calculated based on tetrachoric correlations of this binary data. This concludes the development phase.
As a first assessment of the structure, we visualized the refined DOCP dictionary to gain insight into the structure underlying the words and phrases mapped to the 12 dimension poles. We performed a homogeneity analysis through optimal scaling using the Homals package in R (de Leeuw & Mair, Citation2009).
In Step 5, we validated the refined dictionary. Except for the mission and vision statements (MVS), we used different text data sources for the validation: instead of publicly available employee reviews (ER), we used structured ER obtained from employee satisfaction surveys and provided by Great Place to Work.Footnote2 Company websites were replaced with publicly available annual reports (AR) of 124 stock-listed companies. As MVS were used as input for developing the dictionary and are thus prone to overfitting the data, the structured ER are similar in type to the publicly available ER, and AR are a type of text data that had not been used for the development of the dictionary altogether. Using different sets of data allowed us to gain insight into the range of applicability of the dictionary outside data sets used for development.
An overview of the validation steps and the data sources used in the respective analyses is provided in .
Figure 2. Dictionary validation process.
To assess the criterion validity of our dictionary (Step 5a), we estimated the associations between DOCP dimension scores and the related constructs of Innovation, Integrity, Quality, Respect, and Teamwork (Li et al., Citation2021) in the same set of text corpora. When applying a dictionary through the LIWC software (Tausczik & Pennebaker, Citation2010), the percentage of n-grams in the texts that were allocated to a dimension or pole was calculated. Our dictionary measured each dimension pole separately. To get a meaningful dimension score, we subtracted the left dimension pole score from the right. A correlation between these two dictionaries is indicative of the criterion validity of the DOCP.
To assess construct validity (Step 5b), we tested the similarity of the data structure between survey data results and text data results. We created multidimensional scaling (MDS) solutions for each source of data (survey data, MVS, ER, AR) with the SMACOF package in R (Mair et al., Citation2022), and then Procrustes rotated the MDS solutions of the text corpora towards the survey data as our “ground truth” (Boyd et al., Citation2021). A strong similarity of the MDS solutions across types of data collections, that is text versus self-report surveys, is indicative of some degree of construct validity of the developed dictionary.
The analyses were conducted in the statistical programming environment R (v3.6.3 and v4.3.0, respectively). The following packages/libraries were used: homals v1.0.10; LIWC-22 v1.3.0; psych v2.0.7; quanteda v2.0.1; quanteda.textstat v0.90; quanteda.textmodels v0.90; smacof: 2.1.5; spacyr v1.2.1; Tableau v.2024.1.0.
Results
The first version of the dictionary contained 3,305 n-grams with 1,705 cross-mappings. The agreement between raters in one identical set of 500 KWICs mapped by two expert raters was 65%: Out of 100 words and phrases that were allocated to a dimension pole, 65 allocations were the same, which is considered a good number in practice. Overall, allocations were unequally distributed across the 12 poles – the goal orientation pole had the most allocations with 943 mappings, while the easy-going work discipline pole had the least with 245 mappings, showing that our expert raters found that the presented text reflects some dimensions more prominently than others. exemplifies the allocation of n-grams to the dimensions and poles, and Table S6 shows an extract of the first dictionary entries in LIWC format. The refinement process reduced the number of n-grams to 2,870 and the cross-mappings to 1,671. The refined dictionary is available at the open science framework (https://osf.io/x5wqt/).
Table 3. Example n-grams (uni-grams, bi-grams, tri-grams and four-grams) as they were allocated to the dimension poles.
The internal consistencies of allocated keywords were high, between .81 and .95 across OCP dimensions and corpora (mission and vision statements, company websites, and employee reviews). Detailed internal consistency results are displayed in Table S7.
The poles of our dictionary are not independent as included n-grams loaded on more than one dimension pole. To assess the relationship between dimension poles based on the expert mappings, plots the results of a homogeneity analysis (explained variance: 26%; de Leeuw & Mair, Citation2009) using the dictionary as data source. The axes reveal a semantic space where proximities indicate thematic co-occurrence. The further away from the origin, the stronger the relations are. Positions on either side of the origin indicate a strong negative relationship.
Figure 3. Dimension pole homogeneity analysis: visualization of the dictionary allocations by experts. Numbers in parentheses refer to the dimension the pole belongs to (D1 = Effectiveness, D2 = Customer Orientation, D3 = Control, D4 = Focus, D5 = Approachability, D6 = Management Philosophy).
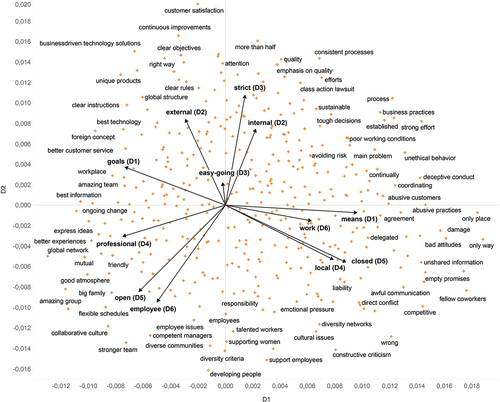
The left side indicates a highly professional culture focused on progress and change, represented through keywords such as “ongoing change,” “employee morale,” “global network,” “best information,” “progression opportunities,” or “amazing team.” Within Hofstede et al. (Citation1990) framework, the Multi-Focus Model, this type of culture is primarily included in the dimensions D1 Effectiveness (goal orientation: results are more important than processes) and D4 Focus (professional: high identification with the job), and to a lesser extent through D5 Approachability (open, regarding communication and diversity), and D6 Management Philosophy (employee orientation: taking into account personal problems of employees) as indicated by the arrows in .
In contrast, the right side captures a competitive, dysfunctional culture with an unpleasant work environment, represented through keywords such as “unethical behaviour,” “ultra conservative approach,” “bad planning,” “centric management,” poor work environment,’ or “unshared information.” In line with theoretical expectations according to the Hofstede et al. (Citation1990) framework, these features are captured by the opposing poles of the corresponding dimensions mentioned for the left side of the axis: a focus on means (D1 – processes more important than results), work (D6 – high pressure to perform tasks), a closed (D5 – untransparent and inaccessible) and local (D4 – loyalty more important than the content of the job) culture.
The top aligns with a business-oriented culture focused on clarity, represented through keywords such as “attention,” “consistent processes,” “clear objectives,” “global structure,” “clear rules,” or “highest standards.” These keywords are reflected in the dimensions D2 Customer Orientation and D3 Control within Hofstede et al. (Citation1990) framework: interestingly, both poles of these dimensions belong to this section of the semantic space.
Finally, the bottom combines a people-oriented culture open to diversity, represented through keywords such as “support employees,” “developing people,” “supporting women,” “responsibility,” or “better work-life balance.” Notably, none of the Multi-Focus Model dimensions clearly capture this section, though employee orientation (D6 Management Philosophy) comes closest.
The spread of dimension poles based on the expert mappings differs from the expected distribution of the Multi-Focus Model dimensions as none of the theoretical dimensions by Hofstede et al. (Citation1990) correspond to the lower part of the semantic space in , and some dimension poles cluster together instead of being distributed throughout the space. Notably, the themes of the semantic space could equally well be allocated to other organizational culture models such as O’Reilly’s organizational culture profile (adaptability, integrity, collaborative, results-oriented, customer-oriented, and detail-oriented; O’Reilly et al., Citation2014)) or the three practice dimensions by Fischer et al (employee practices, innovation practices, and formalization practices; Fischer et al., Citation2014).
To assess criterion validity, we calculated the Pearson correlations () between our DOCP dimensions (rows) and the Corporate Cultural Values (Li et al., Citation2021, columns) across the data sets selected for validation: mission and vision statements (MVS), employee reviews (ER), and annual reports (AR). D1 Effectiveness (means minus goal orientation) was positively correlated with Innovation (MVS, .132), Integrity (MVS, .143; ER, .413), Quality (MVS, .078; ER, .389), Respect (MVS, .091; ER, .157), and Teamwork (MVS .107, ER, .584); This indicates that typical characteristics of a goal-oriented organization are an entrepreneurial attitude, creativity, productivity, and trustworthiness. D2 Customer Orientation (internal minus external) was positively correlated with Innovation (ER, .444), Quality (MVS, .112; ER .187), and negatively correlated with Integrity (ER −.275; AR, −.252). The highest correlation was found between D1 Effectiveness and Teamwork in the ER dataset (.584). All correlations from the employee review dataset were in line with conceptual expectations, whereas in the other datasets, there were occasionally counterintuitive correlations with sometimes opposing signs.
Table 4. Pearson correlations between our DOCP dimensions (rows) and the corporate cultural values (columns) by Li et al. (Citation2021) based on LIWC results from three types of text data. The sources of the DOCP dimensions data are Mission and Value Statements (MVS, 1,091 companies), Employee Reviews (ER, 269 companies; aggregated to company level) and Annual Reports (AR, 124 companies).
To assess construct validity, we compared the configurations of dimensions within four data sources: survey data (our “ground truth”), employee reviews, mission and vision statements, and annual reports. The DOCP captured the text content to a varying degree: 22% of the mission and vision statement, 18% of both the employee review and 12% of annual report words were listed in our dictionary and could be attributed to OCPs. Multidimensional scaling with Procrustean rotation towards the survey data solution was used for this analysis. MDS stress values and fit measures for each solution are reported in Table S8.
Survey Data (, pane a): Six theoretical OCP dimensions were mapped in a three-dimensional space. The x-axis contrasted a goal-oriented and professional culture (left side) against a closed and work-oriented culture (right side). D3 Control and D2 Customer Orientation were central on the x-axis, opposing each other on the y-axis, and low on the third dimension, indicated through the size of the dots.
Figure 4. Three-dimensional MDS of survey data and text data (ER, MVS, AR) rotated towards survey data. The third dimension is visualized through the size of the dots.
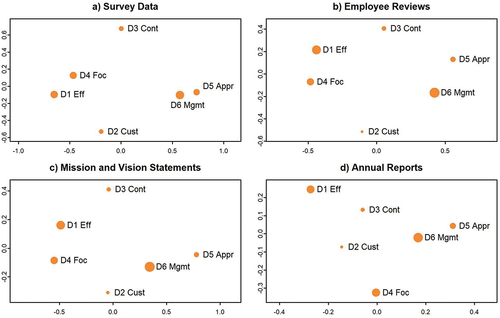
Employee Reviews (pane b) showed clear similarity to the survey data (congruence coefficient of .973). The main differences were the reversed positions of D1 Effectiveness and D4 Focus on the y-axis and the greater distance between D6 Management Philosophy and D5 Approachability, placing a goal-oriented (D1) and closed (D5) culture closer to a strict culture (D3 control) compared to the survey data.
Mission and Vision Statement Data (pane c) showed the biggest similarity to the survey data in terms of the congruence coefficient (.976). The dimensions were aligned as in the survey data, with the notable difference that, similar to the employee reviews, D6 Management Philosophy moved away from D5 Approachability compared to the survey data.
Annual Report Data (pane d) showed the least alignment with the survey data (congruence coefficient of .913). Yet, the six OCP dimensions were arranged similarly to the survey data, with the positions of D1 and D4 reversed on the y-axis, as in the employee review data.
All solutions resemble the results of the homogeneity analysis presented earlier (), with the exception of D2 Customer Orientation manifesting on the opposing side of the y-axis. In summary, the configurations in different sources exhibited close alignment with the survey data, with some slight differences noted in the configurations of employee reviews, mission and vision statements, and annual reports. Congruence coefficients above .95 suggest equal configurations, while those above .85 are interpreted as fairly similar (Skimina et al., Citation2021). Notably, the distance between the closest dimensions in the survey data (D1 Effectiveness and D4 Focus; D5 Approachability and D6 Management philosophy) is greater in all three text-based configurations, suggesting that text analysis might be even better suited than questionnaires in capturing the conceptual differences between these dimensions.
Discussion
We created the Dictionary of Organizational Culture and Practices (DOCP) and applied it to different types of text with the aim to reproduce and extend the Multi-Focus Model on organizational culture (Hofstede et al., Citation1990) whose dimensions were originally established through the analysis of survey data. The approach adds to the literature and our understanding of organizational culture in several ways:
Adoption of a theory-driven approach: Unlike the conventional data-driven approach found in previous studies (Li et al., Citation2021; Sull et al., Citation2019), our study implements a theory-driven approach, reproducing an existing model: the Multi-Focus Model on organizational culture (Hofstede et al., Citation1990). The theory-driven approach is more challenging as the researcher needs to find theoretically defined dimensions from the text data rather than searching texts for frequently co-occurring n-grams and building a model around it. We succeeded in finding the a-priori defined OCP dimensions from text data and in showing that the dimensional structure of text data results is very similar to the dimensional structure of survey data results. Our tool provides a cost-effective and less biased method to compare organizational culture profiles using existing text data. It offers an alternative approach for future OCP studies based on the Multi-Focus Model.
Usage of diverse text data sources: Our study was also the first one, to our knowledge, that built an organizational culture dictionary from multiple sources of text data. We included text data from employee reviews, mission and vision statements, company websites, and various established survey instruments. Previous studies focused on one type of text data such as employee reviews (Sull et al., Citation2019) or earnings calls (Li et al., Citation2021) only. We showed that it is possible to develop a dictionary from multiple textual sources and to apply the developed dictionary to other types of texts (like annual reports) while maintaining the dimensional structure. However, based on the correlations with results of other, data driven tools (), results from different text sources cannot be interpreted in the same way. Consequently, a comparison of results from different text sources is likely not meaningful. This is an important finding that is likely relevant to other dictionary tools outside the organizational culture sphere.
Methodological contribution: Our approach was guided by predefined criteria for n-gram selection, refining the dictionary’s ability to differentiate between companies. We further demonstrated the value of multiple methods through expert assessment of keywords in context, combining human judgement with computational linguistics. Compared to other machine learning approaches, the dictionary one is rather easy to comprehend and use: the dictionary consists of text entries and can be read by anybody just like a traditional dictionary. The easy-to-use software package LIWC (Tausczik & Pennebaker, Citation2010) or the R package quanteda (Benoit et al., Citation2018) are available to researchers and can be taken into use with little preparation or cost compared to approaches requiring large computing power and where it is often not clear what happens behind the curtain. LIWC enables users to upload customized dictionaries and select specific text files or directories containing such files – for example, meeting transcripts. The software output indicates the proportion of words from the uploaded dictionary that can be attributed to various dimensions. This efficient process facilitates a comparative analysis of texts based on the theoretically-grounded Multi-Focus Model (Hofstede et al., Citation1990) with minimal effort.
Validation of the Multi-Focus Model on Organizational Culture: We successfully derived the six dimensions of organizational culture based on Hofstede et al. (Citation1990) from various textual sources: employee reviews, mission and vision statements, and annual reports. The dimensional structure resembled the survey-based model in all text corpora, with congruence coefficients between .913 and .976, indicating strong alignment. While these results do not imply the model’s universal applicability, they demonstrate that the organizational culture dimensions, as theorized by Hofstede, are not confined solely to survey research methods. This finding is important as it provides evidence that the Multi-Focus Model is not a methodological artefact of self-report surveys but suitable to describe the (non-)functioning of an organization more generically, opening the doors to new applications of the model. For example, interested buyers or prospective employees of companies could use the model to gain insights into an organization’s working culture without contacting the company.
Limitations
As our study is the first one developing a theory-based dictionary to replicate a survey-based model from various large text data sources, we were only able to cover some aspects, leaving ample space for future research:
It is still uncertain to what extent dictionary-based text analysis results are equivalent to survey results. We quantified the construct of organizational culture from textual data, and we established structural equivalence (similarity of relationships) with the results of the corresponding survey instrument. However, like in similar studies in psychology (e.g., Arnulf & Larsen, Citation2020; Kjell et al., Citation2019), we cannot claim metric or scalar equivalence (He & van de Vijver, Citation2012). Finding the same dimensional structure in survey and text data does not mean that a particular organization would score similarly regardless of whether survey or text data was analysed. Grunenberg et al. (Citation2024) pioneered predicting job applicants’ Big Five scores by analysing CVs and short text responses. Although their tool outperformed recruiter judgements, the average correlation between predicted and self-reported personality traits was only moderate (r = .25). In organizational behaviour, predictive accuracy remains unestablished due to a lack of studies with matched text and survey data. Currently, there is insufficient evidence to claim the superiority of either survey or text data analysis.
We found that the dictionary works best on the types of text that were used for its development, like mission and vision statements and employee reviews. Further, limited resources forced us to map only a selection of potential candidate words following the KWIC approach, which has affected the association of the n-grams in the dictionary and the overall dimensionality of the final solution. The DOCP does not claim to include all words potentially related to organizational culture, and we do not know how well the dictionary performs with other types of data that were not used in the development of the dictionary, such as internal communication (emails, chat messages, meeting transcripts). Hence, caution should be exercised when relying solely on one text source for understanding an organization’s culture, as the quality and type of text data are crucial for the quality of the result. Our decision to use several types of data in the development phase addressed this limitation already to some degree.
Our DOCP consists of English words and phrases and hence can only be applied to English texts. While dictionary translation is cumbersome and may not take national culture differences into account, developing a dictionary for every language and national culture is not practical. The translation of source texts into English may be the best approach in most cases under the bag-of-words assumption that the word order is irrelevant and documents are treated as containers (Banks et al., Citation2018).
Future research could focus on the predictiveness of text analysis results on various indicators such as profitability or sick leaves. The challenge of such a study is not only the gathering of high-quality textual data and the corresponding indicators from the same organizations but also establishing the correct linkage of text data, typically available for certain organizational units within one country, and indicators, often only available on a global level in the case of international organizations.
Managerial implications
The findings of this study have several managerial implications for organizations, highlighting the value of text analysis in assessing organizational culture. Firstly, the study demonstrates that organizational culture dimensions can be derived from multiple types of text data, such as employee reviews and mission and vision statements, in an effective and, arguably, more nuanced manner than with employee surveys. This allows managers to gain valuable insights into their organization by analysing these textual sources. Secondly, the research underscores the effectiveness of even relatively simple quantitative text analysis techniques for reproducing models established through quantitative survey methods. This implies that text analysis tools can complement or validate survey-based assessments of organizational culture. By incorporating these text analysis techniques into their assessment of organizational culture, managers can develop a more comprehensive understanding of the cultural dynamics within their organization. Text analysis will also provide a cost-effective and efficient way to continuously monitor and assess cultural trends within the organization, as well as to track the effectiveness of cultural change initiatives over time (Rathje et al., Citation2023). Managers might utilize this model as a framework to understand and describe the culture of their organization, regardless of the data sources used.
The study highlights the need to explore further the suitability of different text data types for assessing organizational culture. Not all texts are the same. The lower congruence between the results obtained from the DOCP dictionary applied to annual reports (coefficient of .913) suggests that caution should be exercised when relying solely on this text source for understanding an organization’s culture, as communication by management through these outlets apparently does not convey the organizational culture sufficiently. When comparing the DOCP results of employee reviews with the DOCP results of mission and vision statements, different perspectives are compared: the actual organizational culture perceived by the employees versus the projected organizational culture as the organization presents it. Managers should be aware that i) different sources of text provide a different picture of their organizational culture, ii) hence cannot be directly compared between each other, and iii) for a comprehensive insight into the culture, a combination of survey and the analysis of different text sources seems to provide the most accurate description. Analysing different text sources may help identify gaps between the projected and actual culture of an organization. Managers are best advised to use a mix of survey and text analysis to gain a comprehensive understanding of their organization’s culture.
Conclusion and perspective
By adopting a theory-driven approach with multiple sources of text data for reproducing the Multi-Focus Model on organizational culture, this study has contributed to the still scarce literature on the measurement of organizational culture using text. The developed dictionary provides researchers and managers with an exciting new tool for describing organizational culture, providing more comprehensive insights compared to self-report surveys only. Given the similar structure of text and survey results, a takeaway for survey research is that semantic themes largely predetermine associations between constructs such as cultural dimensions (Arnulf & Larsen, Citation2020; Kjell et al., Citation2019) – they help us understand how people respond to questionnaires. The measures derived from theory-driven text analysis were found to be at least equally insightful as data-driven text analysis approaches. The LIWC technology (=counting words) is somewhat restrictive for such a complex task as picking up on context in text, and more advanced text analysis tools, especially large language models such as ChatGPT, may soon provide better possibilities for analysing organizational culture from text as recent studies suggest (Fischer et al., Citation2023; Rathje et al., Citation2023). However, generic AI tools are not able to analyse text based on established and validated organizational culture theory; they need to be trained. Here, our study and its components, such as the allocated keywords in context, can serve as a basis for the development of AI-based tools. Further, dictionary-based methods will remain helpful for understanding the black box of large language models.
Supplemental Material
Download MS Word (137.3 KB)Acknowledgements
We would like to thank MBA-Exchange.com for the provision of mission and vision statements and Great Place to Work Deutschland GmbH for the provision of employee review data. We would like to acknowledge and express our deep gratitude to Peter Holtz, who passed away during the process of writing this paper. He will be greatly missed.
Disclosure statement
One of the authors is employed by Hofstede Insights Ltd.
Supplementary material
Supplemental data for this article can be accessed online at https://doi.org/10.1080/1359432X.2024.2360225
Additional information
Funding
Notes
1. Not to be confused with Hofstede’s framework on national culture, the “6D Model” (Hofstede et al., Citation2010)
2. The open questions of Great Place to Work Germany were: (1) Is there anything unique or unusual about this organization that makes it a great place to work? Please give specific examples. (2) If you could change one thing about this organization to make it a better place to work, what would it be? Please give specific examples. (3) What values does your employer stand for? Please describe in three words what is unique about your employer from your point of view.
References
- Arnulf, J. K., & Larsen, K. R. (2020). Culture blind leadership research: How semantically determined survey data May fail to detect cultural differences. Frontiers in Psychology, 11, 176. https://doi.org/10.3389/fpsyg.2020.00176
- Arnulf, J. K., Larsen, K. R., Martinsen, Ø. L., Bong, C. H., & Homayouni, R. (2014). Predicting survey responses: How and why semantics shape survey statistics on organizational behaviour. PLOS ONE, 9(9), e106361. https://doi.org/10.1371/journal.pone.0106361
- Baldwin, J. R., Faulkner, S. L., Hecht, M. L., & Lindsley, S. L. (2006). Redefining culture: Perspectives across the disciplines. Routledge.
- Banks, G. C., Woznyj, H. M., Wesslen, R. S., & Ross, R. L. (2018). A review of best practice recommendations for text analysis in R (and a user-friendly app). Journal of Business and Psychology, 33(4), 445–459. https://doi.org/10.1007/s10869-017-9528-3
- Baumgartner, H., Weijters, B., & Pieters, R. (2021). The biasing effect of common method variance: Some clarifications. Journal of the Academy of Marketing Science, 49(2), 221–235. https://doi.org/10.1007/s11747-020-00766-8
- Benoit, K., Watanabe, K., Wang, H., Nulty, P., Obeng, A., Müller, S., & Matsuo, A. (2018). quanteda: An R package for the quantitative analysis of textual data. Journal of Open Source Software, 3(30), 774. https://doi.org/10.21105/joss.00774
- Boyd, R. L., & Pennebaker, J. W. (2017). Language-based personality: A new approach to personality in a digital world. Current Opinion in Behavioral Sciences, 18, 63–68. https://doi.org/10.1016/j.cobeha.2017.07.017
- Boyd, R. L., Wilson, S. R., Pennebaker, J. W., Kosinski, M., Stillwell, D. J., & Mihalcea, R. (2021). Values in words: Using language to evaluate and understand personal values. Proceedings of the Ninth International AAAI Conference on Web and Social Media - ICWSM, 2015, Oxford, United Kingdom, 9(1), 31–40. https://doi.org/10.1609/icwsm.v9i1.14589
- Byrne, Z. S., Cave, K. A., & Raymer, S. D. (2022). Using a generalizable photo-coding methodology for assessing organizational culture artifacts. Journal of Business and Psychology, 37(4), 797–811. https://doi.org/10.1007/s10869-021-09773-0
- Caprar, D. V., Kim, S., Walker, B. W., & Caligiuri, P. (2022). Beyond “doing as the romans do”: A review of research on countercultural business practices. Journal of International Business Studies, 53(7), 1449–1483. https://doi.org/10.1057/s41267-021-00479-2
- Cheung, A. K.-L. (2021). Structured Questionnaires. In F. Maggino (Ed.), Encyclopedia of quality of life and well-being research (pp. 6399–6402). Springer International Publishing. https://doi.org/10.1007/978-3-319-69909-7_2888-2
- Connelly, C. E., Zweig, D., Webster, J., & Trougakos, J. P. (2012). Knowledge hiding in organizations. Journal of Organizational Behavior, 33(1), 64–88. https://doi.org/10.1002/job.737
- de Leeuw, J., & Mair, P. (2009). Gifi methods for optimal scaling in R: The package homals. Journal of Statistical Software, 31(4), 1–21. https://doi.org/10.18637/jss.v031.i04
- Denison, D., Nieminen, L., & Kotrba, L. (2014). Diagnosing organizational cultures: A conceptual and empirical review of culture effectiveness surveys. European Journal of Work and Organizational Psychology, 23(1), 145–161. https://doi.org/10.1080/1359432X.2012.713173
- Field, J. G., Bosco, F. A., Kraichy, D., Uggerslev, K. L., & Geiger, M. K. (2021). More alike than different? A comparison of variance explained by cross-cultural models. Journal of International Business Studies, 52(9), 1797–1817. https://doi.org/10.1057/s41267-021-00428-z
- Fischer, R. (2009). Where is culture in cross cultural research?: An outline of a multilevel research process for measuring culture as a shared meaning system. International Journal of Cross Cultural Management, 9(1), 25–49. https://doi.org/10.1177/1470595808101154
- Fischer, R., Ferreira, M. C., Assmar, E. M. L., Baris, G., Berberoglu, G., Dalyan, F., Wong, C. C., Hassan, A., Hanke, K., & Boer, D. (2014). Organizational practices across cultures: An exploration in six cultural contexts. International Journal of Cross Cultural Management, 14(1), 105–125. https://doi.org/10.1177/1470595813510644
- Fischer, R., Luczak-Roesch, M., & Karl, J. A. (2023). What does ChatGPT return about human values? Exploring value bias in ChatGPT using a descriptive value theory. arXiv [cs.CL]. arXiv. http://arxiv.org/abs/2304.03612
- Graham, J. R., Grennan, J., Harvey, C. R., & Rajgopal, S. (2016). Corporate Culture: The Interview Evidence. SSRN Electronic Journal, Research. https://doi.org/10.2139/ssrn.2842823
- Grunenberg, E., Peters, H., Francis, M. J., Back, M. D., & Matz, S. C. (2024). Machine learning in recruiting: Predicting personality from CVs and short text responses. Frontiers in Social Psychology, 1, 1. https://doi.org/10.3389/frsps.2023.1290295
- He, J., & van de Vijver, F. (2012). Bias and equivalence in cross-cultural research. Online Readings in Psychology & Culture, 2(2), 2(2. https://doi.org/10.9707/2307-0919.1111
- He, J., Van de Vijver, F., Espinosa, A. D., & Mui, P. H. C. (2014). Toward a unification of acquiescent, extreme, and midpoint response styles: A multilevel study. International Journal of Cross Cultural Management, 14(3), 306–322. https://doi.org/10.1177/1470595814541424
- Hickman, L., Thapa, S., Tay, L., Cao, M., & Srinivasan, P. (2022). Text preprocessing for text mining in organizational research: Review and recommendations. Organizational Research Methods, 25(1), 114–146. https://doi.org/10.1177/1094428120971683
- Hofstede, G., Hofstede, G. J., Minkov, M., Slotboom, Y., Hofstede, G., & Veldhuizen, I. (2010). Cultures and organizations: Software of the mind-intercultural cooperation and its importance for survival. Vox Sanguinis, 98(3 Pt 1), e201–8. https://doi.org/10.1111/j.1423-0410.2009.01297.x
- Hofstede, G., Neuijen, B., Ohayv, D. D., & Sanders, G. (1990). Measuring organizational cultures: A qualitative and quantitative study across twenty cases. Administrative Science Quarterly, 35(2), 286–316. https://doi.org/10.2307/2393392
- Honnibal, M., Montani, I., & Van Landeghem, S. (2020). Boyd. A. SpaCy: Industrial-Strength Natural.
- Kjell, O. N. E., Kjell, K., Garcia, D., & Sikström, S. (2019). Semantic measures: Using natural language processing to measure, differentiate, and describe psychological constructs. Psychological Methods, 24(1), 92–115. https://doi.org/10.1037/met0000191
- Li, K., Mai, F., Shen, R., & Yan, X. (2021). Measuring corporate culture using machine learning. SSRN Electronic Journal. https://doi.org/10.2139/ssrn.3256608
- Maddux, W. W., Lu, J. G., Affinito, S. J., & Galinsky, A. D. (2021). Multicultural experiences: A Systematic Review and new theoretical framework. Academy of Management Annals, 15(2), 345–376. https://doi.org/10.5465/annals.2019.0138
- Maher, M. A. (2000). Diagnosing and changing organizational culture: Based on the competing values framework. Journal of Organizational Change Management, 13(3), 300–303. https://doi.org/10.1108/jocm.2000.13.3.300.1
- Mair, P., Groenen, P. J. F., & de Leeuw, J. (2022). More on multidimensional scaling and unfolding in R: Smacof version 2. Journal of Statistical Software, 102(10), 1–47. https://doi.org/10.18637/jss.v102.i10
- Manning, C., & Schuetze, H. (1999). Foundations of statistical natural language processing. MIT Press. http://dlib.ptit.edu.vn/handle/HVCNBCVT/2529
- O’Reilly, C. A., Caldwell, D. F., Chatman, J. A., & Doerr, B. (2014). The promise and problems of organizational culture: CEO personality, culture, and firm performance. Group and Organization Management, 39(6), 595–625. https://doi.org/10.1177/1059601114550713
- Pollach, I. (2012). Taming textual data: The contribution of corpus linguistics to computer-aided text analysis. Organizational Research Methods, 15(2), 263–287. https://doi.org/10.1177/1094428111417451
- Ponizovskiy, V., Ardag, M., Grigoryan, L., Boyd, R., Dobewall, H., & Holtz, P. (2020). Development and validation of the personal values dictionary: A theory–driven tool for investigating references to basic human values in text. European Journal of Personality, 34(5), 885–902. https://doi.org/10.1002/per.2294
- Rathje, S., Mirea, D.-M., Sucholutsky, I., Marjieh, R., Robertson, C., & Van Bavel, J. J. (2023). GPT is an effective tool for multilingual psychological text analysis. https://doi.org/10.31234/osf.io/sekf5
- Reader, T. W., & Gillespie, A. (2022). Developing a battery of measures for unobtrusive indicators of organisational culture: A research note. Journal of Risk Research, 26(1), 1–18. https://doi.org/10.1080/13669877.2022.2108116
- Reader, T. W., Gillespie, A., Hald, J., & Patterson, M. (2020). Unobtrusive indicators of culture for organizations: A systematic review. European Journal of Work and Organizational Psychology, 29(5), 633–649. https://doi.org/10.1080/1359432X.2020.1764536
- Schein, E. H. (2010). Organizational culture and leadership. John Wiley & Sons.
- Schmiedel, T., Müller, O., & Vom Brocke, J. (2019). Topic modeling as a strategy of inquiry in organizational research: A tutorial with an application example on organizational culture. Organizational Research Methods, 22(4), 941–968. https://doi.org/10.1177/1094428118773858
- Schwartz, S. H. (1992). Universals in the content and structure of values: Theoretical advances and empirical tests in 20 countries. Advances in Experimental Social Psychology, 25(C), 1–65.
- Shenkar, O., Tallman, S. B., Wang, H., & Wu, J. (2020). National culture and international business: A path forward. Journal of International Business Studies, 53(3), 516–533. https://doi.org/10.1057/s41267-020-00365-3
- Skimina, E., Cieciuch, J., & Revelle, W. (2021). Between- and within-person structures of value traits and value states: Four different structures, four different interpretations. Journal of Personality, 89(5), 951–969. https://doi.org/10.1111/jopy.12627
- Sull, D., Sull, C., & Chamberlain, A. (2019). Measuring culture in leading companies. MIT Sloan Management Review and Glassdoor. https://sloanreview.mit.edu/projects/measuring-culture-inleading-companies/
- Tausczik, Y. R., & Pennebaker, J. W. (2010). The psychological meaning of words: LIWC and computerized text analysis methods. Journal of Language and Social Psychology, 29(1), 24–54. https://doi.org/10.1177/0261927X09351676
- Varonen, U., & Mattila, M. (2000). The safety climate and its relationship to safety practices, safety of the work environment and occupational accidents in eight wood-processing companies. Accident; Analysis and Prevention, 32(6), 761–769. https://doi.org/10.1016/S0001-4575(99)00129-3
- Verbeke, W. (2000). A revision of Hofstede et al.’s (1990) organizational practices scale. Journal of Organizational Behavior, 21(5), 587–602.
- Webb, E. J., Campbell, D. T., Schwartz, R. D., Sechrest, L., & Sechrest, L. (1966). Unobtrusive measures: Nonreactive research in the social sciences. The American Journal of Psychology, 80(1), 161. https://doi.org/10.2307/1420565