
 ?Mathematical formulae have been encoded as MathML and are displayed in this HTML version using MathJax in order to improve their display. Uncheck the box to turn MathJax off. This feature requires Javascript. Click on a formula to zoom.
ABSTRACT
Limiting warming to well below 2°C requires rapid and complete decarbonisation of energy systems. We compare economy-wide modelling of 1.5°C and 2°C scenarios with sector-focused analyses of four critical sectors that are difficult to decarbonise: aviation, shipping, road freight transport, and industry. We develop and apply a novel framework to analyse and track mitigation progress in these sectors. We find that emission reductions in the 1.5°C and 2°C scenarios of the IMAGE model come from deep cuts in CO2 intensities and lower energy intensities, with minimal demand reductions in these sectors’ activity. We identify a range of additional measures and policy levers that are not explicitly captured in modelled scenarios but could contribute significant emission reductions. These are demand reduction options, and include less air travel (aviation), reduced transportation of fossil fuels (shipping), more locally produced goods combined with high load factors (road freight), and a shift to a circular economy (industry). We discuss the challenges of reducing demand both for economy-wide modelling and for policy. Based on our sectoral analysis framework, we suggest modelling improvements and policy recommendations, calling on the relevant UN agencies to start tracking mitigation progress through monitoring key elements of the framework (CO2 intensity, energy efficiency, and demand for sectoral activity, as well as the underlying drivers), as a matter of urgency.
Key policy insights
Four critical sectors (aviation, shipping, road freight, and industry) cannot cut their CO2 emissions to zero rapidly with technological supply-side options alone. Without large-scale negative emissions, significant demand reductions for those sectors’ activities are needed to meet the 1.5–2°C goal.
Policy priorities include affordable alternatives to frequent air travel; smooth connectivity between low-carbon travel modes; speed reductions in shipping and reduced demand for transporting fossil fuels; distributed manufacturing and local storage; and tightening standards for material use and product longevity.
The COVID-19 crisis presents a unique opportunity to enact lasting CO2 emissions reductions, through switching from frequent air travel to other transport modes and online interactions.
Policies driving significant demand reductions for the critical sectors’ activities would reduce reliance on carbon removal technologies that are unavailable at scale.
1. Introduction
The ambition of the Paris Agreement to limit global temperature rise to well below 2°C and pursue efforts to achieve 1.5°C requires deep emission reductions. Many studies show that cost-optimal paths reach net zero carbon dioxide (CO2) emissions around the middle of this century or slightly thereafter (Rogelj et al., Citation2016; Rogelj et al., Citation2018; Tavoni et al., Citation2015). ‘Net zero’ emissions can be reached by reducing emissions to zero in all sectors, or alternatively by offsetting remaining emissions in some sectors by active removal of CO2 from the atmosphere (IPCC, Citation2018). However, carbon dioxide removal (CDR) could lead to major trade-offs with other societal goals or could fail to perform at large scale (Drews et al., Citation2020; Fuss et al., Citation2014; Gaede & Meadowcroft, Citation2016; Hu et al., Citation2020; Ji et al., Citation2020; Jin et al., Citation2019; Larkin et al., Citation2017; Lilliestam et al., Citation2012; Sharifzadeh et al., Citation2019; Vaughan et al., Citation2018; Yamagata, Citation2019); hence, extensive inclusion of CDR in future scenarios is contested (Low & Schäfer, Citation2020; Workman et al., Citation2020). While technologies to achieve zero CO2 emissions are available for some parts of the economy, zero CO2 emissions will be difficult to achieve quickly in a small number of sectors with technological change alone. These ‘critical sectors’ include aviation, shipping, road freight transport, and industry.
The four critical sectors are expected to have significant emission growth globally this century, even after applying foreseeable efficiency and technological improvements (EIA, Citation2016; ICAO, Citation2016; Lee, Citation2017; OECD/ITF, Citation2017). Decarbonisation challenges in the critical sectors include substantial expected growth in demand (Supplementary Information Figure 1 and Supplementary Information Table 1), and the lack of commercially available decarbonisation technologies or low-carbon operational practices. By contrast, other sectors, such as power, land-based passenger transport, buildings, and waste, have a range of tested and scalable emission-reduction opportunities (Davis et al., Citation2018; Luderer et al., Citation2018), although the barriers to implementing these opportunities are still substantial.
Table 1.
A summary of demand reduction options, their representation in IMAGE, and future steps.
The challenges for fully decarbonising each critical sector share important similarities. For instance, the aviation sector's own emissions analysis foresees substantial growth in global demand this century (ICAO, Citation2016). While improvements in energy efficiency are possible, the aviation industry expects growth in demand to outstrip gains in intensities, with emissions continuing to rise (Bows-Larkin et al., Citation2016; ICAO, Citation2016; Murphy et al., Citation2018). The sector's prevalent emphasis is on offsetting and CDR, in particular through the UN's Carbon Offsetting and Reduction Scheme for International Aviation (CORSIA) (Sustainable Aviation, Citation2020). While the dramatic decline in air travel due to the COVID-19 pandemic has ushered in much uncertainty about the future of aviation, the sector's representatives expect that the demand for air travel will return to its pre-pandemic level within two to three years (ICAO, Citation2020; Willis Re, Citation2020). Other evidence to support this view includes fast bounce-backs after previous epidemics such as SARS and MERS (ICAO, Citation2020; Tiwari et al., Citation2020), as well as after the financial crises (Johnson, Citation2020). However, after the COVID-19 shock, the sector is unlikely to be able to afford large financial investments in technological mitigation options such as alternative fuels and electrification. In any case, it is relatively difficult for aviation to benefit from electric propulsion (a decarbonisation option technically available to the non-critical sectors), while biofuels and hydrogen are unlikely to scale up swiftly (Balcombe et al., Citation2019; Ball & Wietschel, Citation2009; Bows-Larkin et al., Citation2016; Drews et al., Citation2020; Gilbert et al., Citation2018; Hileman & Stratton, Citation2014; Searle & Malins, Citation2015).
The shipping sector also expects significant growth in global demand (Lee, Citation2017). Energy efficiency improvements to ships are expected to bring some gains across the fleet but low-carbon shipping fuels are currently either not technologically advanced enough or not affordable at scale (Smith et al., Citation2015; Traut et al., Citation2018).
In road freight transport, emissions have been increasing globally despite improvements in the energy efficiency of trucks (IEA, Citation2017). Electrification of road freight is far behind that of passenger cars, with light and medium electric trucks only recently moving out of the demonstration stage (McKinsey, Citation2017).
Finally, the industry sector has had a long-standing focus on process efficiency to cut costs and is exhausting the potential for further emission reductions from efficiencies (Allwood, Citation2013). The energy-intensive parts of industry, such as steel production, are particularly challenging and expensive to decarbonise, due to their demand for high-temperature heat (Griffin et al., Citation2016; Hammond, Citation2013).
As an additional challenge, electrification of these critical (and indeed other) sectors is only useful if abundant and reliable low-carbon power is available (EPRI, Citation2018; Keller et al., Citation2019; Luh et al., Citation2020), which would require a technological feat of scaling up clean electricity generation multi-fold, unless demand for sectoral activity – and, hence, demand for electricity – is dramatically reduced. Even if low-carbon electricity were plentiful, activities such as cement production would still be difficult to decarbonise, due to emissions from the production process itself (Allwood et al., Citation2020). So, while the literature originating from these sectors predicts continuing growth, reductions in the sectors’ activities might be necessary to meet stringent decarbonisation targets.
Efforts to estimate the emission reduction potentials and costs of mitigation options have largely focused on technological supply-side options for all of the critical sectors (De Souza et al., Citation2018; Heitmann & Peterson, Citation2014; Jiang et al., Citation2020; Mulholland et al., Citation2018; Muratori et al., Citation2017; Parsa et al., Citation2019; Wise et al., Citation2017), with some exceptions highlighting the importance of demand reduction (Grubler et al., Citation2018; Kesicki, Citation2012; Vogl et al., Citation2020). Our definition of demand reduction options covers ‘avoid’ and ‘shift’ actions in the Avoid-Shift-Improve framework used in the IPCC's Fifth Assessment report (IPCC, Citation2014a), as these actions relate to consumers’ choice of whether ('Avoid') and how ('Shift') to travel and what goods to buy, rather than to technological innovations aimed at higher efficiencies ('Improve'). While demand reduction options are under-researched, it remains challenging to incorporate such options in both scenario modelling and policy planning. The main policy implication of under-representing demand reduction options in models is that such options might be overlooked by policy-makers, with policies encouraging investment in technological supply-side options instead, including technologies untested at scale, such as CDR.
Therefore, we apply a novel sectoral analysis framework using the latest literature on demand reduction options that can particularly assist in meeting the 1.5°C climate goal, and in improving the representation of critical sectors in scenario modelling. Demand reductions in the critical sectors become ever more important for avoiding excessive reliance on negative-emission technologies as emission reduction targets increase in stringency from 2°C to ‘well below 2°C’, including 1.5°C.
Focusing on CO2 emissions only, we use illustrative deep-mitigation emission scenarios for 1.5°C and 2°C, and a reference scenario, generated by the IMAGE integrated assessment model (IAM), as a learning tool for understanding the trends and drivers in the four critical sectors. Since IAMs represent technological options more thoroughly than demand reduction ones (Creutzig et al., Citation2016; Edelenbosch et al., Citation2017a; Edelenbosch et al., Citation2017b; Edenhofer et al., Citation2010; Luderer et al., Citation2018; Van Den Berg et al., Citation2019), we suggest specific recommendations on modelling the demand reduction options for the four critical sectors, to enable IAMs to better inform policy-making. To this end, we propose how the sectoral analysis framework can help to both improve modelling and track real-world emission cuts in the critical sectors. Tracking progress towards the decarbonisation needs for the 1.5°C and well below 2°C temperature goals is crucial for identifying options with the largest mitigation potential, highlighting challenges, assessing feasibility and quantifying the scale of further mitigation needs. This work adds to existing studies on hard-to-abate sectors in model-based scenarios (Creutzig et al., Citation2016; Edelenbosch et al., Citation2017a; Edelenbosch et al., Citation2017b; Luderer et al., Citation2018; Van Den Berg et al., Citation2019) and, more broadly, to the literature on evaluating IAMs and making them more policy-relevant (Forster et al., Citation2018; Lovins et al., Citation2019; Schwanitz, Citation2013; Trutnevyte et al., Citation2019).
2. Methods
2.1. Representation of the critical sectors in the IMAGE model
IMAGE is a partial equilibrium energy and land model focusing on multi-decadal scenarios, and the model's emission pathways compare to other IAMs (see Fricko et al. (Citation2017) and Supplementary Information Figure 2). We use an economy-wide model, rather than separate sector-specific models, as economy-wide models are better set up to represent cross-sector dynamics and interactions, thereby representing demand reduction options more fully (Mccarthy et al., Citation2018). The IMAGE model has separate modules for representing the critical sectors (Van Vuuren et al., Citation2017), including IMAGE Travel (Girod et al., Citation2012) and the industrial module (Van Ruijven et al., Citation2016). The Supplementary Information file contains detailed information on technological and cost assumptions used (Supplementary Information Tables 2–6 and Figures 3 and 4). In addition, summarises how modelling can capture demand reduction options for each of the critical sectors, given the way the IMAGE modules work.
This paper uses three illustrative IMAGE scenarios (1.5°C, 2°C and Reference) based on the Shared Socioeconomic Pathway 2 (SSP2). Using only one SSP constrains uncertainties as to alternative future development pathways (reference scenarios), but provides necessary focus for the empirical analysis of critical sectors under different climate targets, which is the aim of this paper. A list of the IMAGE variables used in this study can be found in Supplementary Information Table 7. The data is available as part of the Scenario Explorer dataset hosted by the International Institute for Applied Systems Analysis (IIASA) (Huppmann et al., Citation2019).
2.2. The Kaya Identity and sectoral analysis framework
As a starting point for deriving the sectoral analysis framework in , we use the Kaya Identity (Kaya, Citation1989) modified by Peters et al. (Citation2017), with the population component excluded:
where C is CO2 emissions, G is Gross Domestic Product, E/G is energy intensity of GDP, and C/E is CO2 intensity of energy. To adjust this economy-wide Kaya Identity to the level of sectors, we substitute GDP by sectoral activity. Peters et al. (Citation2017) further decompose the CO2 intensity of energy into a share of fossil fuel-derived energy and the CO2 intensity of this energy, and further break down each of these elements, respectively, into switching to renewable energy and switching to lower-carbon fossil fuels, as well as using carbon capture and storage. In our sectoral analysis framework (), levels 1 and 2 are relevant across all sectors and, hence, were adopted from the study by Peters et al. (Citation2017). The elements in levels 3 and 4 of the sectoral frameworks were selected based on a review of both peer-reviewed and grey literature on CO2 emission reductions in transport and industry.
Figure 1. A sectoral analysis framework for tracking progress in decarbonising critical sectors, adapted from Peters et al. (Citation2017). The decomposition indicators are in levels 1 and 2, while mitigation options and drivers are in levels 3 and 4. Acronyms: EV – electric vehicles; CCS – carbon capture and storage.
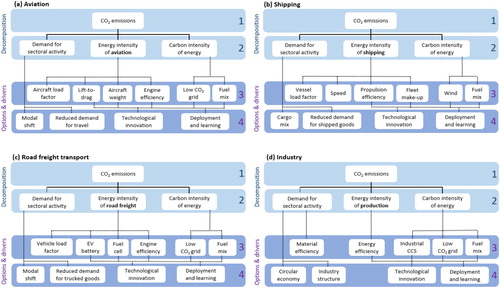
While following Peters et al. (Citation2017) in developing the sectoral framework, we do not use a formal decomposition analysis, where the change in the dependent variable is algorithmically analysed as a function of changes in the independent variable. Instead, we use IMAGE output for carbon intensity, energy intensity and sectoral activity. As we do not calculate the contributions of the individual components to the total emissions in the model, it is not a decomposition analysis in the formal methodological sense. Instead, our decomposition is descriptive. Therefore, throughout this paper, we refer to ‘a decomposition’ but not a formal decomposition analysis.
We develop and apply Peters et al.'s (Citation2017) nested version of the Kaya Identity to the critical sectors. Based on the broad literature research, the sectoral analysis framework shows how the Kaya Identities relate to sectoral mitigation options and drivers. The framework has four levels. Levels 1 and 2 present a hierarchical decomposition, with level 2 combining an indicator of sectoral activity, one of energy intensity, and one of CO2 intensity. Levels 3 and 4 are potential mitigation options and drivers, and these are not formally additive. We use the framework to connect the IMAGE model decomposition results (at levels 1 and 2, in Section 3.3), to the state-of-the-art research on the sectoral mitigation options (at levels 3 and 4, in Section 3.4).
After providing a quantitative decomposition of the critical sectors using the IMAGE scenarios (levels 1 and 2 of the critical analysis framework), we analyse potential options and drivers in decarbonising these sectors (levels 3 and 4) as follows:
We discuss the aspects of levels 1 and 2 that most stood out in the decomposition and analyse how the model's projections could be delivered in the real world;
We use the sectoral analysis framework to identify which mitigation options are available in addition to those included in the IMAGE scenarios; and,
We include, where available, quantitative information from the literature on the potentials of the mitigation options for reducing emission intensities, energy intensities and demand. The quantified potentials here are not additive, as they have been estimated through a variety of methods and would have non-linear impacts on the energy system if implemented.
3. Results and discussion
3.3. Decomposition of the critical sectors in the IMAGE scenarios
We use IMAGE as a learning tool to illustrate possible mitigation strategies. For levels 1 and 2 of our sectoral analysis framework, we examine how CO2 emissions in the four critical sectors are characterised in the IMAGE scenarios out to 2100. As the 1.5°C scenario entails earlier and higher annual emission reduction rates than the 2°C scenario (a and Supplementary Information Figure 1), we identify which drivers lead to additional mitigation, particularly over the short term.
Figure 2. Changes in sectoral CO2 emissions compared to year 2005 (in percent) and their associated level 2 indicators of the sectoral analysis framework () for the critical sectors as represented in the IMAGE model for (a) the Reference, (b) the 2°C, and (c) the 1.5°C scenarios. ‘Service demand’ is sectoral activity. The shaded areas are the historical parts of the graphs. Absolute values are presented in Supplementary Figure 1 and Supplementary Table 1.
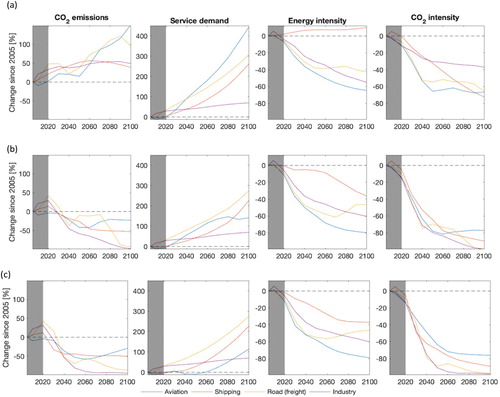
There are distinct trends in the decomposition indicators that result from differences between the scenarios. Without climate policy, CO2 emissions are projected to grow rapidly in aviation and road freight transport, mostly driven by a rapid increase in demand for sectoral activity (a and Supplementary Information Figure 1). Slower growth in demand for sectoral activity in the 1.5°C scenario compared to 2°C allows for additional mitigation between 2020 and 2050 for all sectors (Supplementary Information Figure 6) except industry where activity levels are coupled to assumed growth in income. By 2100, changes in the level 2 decomposition indicators for the 2°C scenario catch up with the changes for the 1.5°C scenario (). For energy intensity, the disparity between sectors is wider than for CO2 intensity in both low-carbon scenarios. Shipping is particularly slow at reducing its energy intensity. For aviation, road freight and industry, energy efficiency improvements are pursued so extensively both in the Reference scenario and in the 2°C scenario that the energy intensity indicator has little further potential for the 1.5°C climate goal in these three sectors. As activity levels grow substantially compared to the current level in all of the critical sectors (), there are significant opportunities for decarbonisation through reducing sectoral activity. Levels 3 and 4 of the sectoral analysis framework () provided in the next section help understand these projected sectoral trends.
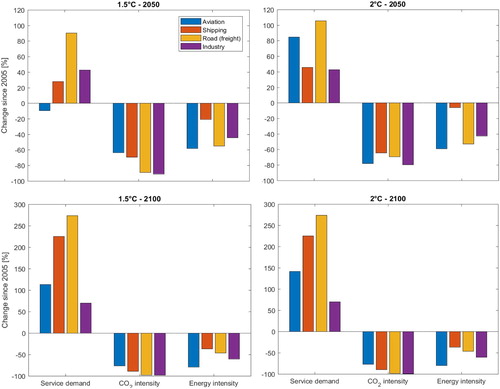
Figure 3. Changes in the level 2 of the sectoral analysis framework (), including service demand per capita, CO2 intensity and energy intensity, in 2050 and 2100 compared to 2005 (in percent) for the critical sectors as represented in the IMAGE model for the 1.5°C and 2°C scenarios. Absolute values are presented in Supplementary Figure 7.
3.4. Options and drivers for decarbonising the critical sectors
3.4.1. Aviation
In IMAGE, the aviation sector's deep mitigation relies not only on efficiency improvements and alternative fuels, but also on slower growth in sectoral activity by 2050, particularly in the 1.5°C scenario (Supplementary Information Figure 1). One key reason is that deep decarbonisation in the aviation sector is likely feasible in the required timeframe only if air travel decreases in some markets, particularly given an expectation of growth in industrialising nations (Bows-Larkin et al., Citation2016). To achieve CO2 intensity improvements envisioned by the low-carbon scenarios, development and deployment of low-CO2 fuels, such as hydrogen and synthetic paraffinic kerosene (a type of biofuel), are needed (Flade et al., Citation2016; Rheaume & Lents, Citation2016) (level 3 in ). However, there are concerns about the costs, energy density and wider sustainability impacts of such fuels (Bows-Larkin et al., Citation2016; Drews et al., Citation2020; Hileman & Stratton, Citation2014; Searle & Malins, Citation2015). In addition, reducing weight, increasing aircraft lift-to-drag ratios, and improving engine efficiency (Szodruch et al., Citation2011), together with more seamless air traffic management and reduced cruising speed (Graham et al., Citation2014), can deliver incremental reductions in energy intensity (Schäfer et al., Citation2016).
For additional mitigation, reducing CO2 intensity in the aviation sector would still be insufficient without some form of demand management, including behavioural changes (Graham et al., Citation2014), showing the importance of level 4 for the 1.5°C goal. Alternative energy sources, including low-carbon electricity, are not readily available for typical civilian aircraft, given the crucial role of safety in aircraft design, practicalities associated with low fleet turnover rates and propulsive power requirements for large aircraft. Therefore, a modal shift (level 4 in ) away from air transport, for example to high-speed trains, is the main option to deliver further large reductions in CO2 emissions (Bows-Larkin, Citation2015). With many people used to the current affordability, flexibility and speed of air travel, passenger acceptance will be a significant barrier to modal shifts and lower cruising speed particularly in wealthy nations (Graham et al., Citation2014).
As to quantifying the mitigation potential of the options, operational measures such as reduced time spent taxiing and continuous descent approaches can reduce fuel use by up to 5% per flight (CCC, Citation2009), although some of these theoretical savings may already have been realised (NATS, Citation2018). Using turboprops instead of narrow-body aircraft for short-haul flights can save at least 13% of fuel per flight (Graham et al., Citation2014). Circular economy measures for this sector have not been extensively quantified yet, and overlap with the industry sector. For instance, Huang et al. (Citation2016) estimate that light-weighting aircraft parts through additive manufacturing could save up to 215 MtCO2eq across the fleet by 2050. In terms of carbon prices, all air traffic management measures combined can bring net benefits from -US$57/tCO2 to -US$105/tCO2, while the feasibility of biofuels depends on the price of jet fuel (Parsa et al., Citation2019; Schäfer et al., Citation2016). We could not locate quantitative research on large-scale modal shifts and demand reduction in aviation, except during the COVID-19 lockdown, which is not representative of long-term conditions. Studies tend to focus on incremental changes in price (e.g. a carbon price of US$17Footnote1), showing that demand is not sensitive to such changes (Markham et al., Citation2018), particularly for long-haul and business trips (Larsson et al., Citation2019), although more significant price increases or a limit to airport expansion could yet suppress demand.
Among the studies on Marginal Abatement Cost (MAC) curves for aviation, Kesicki (Citation2012) is a rare exception considering demand reduction alongside technological supply-side options. However, this study suggests that the mitigation potential of demand reduction options is low, despite recognising their importance for the critical sectors (ibid.). The marginal abatement costs for demand reduction vary from near zero to above US$318/tCO2 (ibid.), with the positive number suggesting that the study might not be distinguishing clearly between options reducing demand for energy and those reducing demand for sectoral activity. Other research includes an operational strategy related to demand reduction, namely higher load factor arising from reduced flight frequency, at net benefit of -US$115/tCO2 (Parsa et al., Citation2019; Schäfer et al., Citation2016). These authors also list ‘positive economic measures’ such as green taxes and carbon tax that might change people's behaviour and hence demand, but there is no MAC estimate for those measures.
3.4.2. Shipping
In IMAGE, the shipping sector's deep mitigation relies increasingly on changes in energy intensity between 2030 and 2040, particularly when moving from the 2°C to 1.5°C scenario (Supplementary Information Figure 1). To achieve the energy intensity improvements envisioned by the low-carbon scenarios, shipping has a wide range of options, including improving vessels’ propulsion efficiency (Bows-Larkin et al., Citation2014; Lindstad et al., Citation2011). Slow steaming (level 3 in ), i.e. deliberately reducing the speed of a ship, can take place immediately. However, due to concerns over competitiveness and necessary adjustments to supply chains (Lindstad et al., Citation2011), it is generally only used in response to changing economic conditions, such as during the global economic crisis of 2008 (Mander, Citation2017; Nelissen et al., Citation2016). Reductions in CO2 intensity can be achieved through wind-assisted propulsion (Traut et al., Citation2014), and alternative fuels such as biofuels, hydrogen and ammonia, although such fuels are likely to have other lifecycle impacts on land-use and emissions (Balcombe et al., Citation2019; Gilbert et al., Citation2018). Critically for shipping, when compared with aircraft, it is feasible to retrofit existing ships with low-carbon technologies, and given the timeframe for rapid decarbonisation, this will be an important and essential aspect of the mitigation effort for this sector (Bullock et al., Citation2020).
For additional mitigation, it would be necessary to reduce demand for international shipping (level 4 in ). Slow steaming stands out as a mitigation option, reducing both demand for energy and demand for sectoral activity. In addition, successful mitigation implies a move away from fossil fuels that constitute around 45% of global shipped trade by weight (UNCTAD, Citation2015). Therefore, demand for shipping such commodities would fall in response to successful decarbonisation over the coming decades and would be only partly replaced by bioenergy trade, mainly due to a more equal geographical distribution of biomass resources than of fossil fuel resources (Sharmina et al., Citation2017; Walsh et al., Citation2019). These changes would lead to even larger adjustments in supply chains than slow steaming would (Lindstad et al., Citation2011) and emphasise the unhelpful fragmentation of the sector between ship owners and ship charterers (Eide et al., Citation2011; Heitmann & Peterson, Citation2014).
As to quantifying the mitigation potential of the options, slow steaming and biofuels can reduce emissions from the shipping sector by 31–36% (Eide et al., Citation2011; Mander, Citation2017) and 57–79% (Gilbert et al., Citation2018) respectively. Wind-assisted propulsion could deliver more than 50% of energy required by a ship's main engine when slow steaming (Traut et al., Citation2014). Emission reductions from hydrogen would depend on whether its production uses low-carbon electricity (Gilbert et al., Citation2018). Electric propulsion is being trialled on a small scale and depends on battery costs, while nuclear propulsion faces the challenges of safety, skills, legislation and public perception (Balcombe et al., Citation2019). It is difficult to estimate potential emission reductions from reduced demand for shipping, but they might be significant if, for example in line with low-carbon scenarios (IPCC, Citation2014b), the amount of shipped oil is reduced by a quarter and the amount of shipped coal is halved by 2050 compared to the current levels (Sharmina et al., Citation2017).
Among the studies on MAC curves for shipping, we located no research on large-scale demand-side reduction options. However, some of them did quantify slow steaming as part of operational measures, commenting that such measures have moderate costs and low mitigation potential (Heitmann & Peterson, Citation2014). Numbers are not disaggregated for different measures, but slow steaming is located within the calculated narrow price range of US$34.5–35.7/tCO2 (ibid.). By contrast, Yuan et al. (Citation2016) show that slow steaming has the highest abatement potential among all of the operational and even technical measures: between 19% and 36% of the total calculated potential from reducing speed by 10% and 20% respectively. While it is a cost-efficient option on its own yielding a net benefit ranging from -US$250/tCO2 to -US$2,500/tCO2, when the need to buy new vessels to deliver the same amount of shipped trade is incorporated, it becomes the most expensive option (ibid.).
3.4.3. Road freight transport
In IMAGE, the road freight sector's deep mitigation mainly relies on changes in CO2 intensity by 2050 in the 1.5°C scenario, with the 2°C scenario catching up by 2100, particularly compared to the Reference scenario (Supplementary Information Figure 1). To achieve the CO2 intensity improvements envisioned by the low-carbon scenarios, road freight transport has a short-term option to use biodiesel or alcohol fuels such as bioethanol (Kampman et al., Citation2013), with no change needed to road transport infrastructure (level 3 in ). However, biofuel supplies are limited and required by other sectors. While freight vehicles cannot be light-weighted to the same extent as passenger cars, energy intensity of road freight can decrease significantly.
For additional mitigation, further energy intensity improvements could be achieved through optimising routes, linking trucks in a convoy and maximising load factors (IEA, Citation2017). Greening et al. (Citation2019) argue that articulated lorries will need to be electrified if the road freight sector is to reduce its CO2 emissions by 80% by 2050 from 1990 levels. While some studies claim that the use of batteries for road freight is feasible at scale (Phadke et al., Citation2019), others are cautious (Fulton et al., Citation2015; Greening et al., Citation2019; Mai et al., Citation2018; McKinsey, Citation2017). For light and medium trucks, an extensive use of batteries by mid-century is possible, whereas heavy trucks would benefit most from developments in hydrogen fuel cells (Keller et al., Citation2019), although fuel cells are considered less advantageous than biofuels for long-haul truck ranges (Fulton et al., Citation2015). Widespread use of hydrogen is more likely in freight than passenger vehicles, because freight vehicles have more storage capacity for this fuel. Reductions in freight demand, for example through localising the production and storage of goods (level 4 in ), could alleviate the burden on the CO2 intensity and energy intensity indicators. However, shorter trip distances would need to be combined with high utilisation rates for vehicles, extrapolating from research findings on passenger transport (Schäfer & Yeh, Citation2020). To reduce the need for transporting goods, consumption habits and supply chains would have to undergo major changes, which would be challenging to capture in modelling. Modal shift to rail or inland waterways may be possible in some regions but would require additional infrastructure to accommodate high volumes of freight.
As to quantifying the mitigation potential of the options, a programme to improve the efficiency of freight vehicles through light-weighting, low-resistance tyres, maximising aerodynamics, reduction of power use for auxiliary services, and waste heat recovery, could double the fuel efficiency of conventional trucks (Freightliner, Citation2015). The ‘physical Internet’ system where logistics information would be openly shared (Montreuil, Citation2011) could improve efficiency across the system by 20% but would require unprecedented collaboration across supply chains (IEA, Citation2017; Mulholland et al., Citation2018). Researchers estimate a potential reduction in greenhouse gases (GHGs) of up to 60% by 2050 from combining improvements in efficiency, logistics and alternative fuels (Mulholland et al., Citation2018). As with the shipping sector, emission reductions from hydrogen would depend on whether it is produced and liquefied using low-carbon energy. Few studies focus on circular economy measures for transport, overlapping with the industry sector where quantitative assessments are available. For example, material substitution as part of light-weighting for heavy duty vehicles has a small mitigation potential of up to 7.5% of the mainly technological supply-side options, but rarely breaks even or is at the higher cost end of the MAC curves, at up to US$466/tCO2 (Schroten et al., Citation2012). Remanufacturing has a higher mitigation potential than material substitution, with a potential to cut lifecycle GHG emissions by up to 70% compared to a new engine (Hertwich et al., Citation2019).
Among the studies on MAC curves for road freight transport, research is, again, focused on technological supply-side options, based both on our own search and a systematic literature review by Jiang et al. (Citation2020). Such options are limited to improving CO2 intensity and energy intensity. Efficiency can be improved at low or negative carbon prices, while alternative fuels might need carbon prices in excess of US$100/tCO2eq. (IPCC, Citation2014a; OECD/ITF, Citation2010), with the average cost of emission reductions negative at -US$4 to -US$20/tCO2eq. (OECD/ITF, Citation2010). Fuel cells for road freight lead to an estimated abatement cost of US$55/tCO2eq., while for batteries the abatement costs vary from US$126/tCO2eq. to nearly US$1,400/tCO2eq. depending on the grid's fuel mix (Keller et al., Citation2019).
3.4.4. Industry
In IMAGE, the industry sector's deep mitigation mainly relies on changes in CO2 intensity after 2030 in the 1.5°C scenario, and after 2060 in the 2°C scenario, particularly compared to the Reference scenario (Supplementary Information Figure 1). To achieve CO2 intensity improvements envisioned by the low-carbon scenarios, industry can use fuel switching in the short term and carbon capture and storage (CCS) in the long term (level 4 in ), although CCS is expected to add costs (Hammond, Citation2013) and has significantly higher lifecycle emissions than previously thought (Hammond & O'Grady, Citation2014). While energy intensity improvements can contribute to further emission reductions, the industry sector is already highly energy efficient (Allwood, Citation2013).
For additional mitigation, the potential of demand reduction remains untapped when moving from the Reference pathway to 2°C to 1.5°C. Studies acknowledge the technological limits of powering this sector with electricity (Luh et al., Citation2020; Vercoulen et al., Citation2018; Vine & Ye, Citation2018), compared to, for example, the transport sector (Mai et al., Citation2018), and suggest an increased use of natural gas (EPRI, Citation2018; Luh et al., Citation2020) or even a reduction in the sector's output in line with available low-carbon electricity (Allwood et al., Citation2020). Decarbonisation for 1.5°C, avoiding heavy reliance on bioenergy and low-carbon electricity needed in other sectors, requires a re-design of industrial processes to achieve a more efficient use of resources, and hence reductions in demand for sectoral activity, through material efficiency and the circular economy (Allwood et al., Citation2011; Allwood et al., Citation2020; Ellen MacArthur Foundation, Citation2014; Milford et al., Citation2013) (levels 3 and 4 in ). Changes in industry structure, as production shifts towards light industry, would also lead to some decarbonisation, although these changes might be difficult to incorporate in modelling. The key components of the industry sector (iron & steel, aluminium, cement, pulp & paper, and plastics) could reduce emissions through light-weighting, extension of lifecycle, non-destructive recycling, and material substitution (Allwood et al., Citation2010). A key challenge to implementing these options is the required unprecedented restructuring of supply chains and international trade (Cooper et al., Citation2017). More fundamentally, the circular economy approach might challenge the necessity of economic growth relying on virgin materials (Pauliuk & Müller, Citation2014) as well as the necessity of owning products as opposed to sharing them (Allwood et al., Citation2020).
As to quantifying the mitigation potential of the options, material efficiency can save an estimated 43% of the current CO2 emissions embodied in the manufacturing of vehicles through reducing and reusing steel and other metals (Allwood et al., Citation2020; Scott et al., Citation2018). Other research suggests that material efficiency is already well utilised in industry overall and would yield less than 10% of CO2 emission reductions (Pauliuk & Müller, Citation2014). Material substitution might have a significantly higher mitigation potential than material efficiency. For example, using bio-derived alternatives for polyethylene terephthalate (PET) could save up to 55% of GHG emissions (Eerhart et al., Citation2012) and up to 86% for chemical products (Adom et al., Citation2014). Closed-loop supply chains applied to PET components in cars could save up to 73% of CO2 emissions (Chavez & Sharma, Citation2018), while increasing current recycling rates by six percentage points could save CO2 emissions by 20% by 2040 (IEA, Citation2020). Circular economy measures as a package could help achieve ‘the 2°C benchmark’ in the sector (Pauliuk & Müller, Citation2014) and to bridge around 50% of the economy-wide emission gap between a business-as-usual pathway and nations’ Paris Agreement commitments (Blok et al., Citation2016). However, circular economy options can increase emissions in some cases and might need to be evaluated on a lifecycle basis case by case (Gallego-Schmid et al., Citation2020). It is evident that circular-economy options often cut across several sectors that are part of or adjacent to industry, including manufacturing, transport, building materials and construction, and plastics (Rissman et al., Citation2020), so should be tracked and implemented at a systems level.
Among the studies on MAC curves, research is scarcer for industry than for the other critical sectors and, again, focused on technological supply-side options (Jiang et al., Citation2020). For example, replacing natural gas and fuel oil with a low-carbon energy source such as ethanol is at the expensive end of the curve, with carbon prices at US$390/tCO2 and US$284/tCO2 respectively (De Souza et al., Citation2018). Improvements in energy intensity, on the other hand, can be achieved at net benefit of -US$122/tCO2 (ibid.), and create co-benefits ranging from US$3/tCO2 to US$39/tCO2 (Yang et al., Citation2013). The use of CCS for industrial processes is estimated to be one of the most expensive technological supply-side options, at an estimated US$29/tCO2 excluding the cost of transporting and storing CO2 (De Souza et al., Citation2018), and up to US$70/tCO2 (Leeson et al., Citation2017), with a caveat that information on this technology is perhaps too limited to have confidence in the estimates.
3.4.5. Future steps for modelling and policy targeting the critical sectors
Using the sectoral analysis framework to unpick the IMAGE scenario modelling clearly shows that demand reduction measures enhance mitigation potentials in the four critical sectors. This finding has implications for policy advice arising from such modelling. In we summarise the demand reduction options for each sector, possible next steps for their integration in IMAGE and global IAMs more generally, and policy recommendations arising from our synthesis of literature.
4. Conclusions
We find that, in line with other IAMs, most of the mitigation effort in the 1.5°C and 2°C IMAGE illustrative scenarios for the four critical sectors comes from deep cuts in CO2 intensity, delivered through low-carbon energy sources and associated technologies, together with higher energy efficiency. To increase the chances of achieving net zero CO2 emissions, through diversifying a range of mitigation options, demand for each sector's activities needs to be reduced. Our analysis shows that additional mitigation opportunities do exist and need to be better represented in modelling and more consistently implemented in practice. Such mitigation opportunities include modal shift for aviation, slow steaming for shipping, local production of goods for road freight transport, and circular economy for the industry sector. Analysis of demand reduction options for decarbonisation is therefore an important complement to models to ensure that the full portfolio of mitigation options can inform policy decisions.
In IMAGE, such demand reduction options are currently represented in a stylised way through price elasticities and, in the transport sector, through the travel money budget concept. Climate policy, using a carbon price, would increase the price of carbon-intensive travel, therefore the demand for air travel would be expected to be supressed if the price signal were sufficient (Schafer & Victor, Citation2000). However, as evident in the model results, this effect tends to be small due to aviation's CO2 emissions being associated with a small percentage of the global population. Carbon prices in the modelled industry sector would affect production costs and incentivise material efficiency, for example in the cement and steel sub-sectors. Such elasticities are based on the past: a comparison of implicit transport elasticities of several IAMs with historical data shows that, in general, models and the empirical data agree (Edelenbosch et al., Citation2017c). Furthermore, policies that affect consumers’ demand through non-price mechanisms could be better represented (Mccarthy et al., Citation2018). For rapid decarbonisation going beyond the past and current trends, the demand reduction options identified here could be assessed through scenario analysis, which for these specific mitigation measures might be more suitable than carbon prices and elasticities. Examples of specific demand reduction options modelled as scenarios, rather than dynamically, include lifestyle changes (Van Sluisveld et al., Citation2016), improvements in energy-service efficiency (Grubler et al., Citation2018), and access to clean air, water and energy, which, according to modelling, leads to lower sectoral activity (Van Vuuren et al., Citation2017). Estimating the economic, environmental and social impacts of the demand reduction options that are currently under-represented or only implicitly included in models is an important area for future research. We also note that future studies in this area need to draw a clear distinction between options for reducing energy demand (achievable through the ‘Improve’ and ‘Shift’ actions of the IPCC's Avoid-Shift-Improve framework (IPCC, Citation2014a)) and options for reducing service demand (mainly achievable through the ‘Avoid’ actions). Another important avenue for research would arise if the impact of COVID-19 on the aviation sector turns out to be a long-term trend. In this case, many modelling exercises would need to be revisited, potentially through an ensemble of models rather than individual IAMs, given the vast uncertainty involved, and with feedbacks affecting not only the aviation sector but the entire economy.
Economy-wide modelling insufficiently characterises the potential contribution of demand reduction to cutting CO2 emissions in the four critical sectors. This issue can lead to poorly informed policy choices that focus predominantly on technology-driven opportunities, rather than on those reducing or slowing down sectoral activity. As a priority, options for mitigating emissions through driving down demand for air travel, reducing shipping speed to cut the energy consumed, reduced transportation of fossil fuels, and circular economy measures for industry should be readily available and well parameterised within models.
In practice, the identified mitigation options face deep structural challenges. For the sectoral activity indicator in the sectoral analysis framework (), significant reductions in demand, both for travel and for industrial outputs, would require disruptive changes in logistics and, for some, in lifestyle. Real and perceived adverse impacts of reducing sectoral activity on GDP and human wellbeing are a barrier to both modelling and adopting such measures in practice. The winding down of sectoral activity through reduced demand is likely to be delayed by associated lobby groups and would contribute to unemployment and the need for mass retraining programmes. For the energy intensity indicator, slow steaming in shipping might be uncompetitive unless adopted by all, whereas the introduction of electric and hydrogen fuel cell trucks would need substantial investment in infrastructure. For the CO2 intensity indicator, the key barriers are potentially high lifecycle emissions of alternative fuels and the sustainable availability of biomass for electricity, heat and transport fuels, needed across the entire economy beyond the four sectors.
To put the identified mitigation options in practice, policies should encourage a culture where alternatives to frequent air travel for leisure and business are acceptable and mainstream. Incentives should target travel by the transport modes that have a high potential for decarbonisation, with greater connectivity provided between such modes. Replacing the majority of business travel with online interactions is both possible and affordable, as the experience during the COVID-19 lockdown has demonstrated. Incentives for distributed manufacturing and local storage would reduce the need for freight, both by ship and truck. Speed restrictions imposed at the International Maritime Organisation level could produce immediate reductions in emissions from international shipping. Other regulatory measures should include tightening standards for material use in the industry sector.
We argue that tracking CO2 intensity, energy efficiency and demand for sectoral activity, as well as the underlying drivers, across all critical sectors, is an urgent necessity. In other words, the tracking of mitigation progress should go beyond the existing monitoring of absolute CO2 emissions, as our sectoral analysis framework () shows. Monitoring and coordinating mitigation progress consistently across nations and years would best be done by an international agency such as the United Nations, whose Framework Convention on Climate Change (UNFCCC) already has the infrastructure to do so. Therefore, we call for reporting requirements under the UNFCCC and Paris Agreement to be expanded to include key elements of the sectoral analysis framework.
Our recommendation to monitor the Kaya-related indicators in each of the critical sectors is an important adjustment to the current system of tracking and reporting emissions, but could be implemented swiftly, building on the existing UNFCCC reporting provisions. Other policy recommendations, such as reductions in demand for sectoral activity, indeed imply a more radical change. What policy conditions do we need to create, or to advise on, in order to ensure implementation? Key to progress is introducing policy recommendations at just the right time to be able to take advantage of momentum. The ongoing COVID-19 upheaval has seen multiple calls to avoid returning to the old normal, but rather to invest in low-carbon measures for economic recovery in order to ‘build back better’ (UN, Citation2020), thereby boosting the political feasibility of our policy recommendations.
For these reasons, we were disappointed to see recent policy recommendations from influential bodies (CCC, Citation2020; Energy, Citation2020; IEA, Citation2020) to build a low-carbon recovery from the COVID-19 shock almost entirely on technological supply-side options. Given the contested feasibility and future scenarios of mitigation (Low & Schäfer, Citation2020) and the enormity of the 1.5–2°C challenge, we argue that it is appropriate and necessary to diversify mitigation options, particularly related to demand, in order to increase the resilience of the world's mitigation effort. Without substantial demand reductions in the critical sectors of transport and industry, the burden of decarbonisation will shift towards the offsetting role of CDR technologies (Vaughan et al., Citation2018; Workman et al., Citation2020). A deep and rapid decarbonisation of the critical sectors discussed here would reduce reliance on such technologies that carry substantial risks and are yet to be demonstrated at scale.
Supplemental Material
Download MS Word (5.6 MB)Acknowledgements
The authors are grateful to the UK Department for Business, Energy and Industrial Strategy for funding this research (grant number OJEU - CR16131BEIS). Additionally, E.W.L. acknowledges support from the Natural Environment Research Council (grant number NE/P019951/1).
Disclosure statement
No potential conflict of interest was reported by the authors.
Additional information
Funding
Notes
1 Where MAC values were expressed in values other than US$, we converted them to US$ for comparability using the Bank of England exchange rates from 24 September 2020.
References
- Adom, F., Dunn, J. B., Han, J., & Sather, N. (2014). Life-cycle fossil energy consumption and greenhouse gas emissions of bioderived chemicals and their conventional counterparts. Environmental Science & Technology, 48(24), 14624–14631. https://doi.org/10.1021/es503766e
- Allwood, J. M. (2013). Transitions to material efficiency in the UK steel economy. Philosophical Transactions. Series A, Mathematical, Physical, and Engineering Sciences, 371, 20110577–20110577. https://doi.org/10.1098/rsta.2011.0577
- Allwood, J. M., Ashby, M. F., Gutowski, T. G., & Worrell, E. (2011). Material efficiency: A white paper. Resources, Conservation and Recycling, 55(3), 362–381. https://doi.org/10.1016/j.resconrec.2010.11.002
- Allwood, J. M., Cullen, J. M., & Milford, R. L. (2010). Options for achieving a 50% cut in industrial carbon emissions by 2050. Environmental Science & Technology, 44(6), 1888–1894. https://doi.org/10.1021/es902909k
- Allwood, J. M., Dunant, C. F., Lupton, R. C., Cleaver, C. J., Serrenho, A. C. H., Azevedo, J. M. C., Horton, P. M., Clare, C., Low, H., Horrocks, I., Murray, J., Lin, J., Cullen, J. M., Ward, M., Salamati, M., Felin, T., Ibell, T., Zho, W., & Hawkins, W. (2020). Absolute zero: Delivering the UK’s climate change commitment with incremental changes to today’s technologies. UK FIRES.
- Balcombe, P., Brierley, J., Lewis, C., Skatvedt, L., Speirs, J., Hawkes, A., & Staffell, I. (2019). How to decarbonise international shipping: Options for fuels, technologies and policies. Energy Conversion and Management, 182, 72–88. https://doi.org/10.1016/j.enconman.2018.12.080
- Ball, M., & Wietschel, M. (2009). The future of hydrogen – opportunities and challenges. International Journal of Hydrogen Energy, 34(2), 615–627. https://doi.org/10.1016/j.ijhydene.2008.11.014
- Blok, K., Hoogzaad, J., Ramkumar, S., Ridley, A., Srivastav, P., Tan, I., Terlouw, W., & De Wit, M. (2016). Implementing circular economy globally makes Paris targets achievable. Ecofys; Circle Economy, 1–18. https://circulareconomy.europa.eu/platform/en/knowledge/implementing-circular-economy-globally-makes-paris-targets-achievable
- Bows-Larkin, A. (2015). All adrift: Aviation, shipping, and climate change policy. Climate Policy, 15(6), 681–702. https://doi.org/10.1080/14693062.2014.965125
- Bows-Larkin, A., Mander, S., Gilbert, P., Traut, M., Walsh, C., & Anderson, K. (2014). High seas, high stakes - high seas project final report. Tyndall Centre for Climate Change Research, 1–44. https://www.research.manchester.ac.uk/portal/en/publications/high-seas-high-stakes(70dd653a-6ef8-4e06-a18f-9a8ee28d7d3b).html
- Bows-Larkin, A., Mander, S., Traut, M., Anderson, K., & Wood, F. R. (2016). Aviation and climate change–The continuing challenge. In R. Blockley & W. Shyy (Eds.), Encyclopedia of Aerospace Engineering. Wiley-Blackwell Publishing. https://doi.org/10.1002/9780470686652.eae1031
- Bullock, S., Mason, J., Broderick, J., & Larkin, A. (2020). Shipping and the Paris climate agreement: A focus on committed emissions. BMC Energy.
- CCC. (2009). Meeting the UK aviation target – options for reducing emissions to 2050. Committee on Climate Change.
- CCC. (2020). Reducing UK emissions: 2020 progress report to Parliament. Committee on Climate Change.
- Chavez, R., & Sharma, M. (2018). Profitability and environmental friendliness of a closed-loop supply chain for PET components: A case study of the Mexican automobile market. Resources, Conservation and Recycling, 135, 172–189. https://doi.org/10.1016/j.resconrec.2017.10.038
- Cooper, S. J. G., Giesekam, J., Hammond, G. P., Norman, J. B., Owen, A., Rogers, J. G., & Scott, K. (2017). Thermodynamic insights and assessment of the 'circular economy'. Journal of Cleaner Production, 162, 1356–1367. https://doi.org/10.1016/j.jclepro.2017.06.169
- Creutzig, F., Fernandez, B., Haberl, H., Khosla, R., Mulugetta, Y., & Seto, K. C. (2016). Beyond technology: Demand-side Solutions for Climate change mitigation. 41, 173–198. https://doi.org/10.1146/annurev-environ-110615-085428
- Davis, S. J., Lewis, N. S., Shaner, M., Aggarwal, S., Arent, D., Azevedo, I. L., Benson, S. M., Bradley, T., Brouwer, J., Chiang, Y.-M., Clack, C. T. M., Cohen, A., Doig, S., Edmonds, J., Fennell, P., Field, C. B., Hannegan, B., Hodge, B.-M., Hoffert, M. I., … Caldeira, K. (2018). Net-zero emissions energy systems. Science, 360(6396), eaas9793. https://doi.org/10.1126/science.aas9793
- De Souza, J. F. T., De Oliveira, B. P., Ferrer, J. T. V., & Pacca, S. A. (2018). Industrial low carbon futures: A regional marginal abatement cost curve for Sao Paulo, Brazil. Journal of Cleaner Production, 200, 680–686. https://doi.org/10.1016/j.jclepro.2018.07.206
- Drews, M., Larsen, M. A. D., & Peña Balderrama, J. G. (2020). Projected water usage and land-use-change emissions from biomass production (2015–2050). Energy Strategy Reviews, 29, 100487. https://doi.org/10.1016/j.esr.2020.100487
- Edelenbosch, O. Y., Kermeli, K., Crijns-Graus, W., Worrell, E., Bibas, R., Fais, B., Fujimori, S., Kyle, P., Sano, F., & Van Vuuren, D. P. (2017a). Comparing projections of industrial energy demand and greenhouse gas emissions in long-term energy models. Energy, 122, 701–710. https://doi.org/10.1016/j.energy.2017.01.017
- Edelenbosch, O. Y., Mccollum, D. L., Van Vuuren, D. P., Bertram, C., Carrara, S., Daly, H., Fujimori, S., Kitous, A., Kyle, P., Ó Broin, E., Karkatsoulis, P., & Sano, F. (2017b). Decomposing passenger transport futures: Comparing results of global integrated assessment models. Transportation Research Part D: Transport and Environment, 55, 281–293. https://doi.org/10.1016/j.trd.2016.07.003
- Edelenbosch, O. Y., Van Vuuren, D. P., Bertram, C., Carrara, S., Emmerling, J., Daly, H., Kitous, A., Mccollum, D. L., & Saadi Failali, N. (2017c). Transport fuel demand responses to fuel price and income projections: Comparison of integrated assessment models. Transportation Research Part D: Transport and Environment, 55, 310–321. https://doi.org/10.1016/j.trd.2017.03.005
- Edenhofer, O., Knopf, B., Barker, T., Baumstark, L., Bellevrat, E., Chateau, B., Criqui, P., Isaac, M., Kitous, A., Kypreos, S., Leimbach, M., Lessmann, K., Magné, B., Scrieciu, S., Turton, H., & Vuuren, D. V. (2010). The Economics of Low Stabilization: Model comparison of mitigation strategies and costs. The Energy Journal, 31, 11–48. www.jstor.org/stable/41323490
- Eerhart, A. J. J. E., Faaij, A. P. C., & Patel, M. K. (2012). Replacing fossil based PET with biobased PEF; process analysis, energy and GHG balance. Energy & Environmental Science, 5(4), 6407–6422. https://doi.org/10.1039/c2ee02480b
- EIA. (2016). International energy Outlook 2016. U.S. Energy Information Administration.
- Eide, M. S., Longva, T., Hoffmann, P., Endresen, Ø, & Dalsøren, S. B. (2011). Future cost scenarios for reduction of ship CO2 emissions. Maritime Policy & Management, 38(1), 11–37. https://doi.org/10.1080/03088839.2010.533711
- Ellen Macarthur Foundation. (2014). Towards the circular economy Vol. 3: Accelerating the scale-up across global supply chains. The Ellen MacArthur Foundation.
- Energy, U. K. (2020). Rebuilding the UK economy: Fairer, cleaner, more resilient. How the energy transition can drive the economic recovery. Energy UK; PwC Strategy&.
- EPRI. (2018). The U.S. National electrification assessment (USNEA). The Electric Power Research Institute (EPRI).
- Flade, S., Stephan, T., Thalau, O., Burberg, T., Schirmer, J., & Kallo, J. (2016). Air breathing PEM fuel cells in aviation. ECS Transactions, 75(14), 471–477. https://doi.org/10.1149/07514.0471ecst
- Forster, P., Huppmann, D., Kriegler, E., Mundaca, L., Smith, C., Rogelj, J., & Séférian, R. (2018). Mitigation pathways compatible with 1.5°C in the context of sustainable development supplementary material. In V. Masson-Delmotte, P. Zhai, H.-O. Pörtner, D. Roberts, J. Skea, P. R. Shukla, A. Pirani, W. Moufouma-Okia, C. Péan, R. Pidcock, S. Connors, J. B. R. Matthews, Y. Chen, X. Zhou, M. I. Gomis, E. Lonnoy, T. Maycock, M. Tignor, & T. Waterfield (Eds.), Global warming of 1.5°C. An IPCC special report on the impacts of global warming of 1.5°C above pre-industrial levels and related global greenhouse gas emission pathways, in the context of strengthening the global response to the threat of climate change, sustainable development, and efforts to eradicate poverty. World Meteorological Organization.
- Freightliner. (2015). SuperTruck. The future. Five years in the making: Meet the most freight-efficient concept truck on the planet [Online]. Available: https://freightliner.com/why-freightliner/industry-leading-results/supertruck/ [Accessed 13th March 2019]
- Fricko, O., Havlik, P., Rogelj, J., Klimont, Z., Gusti, M., Johnson, N., Kolp, P., Strubegger, M., Valin, H., Amann, M., Ermolieva, T., Forsell, N., Herrero, M., Heyes, C., Kindermann, G., Krey, V., Mccollum, D. L., Obersteiner, M., Pachauri, S., … Riahi, K. (2017). The marker quantification of the shared socioeconomic pathway 2: A middle-of-the-road scenario for the 21st century. Global Environmental Change, 42, 251–267. https://doi.org/10.1016/j.gloenvcha.2016.06.004
- Fulton, L. M., Lynd, L. R., Körner, A., Greene, N., & Tonachel, L. R. (2015). The need for biofuels as part of a low carbon energy future. Biofuels, Bioproducts and Biorefining, 9(5), 476–483. https://doi.org/10.1002/bbb.1559
- Fuss, S., Canadell, J. G., Peters, G. P., Tavoni, M., Andrew, R. M., Ciais, P., Jackson, R. B., Jones, C. D., Kraxner, F., Nakicenovic, N., Le Quéré, C., Raupach, M. R., Sharifi, A., Smith, P., & Yamagata, Y. (2014). Betting on negative emissions. Nature Climate Change, 4(10), 850–853. https://doi.org/10.1038/nclimate2392
- Gaede, J., & Meadowcroft, J. (2016). Carbon capture and storage demonstration and low-carbon energy transitions: Explaining limited progress. In V. D. Graaf, T. Sovacool, B. K. Ghosh, A. Kern, F. & Klare, & M. T (Eds.), The palgrave handbook of the international political economy of energy (pp. 319–340). Palgrave Macmillan UK.
- Gallego-Schmid, A., Chen, H.-M., Sharmina, M., & Mendoza, J. M. F. (2020). Links between circular economy and climate change mitigation in the built environment. Journal of Cleaner Production, 260, 121115. https://doi.org/10.1016/j.jclepro.2020.121115
- Gilbert, P., Walsh, C., Traut, M., Kesieme, U., Pazouki, K., & Murphy, A. (2018). Assessment of full life-cycle air emissions of alternative shipping fuels. Journal of Cleaner Production, 172, 855–866. https://doi.org/10.1016/j.jclepro.2017.10.165
- Girod, B., Van Vuuren, D. P., & Deetman, S. (2012). Global travel within the 2°C climate target. Energy Policy, 45, 152–166. https://doi.org/10.1016/j.enpol.2012.02.008
- Graham, W., Hall, C., & Morales, M. V. (2014). The potential of future aircraft technology for noise and pollutant emissions reduction. Transport Policy, 34, 36–51. https://doi.org/10.1016/j.tranpol.2014.02.017
- Greening, P., Piecyk, M., Palmer, A., & Dadhich, P. (2019). Decarbonising road freight. Future of mobility: Evidence review. Foresight, Government Office for Science.
- Griffin, P. W., Hammond, G. P., & Norman, J. B. (2016). Industrial energy use and carbon emissions reduction: A UK perspective. Wiley Interdisciplinary Reviews: Energy and Environment, 5(6), 684–714. https://doi.org/10.1002/wene.212
- Grubler, A., Wilson, C., Bento, N., Boza-Kiss, B., Krey, V., Mccollum, D. L., Rao, N. D., Riahi, K., Rogelj, J., De Stercke, S., Cullen, J., Frank, S., Fricko, O., Guo, F., Gidden, M., Havlík, P., Huppmann, D., Kiesewetter, G., Rafaj, P., … Valin, H. (2018). A low energy demand scenario for meeting the 1.5 °C target and sustainable development goals without negative emission technologies. Nature Energy, 3(6), 515–527. https://doi.org/10.1038/s41560-018-0172-6
- Hammond, G. (2013). Carbon dioxide capture and storage faces a challenging future. Proceedings of the Institution of Civil Engineers - Civil Engineering, 166(4), 147–147. https://doi.org/10.1680/cien.2013.166.4.147
- Hammond, G., & O'Grady, Á. (2014). The implications of upstream emissions from the power sector. Proceedings of the Institution of Civil Engineers - Energy, 167(1), 9–19. https://doi.org/10.1680/ener.13.00006
- Heitmann, N., & Peterson, S. (2014). The potential contribution of the shipping sector to an efficient reduction of global carbon dioxide emissions. Environmental Science & Policy, 42, 56–66. https://doi.org/10.1016/j.envsci.2014.05.001
- Hertwich, E. G., Ali, S., Ciacci, L., Fishman, T., Heeren, N., Masanet, E., Asghari, F. N., Olivetti, E., Pauliuk, S., Tu, Q., & Wolfram, P. (2019). Material efficiency strategies to reducing greenhouse gas emissions associated with buildings, vehicles, and electronics—a review. Environmental Research Letters, 14(4), 043004. https://doi.org/10.1088/1748-9326/ab0fe3
- Hileman, J. I., & Stratton, R. W. (2014). Alternative jet fuel feasibility. Transport Policy, 34, 52–62. https://doi.org/10.1016/j.tranpol.2014.02.018
- Hu, B., Zhang, Y., Li, Y., Teng, Y., & Yue, W. (2020). Can bioenergy carbon capture and storage aggravate global water crisis? Science of The Total Environment, 714, 136856. https://doi.org/10.1016/j.scitotenv.2020.136856
- Huang, R., Riddle, M., Graziano, D., Warren, J., Das, S., Nimbalkar, S., Cresko, J., & Masanet, E. (2016). Energy and emissions saving potential of additive manufacturing: The case of lightweight aircraft components. Journal of Cleaner Production, 135, 1559–1570. https://doi.org/10.1016/j.jclepro.2015.04.109
- Huppmann, D., Kriegler, E., Krey, V., Riahi, K., Rogelj, J., Katherine Calvin, F. H., Popp, A., Rose, S. K., Weyant, J., Bauer, N., Bertram, C., Bosetti, V., Doelman, J., Drouet, L., Emmerling, J., Frank, S., Fujimori, S., Gernaat, D., Grubler, A., … Zhang, A. R. (2019). IAMC 1.5°C Scenario explorer and data hosted by IIASA. Vienna, Austria: Integrated Assessment Modeling Consortium & International Institute for Applied Systems Analysis.
- ICAO. (2016). Environmental Report 2016 - Aviation and climate change.
- ICAO. (2020). Effects of novel Coronavirus (COVID-19) on civil aviation: Economic impact analysis. ICAO, Air Transport Bureau.
- IEA. (2017). The future of trucks: Implications for energy and the environment (2nd ed.). International Energy Agency.
- IEA. (2020). Sustainable recovery. World energy outlook special report. International Energy Agency (IEA).
- IPCC. (2014a). Climate change 2014: Mitigation of climate change. In O. Edenhofer, R. P. Madruga, & Y. Sokona (Eds.), Contribution of Working Group III to the Fifth Assessment Report of the Intergovernmental Panel on Climate Change. https://www.ipcc.ch/report/ar5/wg3/
- IPCC. (2014b). The IAMC AR5 Online Scenario Database. The International Institute for Applies Systems Analysis (IIASA). Available at: https://secure.iiasa.ac.at/web-apps/ene/AR5DB/
- IPCC. (2018). Global Warming of 1.5°C. An IPCC special report on the impacts of global warming of 1.5 °C above pre-industrial levels and related global greenhouse gas emission pathways, in the context of strengthening the global response to the threat of climate change, sustainable development, and efforts to eradicate poverty.
- Ji, L., Zhang, B., Huang, G., Cai, Y., & Yin, J. (2020). Robust regional low-carbon electricity system planning with energy-water nexus under uncertainties and complex policy guidelines. Journal of Cleaner Production, 252, 119800. https://doi.org/10.1016/j.jclepro.2019.119800
- Jiang, H.-D., Dong, K.-Y., Zhang, K., & Liang, Q.-M. (2020). The hotspots, reference routes, and research trends of marginal abatement costs: A systematic review. Journal of Cleaner Production, 252, 119809. https://doi.org/10.1016/j.jclepro.2019.119809
- Jin, Y., Behrens, P., Tukker, A., & Scherer, L. (2019). Water use of electricity technologies: A global meta-analysis. Renewable and Sustainable Energy Reviews, 115, 109391. https://doi.org/10.1016/j.rser.2019.109391
- Johnson, J. (2020). Clipped wings. Energy world. Energy Institute.
- Kampman, B., Verbeek, R., Van Grinsven, A., Van Mensch, P., Croezen, H., & Patuleia, A. (2013). Bringing biofuels on the market: Options to increase EU biofuels volumes beyond the current blending limits. CE Delft. Commissioned by the European Commission, DG Energy.
- Kaya, Y. (1989). Impact of carbon dioxide emission control on GNP growth: Interpretation of proposed scenarios. Intergovernmental Panel on Climate Change/Response Strategies Working Group, May.
- Keller, V., Lyseng, B., Wade, C., Scholtysik, S., Fowler, M., Donald, J., Palmer-Wilson, K., Robertson, B., Wild, P., & Rowe, A. (2019). Electricity system and emission impact of direct and indirect electrification of heavy-duty transportation. Energy, 172, 740–751. https://doi.org/10.1016/j.energy.2019.01.160
- Kesicki, F. (2012). Intertemporal issues and marginal abatement costs in the UK transport sector. Transportation Research Part D: Transport and Environment, 17(5), 418–426. https://doi.org/10.1016/j.trd.2012.04.002
- Larkin, A., Kuriakose, J., Sharmina, M., & Anderson, K. (2017). What if negative emission technologies fail at scale? Implications of the Paris Agreement for big emitting nations. Climate Policy, 18(6), 690–714. https://doi.org/10.1080/14693062.2017.134649
- Larsson, J., Elofsson, A., Sterner, T., & Åkerman, J. (2019). International and national climate policies for aviation: A review. Climate Policy, 19(6), 1–13. https://doi.org/10.1080/14693062.2018.1562871
- Lee, D. S. (2017). Update of maritime greenhouse gas emissions projections - Full report. MEPC 71/INF.34. CE Delft.
- Leeson, D., Mac Dowell, N., Shah, N., Petit, C., & Fennell, P. S. (2017). A Techno-economic analysis and systematic review of carbon capture and storage (CCS) applied to the iron and steel, cement, oil refining and pulp and paper industries, as well as other high purity sources. International Journal of Greenhouse Gas Control, 61, 71–84. https://doi.org/10.1016/j.ijggc.2017.03.020
- Lilliestam, J., Bielicki, J. M., & Patt, A. G. (2012). Comparing carbon capture and storage (CCS) with concentrating solar power (CSP): potentials, costs, risks, and barriers. Energy Policy, 47, 447–455. https://doi.org/10.1016/j.enpol.2012.05.020
- Lindstad, H., Asbjørnslett, B. E., & Strømman, A. H. (2011). Reductions in greenhouse gas emissions and cost by shipping at lower speeds. Energy Policy, 39(6), 3456–3464. https://doi.org/10.1016/j.enpol.2011.03.044
- Lovins, A. B., Ürge-Vorsatz, D., Mundaca, L., Kammen, D. M., & Glassman, J. W. (2019). Recalibrating climate prospects. Environmental Research Letters, 14(12), 120201. https://doi.org/10.1088/1748-9326/ab55ab
- Low, S., & Schäfer, S. (2020). Is bio-energy carbon capture and storage (BECCS) feasible? The contested authority of integrated assessment modeling. Energy Research & Social Science, 60, 101326. https://doi.org/10.1016/j.erss.2019.101326
- Luderer, G., Vrontisi, Z., Bertram, C., Edelenbosch, O. Y., Pietzcker, R. C., Rogelj, J., De Boer, H. S., Drouet, L., Emmerling, J., Fricko, O., Fujimori, S., Havlík, P., Iyer, G., Keramidas, K., Kitous, A., Pehl, M., Krey, V., Riahi, K., Saveyn, B., … Kriegler, E. (2018). Residual fossil CO2 emissions in 1.5–2 °C pathways. Nature Climate Change, 8(7), 626–633. https://doi.org/10.1038/s41558-018-0198-6
- Luh, S., Budinis, S., Giarola, S., Schmidt, T. J., & Hawkes, A. (2020). Long-term development of the industrial sector – case study about electrification, fuel switching, and CCS in the USA. Computers & Chemical Engineering, 133, 106602. https://doi.org/10.1016/j.compchemeng.2019.106602
- Mai, T., Jadun, P., Logan, J., Mcmillan, C., Muratori, M., Steinberg, D., Vimmerstedt, L., Jones, R., Haley, B., & Nelson, B. (2018). Electrification futures study: Scenarios of electric technology adoption and power consumption for the United States. National Renewable Energy Laboratory.
- Mander, S. (2017). Slow steaming and a new Dawn for wind propulsion: A multi-level analysis of two low carbon shipping transitions. Marine Policy, 75, 210–216. https://doi.org/10.1016/j.marpol.2016.03.018
- Markham, F., Young, M., Reis, A., & Higham, J. (2018). Does carbon pricing reduce air travel? Evidence from the Australian ‘clean energy future’ policy, July 2012 to June 2014. Journal of Transport Geography, 70, 206–214. https://doi.org/10.1016/j.jtrangeo.2018.06.008
- Mccarthy, A., Dellink, R., & Bibas, R. (2018). The macroeconomics of the circular economy transition: A critical review of modelling approaches. OECD Environment Working Papers. Paris: OECD Publishing.
- Mckinsey. (2017). What’s sparking electric-vehicle adoption in the truck industry?
- Milford, R. L., Pauliuk, S., Allwood, J. M., & Müller, D. B. (2013). The roles of energy and material efficiency in meeting steel industry CO2 targets. Environmental Science and Technology, 47(7), 3455–3462. https://doi.org/10.1021/es3031424
- Montreuil, B. (2011). Toward a physical Internet: Meeting the global logistics sustainability grand challenge. Logistics Research, 3(2–3), 71–87. https://doi.org/10.1007/s12159-011-0045-x
- Mulholland, E., Teter, J., Cazzola, P., Mcdonald, Z., & Ó Gallachóir, B. P. (2018). The long haul towards decarbonising road freight – A global assessment to 2050. Applied Energy, 216, 678–693. https://doi.org/10.1016/j.apenergy.2018.01.058
- Muratori, M., Smith, S. J., Kyle, P., Link, R., Mignone, B. K., & Kheshgi, H. S. (2017). Role of the freight sector in future Climate change mitigation scenarios. Environmental Science & Technology, 51(6), 3526–3533. https://doi.org/10.1021/acs.est.6b04515
- Murphy, A., Earl, T., Hemmings, B., Calvo Ambel, C., Buffet, L., Gilliam, L., & Sihvonen, J. (2018). . Roadmap to decarbonising European aviation. European Federation for Transport and Environment AISBL.
- NATS. (2018). NATS Responsible Business Report 2017–18. National Air Traffic Services (NATS).
- Nelissen, D., Traut, M., Köhler, J., Mao, W., Faber, J., & Ahdour, S. (2016). Study on the analysis of market potentials and market barriers for wind propulsion technologies for ships. CE Delft. https://www.cedelft.eu/publicatie/study_on_the_analysis_of_market_potentials_and_market_barriers_for_wind_propulsion_technologies_for_ships/1891
- OECD/ITF. (2010). Reducing transport GHG emissions: Opportunities and costs. Preliminary findings. International Transport Forum; OECD Publishing.
- OECD/ITF. (2017). ITF transport outlook 2017. International Transport Forum; OECD Publishing.
- Parsa, M., Nookabadi, A. S., Flapper, S. D., & Atan, Z. (2019). Green hub-and-spoke network design for aviation industry. Journal of Cleaner Production, 229, 1377–1396. https://doi.org/10.1016/j.jclepro.2019.04.188
- Pauliuk, S., & Müller, D. B. (2014). The role of in-use stocks in the social metabolism and in climate change mitigation. Global Environmental Change, 24, 132–142. https://doi.org/10.1016/j.gloenvcha.2013.11.006
- Peters, G. P., Andrew, R. M., Canadell, J. G., Fuss, S., Jackson, R. B., Korsbakken, J. I., Le Quéré, C., & & Nakicenovic, N. (2017). Key indicators to track current progress and future ambition of the Paris Agreement. Nature Climate Change, 7(2), 118–122. https://doi.org/10.1038/nclimate3202
- Phadke, A. A., Khandekar, A., Mccall, M., Karali, N., & Rajagopal, D. (2019). Long-haul battery electric trucks are technically feasible and economically compelling.
- Rheaume, J. M., & Lents, C. Energy Storage for Commercial Hybrid Electric Aircraft. SAE Technical Paper, 09 2016. SAE International.
- Rissman, J., Bataille, C., Masanet, E., Aden, N., Morrow, W. R., Zhou, N., Elliott, N., Dell, R., Heeren, N., Huckestein, B., Cresko, J., Miller, S. A., Roy, J., Fennell, P., Cremmins, B., Koch Blank, T., Hone, D., Williams, E. D., De La Rue Du Can, S., … Helseth, J. (2020). Technologies and policies to decarbonize global industry: Review and assessment of mitigation drivers through 2070. Applied Energy, 266, 114848. https://doi.org/10.1016/j.apenergy.2020.114848
- Rogelj, J., Den Elzen, M., Höhne, N., Fransen, T., Fekete, H., Winkler, H., Schaeffer, R., Sha, F., Riahi, K., & Meinshausen, M. (2016). Paris Agreement climate proposals need a boost to keep warming well below 2 °C. Nature, 534(7609), 631–639. https://doi.org/10.1038/nature18307
- Rogelj, J., Popp, A., Calvin, K. V., Luderer, G., Emmerling, J., Gernaat, D., Fujimori, S., Strefler, J., Hasegawa, T., Marangoni, G., Krey, V., Kriegler, E., Riahi, K., Van Vuuren, D. P., Doelman, J., Drouet, L., Edmonds, J., Fricko, O., Harmsen, M., … Tavoni, M. (2018). Scenarios towards limiting global mean temperature increase below 1.5°C. Nature Climate Change, 8(4), 325–332. https://doi.org/10.1038/s41558-018-0091-3
- Schäfer, A. W., Evans, A. D., Reynolds, T. G., & Dray, L. (2016). Costs of mitigating CO2 emissions from passenger aircraft. Nature Climate Change, 6(4), 412–417. https://doi.org/10.1038/nclimate2865
- Schafer, A., & Victor, D. G. (2000). The future mobility of the world population. Transportation Research Part A: Policy and Practice, 34(3), 171–205. https://doi.org/10.1016/S0965-8564(98)00071-8
- Schäfer, A. W., & Yeh, S. (2020). A holistic analysis of passenger travel energy and greenhouse gas intensities. Nature Sustainability, 3(6), 459–462. https://doi.org/10.1038/s41893-020-0514-9
- Schroten, A., Warringa, G., & Bles, M. (2012). Marginal abatement cost curves for heavy duty vehicles. Background report. CE Delft.
- Schwanitz, V. J. (2013). Evaluating integrated assessment models of global climate change. Environmental Modelling & Software, 50, 120–131. https://doi.org/10.1016/j.envsoft.2013.09.005
- Scott, K., Giesekam, J., Barrett, J., & Owen, A. (2018). Bridging the climate mitigation gap with economy-wide material productivity. Journal of Industrial Ecology, 23(4), 918–931. https://doi.org/10.1111/jiec.12831
- Searle, S., & Malins, C. (2015). A reassessment of global bioenergy potential in 2050. Gcb Bioenergy, 7(2), 328–336. https://doi.org/10.1111/gcbb.12141
- Sharifzadeh, M., Hien, R. K. T., & Shah, N. (2019). China’s roadmap to low-carbon electricity and water: Disentangling greenhouse gas (GHG) emissions from electricity-water nexus via renewable wind and solar power generation, and carbon capture and storage. Applied Energy, 235, 31–42. https://doi.org/10.1016/j.apenergy.2018.10.087
- Sharmina, M., Mcglade, C., Gilbert, P., & Larkin, A. (2017). Global energy scenarios and their implications for future shipped trade. Marine Policy, 84, 12–21. https://doi.org/10.1016/j.marpol.2017.06.025
- Smith, T. W. P., Jalkanen, J. P., Anderson, B. A., Corbett, J. J., Faber, J., Hanayama, S., O’KEEFFE, E., Parker, S., Johansson, L., Aldous, L., Raucci, C., Traut, M., Ettinger, S., Nelissen, D., Lee, D. S., Ng, S., Agrawal, A., Winebrake, J. J., Hoen, M., … Pandey, A. (2015). Third IMO GHG study 2014. International Maritime Organization.
- Sustainable Aviation. (2020). Decarbonisation road-Map: A path to net zero.
- Szodruch, J., Grimme, W., Blumrich, F., & Schmid, R. (2011). Next generation single-aisle aircraft--requirements and technological solutions. Journal of Air Transport Management, 17(1), 33–39. https://doi.org/10.1016/j.jairtraman.2010.10.007
- Tavoni, M., Kriegler, E., Riahi, K., Van Vuuren, D. P., Aboumahboub, T., Bowen, A., Calvin, K., Campiglio, E., Kober, T., Jewell, J., Luderer, G., Marangoni, G., Mccollum, D., Van Sluisveld, M., Zimmer, A., & Van Der Zwaan, B. (2015). Post-2020 climate agreements in the major economies assessed in the light of global models. Nature Climate Change, 5(2), 119–126. https://doi.org/10.1038/nclimate2475
- Tiwari, A., Padhee, U., & Dora, M. (2020). COVID19: The impact on aviation and what we can do about it. Retrieved June 11, 2020, from https://www.brunel.ac.uk/news-and-events/news/articles/COVID19-The-impact-on-aviation-and-what-we-can-do-about-it
- Traut, M., Gilbert, P., Walsh, C., Bows, A., Filippone, A., Stansby, P., & Wood, R. (2014). Propulsive power contribution of a kite and a Flettner rotor on selected shipping routes. Applied Energy, 113, 362–372. https://doi.org/10.1016/j.apenergy.2013.07.026
- Traut, M., Larkin, A., Anderson, K., Mcglade, C., Sharmina, M., & Smith, T. (2018). CO2 abatement goals for international shipping. Climate Policy, 18(8), 1066–1075. https://doi.org/10.1080/14693062.2018.1461059
- Trutnevyte, E., Hirt, L. F., Bauer, N., Cherp, A., Hawkes, A., Edelenbosch, O. Y., Pedde, S., & Van Vuuren, D. P. (2019). Societal Transformations in models for energy and Climate policy: The Ambitious next Step. One Earth, 1(4), 423–433. https://doi.org/10.1016/j.oneear.2019.12.002
- UN. (2020). COVID-19 and Human Rights: We are all in this together. UN policy brief, April 2020. Retrieved September 25, 2020, from https://www.un.org/en/un-coronavirus-communications-team/un-urges-countries-%E2%80%98build-back-better%E2%80%99
- UNCTAD. (2015). Review of maritine transport 2015. United Nations Conference on Trade and Development (UNCTAD).
- Van Den Berg, N. J., Hof, A. F., Akenji, L., Edelenbosch, O. Y., Van Sluisveld, M. A. E., Timmer, V. J., & Van Vuuren, D. P. (2019). Improved modelling of lifestyle changes in integrated assessment models: Cross-disciplinary insights from methodologies and theories. Energy Strategy Reviews, 26, 100420. https://doi.org/10.1016/j.esr.2019.100420
- Van Ruijven, B. J., Van Vuuren, D. P., Boskaljon, W., Neelis, M. L., Saygin, D., & Patel, M. K. (2016). Long-term model-based projections of energy use and CO2 emissions from the global steel and cement industries. Resources, Conservation and Recycling, 112, 15–36. https://doi.org/10.1016/j.resconrec.2016.04.016
- Van Sluisveld, M. A. E., Martínez, S. H., Daioglou, V., & Van Vuuren, D. P. (2016). Exploring the implications of lifestyle change in 2°C mitigation scenarios using the IMAGE integrated assessment model. Technological Forecasting and Social Change, 102, 309–319. https://doi.org/10.1016/j.techfore.2015.08.013
- Van Vuuren, D. P., Stehfest, E., Gernaat, D. E. H. J., Doelman, J. C., Van Den Berg, M., Harmsen, M., De Boer, H. S., Bouwman, L. F., Daioglou, V., Edelenbosch, O. Y., Girod, B., Kram, T., Lassaletta, L., Lucas, P. L., Van Meijl, H., Müller, C., Van Ruijven, B. J., Van Der Sluis, S., & Tabeau, A. (2017). Energy, land-use and greenhouse gas emissions trajectories under a green growth paradigm. Global Environmental Change, 42, 237–250. https://doi.org/10.1016/j.gloenvcha.2016.05.008
- Vaughan, N. E., Gough, C., Mander, S., Littleton, E. W., Welfle, A., Gernaat, D. E. H. J., & Van Vuuren, D. P. (2018). Evaluating the use of biomass energy with carbon capture and storage in low emission scenarios. Environmental Research Letters, 13(4), 044014. https://doi.org/10.1088/1748-9326/aaaa02
- Vercoulen, P., Lee, S., Mercure, J.-F., Suk, S., He, Y., & Fujikawa, K. (2018). Decarbonizing the East Asian steel industry in 2050: An analysis performed with FTT(future technology transformation)-steel model. Meijo University.
- Vine, D., & Ye, J. (2018). Decarbonizing U.S. Industry. Center for Climate and Energy Solutions (C2ES).
- Vogl, V., Åhman, M., & Nilsson, L. J. (2020). The making of green steel in the EU: A policy evaluation for the early commercialization phase. Climate Policy. https://doi.org/10.1080/14693062.2020.1803040
- Walsh, C., Lazarou, N.-J., Traut, M., Price, J., Raucci, C., Sharmina, M., Agnolucci, P., Mander, S., Gilbert, P., Anderson, K., Larkin, A., & Smith, T. (2019). Trade and trade-offs: Shipping in changing climates. Marine Policy, 106, 103537. https://doi.org/10.1016/j.marpol.2019.103537
- Willis Re. (2020). Covid-19. What will be the impact to the aviation sector from the Corona virus outbreak? Willis Towers Watson.
- Wise, M., Muratori, M., & Kyle, P. (2017). Biojet fuels and emissions mitigation in aviation: An integrated assessment modeling analysis. Transportation Research Part D: Transport and Environment, 52, 244–253. https://doi.org/10.1016/j.trd.2017.03.006
- Workman, M., Dooley, K., Lomax, G., Maltby, J., & Darch, G. (2020). Decision making in contexts of deep uncertainty - An alternative approach for long-term climate policy. Environmental Science & Policy, 103, 77–84. https://doi.org/10.1016/j.envsci.2019.10.002
- Yamagata, Y. (2019). Global negative emission land Use scenarios and their Ecological implications. In B. Fath (Ed.), Encyclopedia of Ecology (Second Edition) (pp. 96–107). Elsevier. https://doi.org/10.1016/B978-0-12-409548-9.10893-0
- Yang, X., Teng, F., & Wang, G. (2013). Incorporating environmental co-benefits into climate policies: A regional study of the cement industry in China. Applied Energy, 112, 1446–1453. https://doi.org/10.1016/j.apenergy.2013.03.040
- Yuan, J., Ng, S. H., & Sou, W. S. (2016). Uncertainty quantification of CO2 emission reduction for maritime shipping. Energy Policy, 88, 113–130. https://doi.org/10.1016/j.enpol.2015.10.020