
 ?Mathematical formulae have been encoded as MathML and are displayed in this HTML version using MathJax in order to improve their display. Uncheck the box to turn MathJax off. This feature requires Javascript. Click on a formula to zoom.
ABSTRACT
Logical reasoning as part of critical thinking is becoming more and more important to prepare students for their future life in society, work, and study. This article presents the results of a quasi-experimental study with a pre-test-post-test control group design focusing on the effective use of formalisations to support logical reasoning. The participants were 163 pre-university secondary school students (11th and 12th graders). For the experimental group we designed a course in logical reasoning intending to develop students’ use of formalisations in formal reasoning and everyday reasoning tasks. We show that students learned to use the intended formalisations. Overall, students from the experimental group had significantly better results on the post-test compared to the control group. Positive correlations were found between item scores and the use of Venn and Euler diagrams and scheme-based strategies. Our results support our hypothesis that the use of formalisations improves logical reasoning skills.
Introduction
To fully participate in today's society, students need to learn higher-order thinking skills, such as critical thinking as, for example, emphasised by P21′s Framework for twenty-first century Learning and the OECD (Brookhart, Citation2010; P21, Citation2015; Vincent-Lancrin et al., Citation2019). Critical thinking includes reasoning in formal and everyday situations, for which it is important to build, analyse, and verify reasoning, and identify and prevent incorrect arguments. For example, citizens who evaluate the validity of claims in commercials when deciding about the buying of a car or who critically review journalists’ stance and arguments in newspaper articles. Or, in professional life, a judge who properly weighs all evidence to evaluate the most likely scenario of a crime. In all these situations formal and visual representations might provide an overview of the relevant reasoning, and, thus, structure the reasoning process (Halpern, Citation2014; McKendree et al., Citation2002; Van Gelder, Citation2005). This shows the need for students to learn to structure their reasoning in all kinds of contexts. However, not much is known about the effective use of formal and visual representations in the reasoning of students at secondary level. The teaching of reasoning is part of mathematics education, and, as we will show, not only refers to reasoning in strictly formal and mathematical systems, it should also support reasoning in everyday situations (e.g. NGA Center and CCSSO, Citation2016).
Logical reasoning
The common factor that connects reasoning in formal and everyday situations is logical reasoning (Liu et al., Citation2015) which is the focus of this article. Formal reasoning always gives a valid conclusion within a formal system as long as one applies the pre-defined rules (Schoenfeld, Citation1991). These rules are often taken from mathematics or formal logic based on fixed and unchanging premises (Teig & Scherer, Citation2016).
Reasoning in everyday situations is often called informal reasoning in the literature, but this term is used ambiguously (e.g. Voss et al., Citation1991). Informal reasoning does not provide one conclusive solution, because the problem situations are often open-ended. By identifying and justifying acceptable premises, the results will be plausible within the context, but can be open for discussion, for instance, by providing new information (e.g. Galotti, Citation1989; Johnson & Blair, Citation2006; Kuhn, Citation1991). In an earlier paper, we concluded that informal reasoning can be defined as “reasoning in ordinary language to construct an argument which requires a critical review of the given premises and transforming of information, as well as finding additional or similar information provided by the problem solver or by external sources” (Bronkhorst et al., Citation2020, p. 1676). For this study, we will use this definition accordingly.
Both, formal and informal reasoning, involve selection and interpretation of information as key elements in reaching a conclusion via a series of reasoning steps. Therefore, in an earlier paper, we concluded that formal and informal reasoning can be combined into one definition of logical reasoning that involves several steps. We defined logical reasoning as “selecting and interpreting information from a given context, making connections, and verifying and drawing conclusions based on provided and interpreted information and the associated rules and processes.” (Bronkhorst et al., Citation2020, p. 1676). In this study, we will build on this definition, which is a workable definition and bounds the context of our research. It also clearly shows the steps needed in working towards a conclusion in logical reasoning.
Formalisations
We have already mentioned that formal and visual representations, which we call formalisations, can support logical reasoning. Formalisations include, among others, all sorts of symbols and formal notations, schematisations, and Venn and Euler diagrams and will be used in this article accordingly (e.g. Bronkhorst et al., Citation2020; Halpern, Citation2014; Van Gelder, Citation2005).
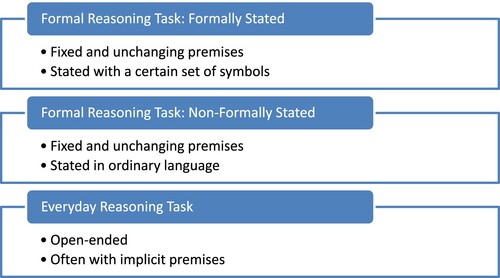
From earlier studies, we discovered that most students (11th and 12th graders) did not use formalisations, but preferred informal reasoning and made mistakes in all sorts of reasoning tasks (Bronkhorst et al., Citation2018, Citation2020). Our results were in line with reported difficulties concerning logical reasoning among different age groups elsewhere in the literature (e.g. Daniel & Klaczynski, Citation2006; Evans, Citation2002; Galotti, Citation1989; Stanovich et al., Citation2016). In this article, we present results of an experimental study with a pre-test-post-test control group design, using a specially designed intervention aimed at improving students’ logical reasoning skills focusing on the use of formalisations. To study the role of formalisations within different situations, it is important to differentiate between types of tasks. For that, we will use Galotti’s (Citation1989) division between formal reasoning tasks and everyday reasoning tasks. Formal reasoning tasks are closed tasks in which all premises are provided, which intend to lead to one conclusive answer. Those tasks can be stated formally (with symbols) or non-formally in ordinary language (without symbols). Everyday reasoning tasks are open-ended problems, often with implicit or non-mentioned premises. For example, reviewing arguments in short newspaper articles. This division is visualised in .
Figure 1. Division of tasks.
Relevance
The experimental group of our study consisted of Dutch students for whom the domain “logical reasoning” is explicitly mentioned in the most recent mathematics curriculum for pre-university education (College voor Toetsen en Examens, Citation2016). This domain specifically aims at improving students’ reasoning about societal issues outside the field of mathematics. In other words, it should stimulate general educational objectives as a preparation for all sorts of situations in society (cTWO, Citation2012). If we study the mathematics curricula from English speaking countries, we recognise similar intentions, which correspond to our definition of logical reasoning. In other words, reasoning in mathematics should not be synonymous with formal deductive reasoning only (NCTM, Citation2009, Chapter 1). The United States’ Standards for Mathematical Practice state for example: “Mathematically proficient students are also able to compare the effectiveness of two plausible arguments, distinguish correct logic or reasoning from that which is flawed, and—if there is a flaw in an argument—explain what it is” (NGA Center and CCSSO, Citation2016, p. 7). This clearly shows the possibility of placing plausible arguments next to strict formal conclusive reasoning. The National Curriculum for England for Key Stage 4 states that students should be able to “assess the validity of an argument and the accuracy of a given way of presenting information” as part of their mathematical reasoning skills (Department of Education UK, Citation2014). Furthermore, the United States Standards and the new Australian curriculum explicitly mention adaptive reasoning as one of the five strands for mathematical proficiency (McChesney, Citation2017). Adaptive reasoning represents the “capacity for logical thought, reflection, explanation, and justification” (National Research Council, Citation2001, p. 5), which, together with productive disposition, should show that mathematics is useful and supporting. Altogether, these examples show the importance of logical reasoning in different contexts as part of mathematics education.
Intervention
We implemented an intervention, which specifically stimulates the use of formalisations, including visualisations and schematisations, in logical reasoning. The hypothesis behind our intervention is that the use of formalisations is useful and teachable, and therefore, should improve students’ reasoning (Adey & Shayer, Citation1993; Van Aalten & De Waard, Citation2001) as also suggested by our prior research (Bronkhorst et al., Citation2018, Citation2020). Our intervention should not be confused with a course in formal logic, because formal logic demands an enormous time investment to reach a satisfactory level (Hansen & Cohen, Citation2011). Additionally, it might not even be effective at all for improving logical reasoning skills (e.g. Cheng et al., Citation1986). For our target group of non-science students, we expected that a course requiring a high level of technical, mathematical skills would not be adequate (Carrascal, Citation2011). Furthermore, research from Attridge et al. (Citation2016) suggest that, for conditional inferences in particular, prior experiences with logic are required for significant improvement. Consequently, in our intervention, we focus on relevant formalisations, including visualisations and schematisations, that structure and support the reasoning process (Halpern, Citation2014; McKendree et al., Citation2002; Van Gelder, Citation2005).
Previous research has shown that classroom discourse and social interactions among students are supportive for improved reasoning (e.g. Rojas-Drummond & Mercer, Citation2003; Yackel et al., Citation1991). There should also be sufficient attention to students’ own solution methods with meaningful tasks related to everyday experiences (Grouws & Cebulla, Citation2000; National Research Council, Citation1999). These factors are comparable with teaching standards of Realistic Mathematics Education where students “come up with their own solutions, explain and justify their solutions, [and] try to understand the explanations and solutions of their peers” (Gravemeijer, Citation2020, p. 220). It is important that teachers facilitate these opportunities for constructing and understanding by providing adequate tasks and posing suitable questions (Gravemeijer, Citation1999, Citation2020; Halpern, Citation1998; NCTM, Citation2009). Together with the focus on formalisations, we incorporated this in our intervention, which resulted in the following design characteristics:
Students are given opportunities to reason in formal and everyday reasoning tasks.
Students are encouraged to invent their own formalisations, including schematisations and visualisations.
Students will encounter different types of arguments (strict correct, valid, plausible, open-ended, et cetera).
Students are encouraged to explain and compare their solutions, reflect on their reasoning, and to provide each other with feedback.
Different solution methods are discussed during classroom discourse.
The teacher will provide formative feedback regularly.
An overview of the lessons for our intervention, consisting of 10 lessons of 50 min, is found in . After some introductory explorations (first lesson), students worked a whole lesson on judging evidence in a legal case presented in a newspaper article (everyday reasoning task). They had to find a way to present the premises and proofs clearly before a possible reasoning scheme was introduced. In the following lessons, students were encouraged to invent their own structures, visualisations, and schematisations with or without the use of symbols in small tasks, often concerning syllogisms and if–then statements (mainly formal reasoning tasks). After students had the opportunity to invent their own formalisations, letter symbols, Venn and Euler diagrams, and logical symbols were introduced during lessons 3–5. In lessons 7–8, students constructed their arguments from newspaper articles, giving them the opportunity to use their discovered and learned formalisations in open-ended everyday reasoning tasks.
Table 1. Overview intervention.
In general, students were almost always asked to come up with their own solutions for each exercise first. Second, they discussed their solution methods in pairs or small groups of three or four. Third, during classroom discourse different solution methods were compared not only on correctness but also on usefulness in general with specific attention to the comparison of students’ used formalisations. Homework was limited to one or two exercises.
The design of the materials followed two iterative cycles (Van den Akker et al., Citation2013). Materials were developed in collaboration with a group of teachers and were tested in a pilot study, including pre- and post-tests. After the pilot intervention and teacher evaluations, various adjustments were made, mainly in providing sufficient time for students to develop their own solutions and to discuss their solutions in groups. The collaboration was not only important for the development of the materials, but even more important for discourse with the participating teachers about the exercises and how to use those in class.
The implementation guidelines for the lesson sequence on logical reasoning were provided in a teacher manual, but also thoroughly discussed during the preparation sessions with participating teachers.
Research questions
To investigate the effective use of formalisations, which also include schematisations and visualisations, in the reasoning of non-science students at secondary level, this study was guided by the following research questions:
To what extent do students use formalisations in formal reasoning tasks (formally and non-formally stated) and in everyday reasoning tasks in the pre- and in the post-test?
What is the effect of a course in logical reasoning (with a focus on the use of formalisations) on students’ performance in formal reasoning tasks (formally and non-formally stated) and in everyday reasoning tasks compared to a group without that course?
Is the use of formalisations positively associated with the correctness of students’ answers?
Method
We used a quasi-experimental pre-test-post-test control group design (e.g. Cook & Campbell, Citation1979). Students in both groups followed a pre-university non-science track (11th and 12th graders; 16- to 18-year old) in Dutch schools. Both, the experimental and control group took classes in mathematics, albeit with some differences in maths topics. The experimental group took lessons in logical reasoning with our specially designed course, while the control group worked on more advanced applications of functions and their derivatives from their regular mathematics book. Our course did cover all the learning outcomes as required by the national curriculum (College voor Toetsen en Examens, Citation2016), but, as described above, focused on effective use of formalisations that students could apply in formal and everyday reasoning tasks. Normally, students are taught in a more teacher-centred way with a textbook chapter on logical reasoning, which introduces types of problems and solutions that students apply in, often short, exercises individually. Venn and Euler diagrams are usually introduced at the end of the chapter on logical reasoning, while in our intervention Venn and Euler diagrams were already introduced in an early stage, after which the students had sufficient time to practise with the diagrams and to apply those on larger open-ended everyday reasoning tasks.
Due to the fact that the control group did not receive lessons in logical reasoning, we can verify for changes over time and retest effects on the use of formalisations.
Participants
The recruited teachers from nine schools from all parts of the Netherlands participated voluntarily. They committed to participate in the collaboration with the other teachers and came together six times prior to the intervention. Six teachers administered pre- and post-tests in experimental and control groups. Two teachers were not able to organise test sessions for control groups and only participated with an experimental group. For one teacher the experimental group for the final intervention was too small, so he only arranged pre- and post-tests for control students. Participating teachers filled in a logbook containing surveys with Likert-type items (scale 1–5) on student and teacher activities in each lesson.
The average class size for the eight participating experimental classes was seven students and varied from three to 12. The small class sizes are explained by the fact the course including logical reasoning is an elective course. Most students take an alternative course with more advanced applications of functions. Participating students matching this condition varied from six to 23 students per school. Because of this circumstance we had to settle for an unequal number of participants in both conditions: the experimental group condition consisted of 56 students in total and the control group of 107 students.
Tasks
We used identical pre- and post-tests for this study. This choice was justified because we could verify for retest effects. The tasks were mainly selected from other tests, and adapted and selected after an exploratory study (Bronkhorst et al., Citation2020) and a pilot study.
The test consisted of eight tasks with two tasks with two parts, so in total there were 10 items. For each category mentioned in , we used at least three items:
Formal reasoning tasks, non-formally stated: items 1, 2A, 2B, and 8.
Formal reasoning tasks, formally stated: items 3, 4A, and 4B.
Everyday reasoning tasks: items 5, 6, and 7.
This variety of tasks corresponds with the characteristics and goals of the intervention in relation to our definition of logical reasoning. In all tasks, students had to explain their answers to make their reasoning visible. The items, originally written in Dutch, can be found in an English translation in the Appendix of this article and are explained briefly below.
In the syllogism tasks (items 1 and 3, adapted from Stanovich et al., Citation2016) students had to verify the provided conclusion based on given premises. We considered these as counter-items, because they were non-formally stated and formally stated, respectively, but are about similar problem situations with similar conclusions. We conjecture that Venn and Euler diagrams are highly beneficial visualisations in these tasks, because those diagrams may represent the different sets provided and their underlying relations.
In items 2 and 4 (adapted from Geerlings, Citation2008; Stanovich et al., Citation2016) students had to explain for which situations a conclusion is possible/justifiable based on the if–then-claim provided, respectively non-formally stated and formally stated. A table provided four possible situations: affirming and denying the antecedent, and affirming and denying the consequent. Although all the four different situations occur within one context, we decided to split tasks 2 and 4 into two sub-items instead of taking the context as a whole like in other tasks: Item A about the antecedent and item B about the consequent. This was done based on results from our pilot intervention where we observed differences in students’ reasoning about the antecedent and reasoning about the consequent.
Item 5, a short everyday reasoning task, was based on an implication for which students had to explain why the reversal is not always allowed. We conjecture that a Venn or an Euler diagram is a highly beneficial visualisation for this task.
Items 6 (adapted from Roodhardt & Doorman, Citation2012, p. 42; “Rotterdammers leven anderhalf jaar korter,” Citation2008) and 7 (adapted from “Hof: Wilders moet worden vervolgd,” Citation2009; Reuling, Citation2014) contained short newspaper articles for which the journalists’ reasoning had to be analysed and supplemented with hidden assumptions. We assumed that our participants have sufficient prior knowledge on these topics. We conjecture that a scheme-based strategy is highly beneficial in these tasks to show connections between premises, reasoning steps, and the conclusion(s).
Item 8 (adapted from College voor Toetsen en Examens, Citation2013, p. 7) contained a larger formal reasoning task, stated in ordinary language, in which students had to solve a murder case. This task is suitable for a scheme-based strategy to get a clear overview of the situation and claims.
Due to identical pre- and post-tests, we performed a test-retest reliability study. Among the control group, the Pearson Correlation between the two measurements, two months apart from each other, is r(107) = .71, p < .001, which shows an acceptable reliability.
Scoring procedure
All items were scored on correctness of the final answer (0 or 1 point) as well as on the quality of explanations, based on sample solutions. Each reasoning step was scored with one point. Maximum scores per item are 3 or 4 points (see ).
Students’ use of formalisations was also coded, such as Euler/Venn diagrams, implication arrows, letter symbols, logical symbols, schemes, et cetera. The codes were based on the pilot study, although new codes could arise from the analysed data. Students could use more than one type of formalisations per task.
Example
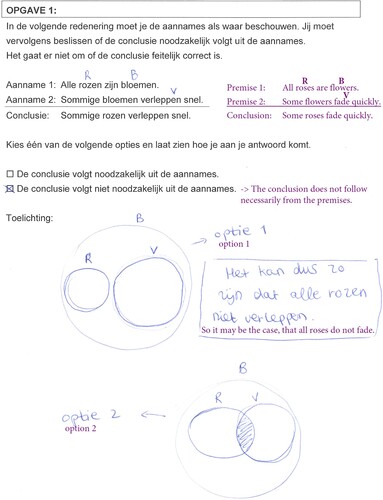
shows a solution from student Amy from the experimental group. Amy used letter symbols for roses (R), flowers (B), and fading (V). Thereafter, she drew two different possible options: one where roses do not necessarily fade, and one where some roses do fade. In both cases, Amy clearly showed that all R (roses) are B (flowers), but that the set of flowers (B) is much larger. Her answer gets one point for being correct (“not necessarily”) and two points for the provided explanation; one for the insight that roses are part of the set flowers and one for showing that fading does not necessarily intersect with the set roses. The sum score for this item is equal to the maximum score of three points. Concerning the formalisations, we coded for the use of letter symbols and for Euler diagrams.
Figure 2. Example solution item 1, student from experimental group, English translation in purple.
Inter-rater reliability
To analyse the inter-rater reliability of the scoring, the first two authors of this article scored the complete work of 10 students from one group. Krippendorff's alpha (Hayes & Krippendorff, Citation2007) was computed over the total score for all items and resulted into α = .92 and α = .82 respectively for the pre- and post-test, which is more than sufficient for a reliable analysis (≥ .80). Observed differences between raters were discussed to modify the scoring model to allow for 100% agreement. Based on those discussions the analysis model was supplemented. Thereafter, all students’ answers were scored by the first author.
Analysis
For the strategies and formalisations used (first research question), percentages of students that used those formalisations are visualised per item in bar charts for a comparison between the experimental and control group. The effect of the intervention on students’ application of formalisations on separate items was analysed by means of logistic regression analyses using observation of the application on the pre-test as control variable. The significance of effects was assessed by computing the Wald statistic and the extent of the effect is expressed in the form of odds ratios of using specific formalisations (Sieben & Linssen, Citation2009).
For the effect on students’ overall performance (second research question), repeated measurement analyses, including the effect size partial eta-squared (Draper, Citation2019), and t-tests were deployed to investigate the size and significance of differences between the experimental and the control conditions on individual items, groups of items, and total test scores. To control the family-wise error rate due to multiple comparisons, we used Holm's sequential Bonferroni procedure to adjust the raw p-values (Holm, Citation1979). Cohen's d is used to calculate effect sizes (Lakens, Citation2013).
Finally, for the relationship between the test scores and the conjectured beneficial formalisations (third research question), we performed Kendall's Tau (Cohen et al., Citation2011). We investigated the correlation between the use of Venn and Euler diagrams and the correctness of students’ answers for corresponding tasks as well as the use of scheme-based strategies and the correctness. Again, we used Holm's sequential Bonferroni procedure to adjust the raw p-values for multiple comparisons (Holm, Citation1979).
Results
Logbooks showed that the lessons were implemented according to plan. One teacher deviated somewhat from the planning due to time constraints, but the other teachers taught the 10 lessons prior to the post-test and reported high student participation in their logbooks. During most lessons, students received sufficient time to work on their own solutions and discussed their strategies in small groups. Teachers gave, according to self-reported logbooks, more and more attention to formalisations by explicitly asking students to explain their formal methods in groups and during classroom discourse. They also encouraged students to reconsider their solutions by suggesting the use of Venn or Euler diagrams.
In this section, we follow the order of the research questions. We present students’ use of formalisations in the different tasks first. Second, we will report on students’ overall performance indicating a large intervention effect. Third, we present the relation between students’ use of formalisations with the correctness of the answers.
Use of formalisations
In this subsection, we will illustrate students’ use of formalisations in the different tasks supplemented with logistic regression analyses for beneficial formalisations.
Syllogism tasks, formal reasoning tasks, formally and non-formally stated
and show that the intervention had a large influence on the use of formalisations in the syllogism tasks (items 1 and 3): students from the experimental group used more formalisations in the post-test than in the pre-test while there was very little change in the control group. For the non-formally stated version, 57.1% of the students in the experimental group used letter symbols for (parts of) the given premises in the post-test compared to 10.3% of the students in the control group. Between pre- and post-test, the use of Venn and Euler diagrams increased strongly for the formally stated version (from 5.4% to 57.1%) as well as in the non-formally stated version (from 3.6% to 53.6%) in the experimental group with hardly any changes in the control group. The Wald statistics reveal that the odds of using a Venn or an Euler diagram in the post-test items are 30.2 and 36.2 times higher respectively for students in the experimental group compared to students in the control group (Wald statistic = 34.6, p < .001 and Wald statistic = 30.9, p < .001 respectively).
Figure 3. Item 1, use of formalisations, non-formally stated syllogism task.
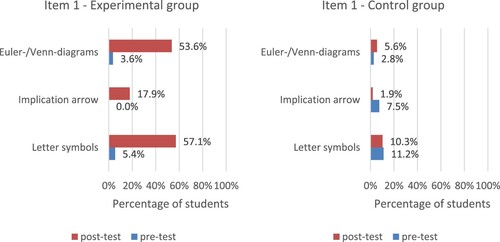
Figure 4. Item 3, use of formalisations or (informal) examples, formally stated syllogism task.
If–then statements, formal reasoning tasks, formally and non-formally stated
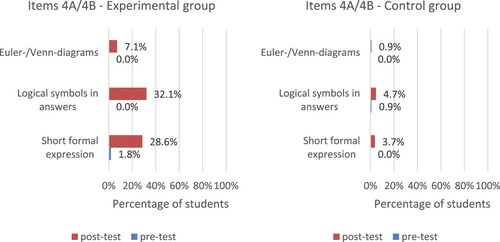
shows the use of formalisations for the task concerning a non-formally stated if–then-statement (items 2A & 2B). Although we found some increase in the use of formalisations among the students in the experimental group, for example from 0% to 14.3% between pre- and post-test for the use of Euler/Venn diagrams and 10.7% to 30.4% for the use of inequality signs, the majority of the students still did not use formalisations. For the task with the formally stated if–then-statement (items 4A & 4B), the use of formalisations in students’ answers was similar (see ). Notable is that a short formal expression (e.g. A ⇒ 3), which would have provided a clear visible implication for this task, was only used by 28.6% of the experimental students in the post-test. Further analysis reveals that the odds of using a short formal expression in the post-test item are 9.66 times higher for students in the experimental group compared to students in the control group (Wald statistic = 14.6, p < .001).
Figure 5. Items 2A/2B, use of formalisations, non-formally stated if-then statement.
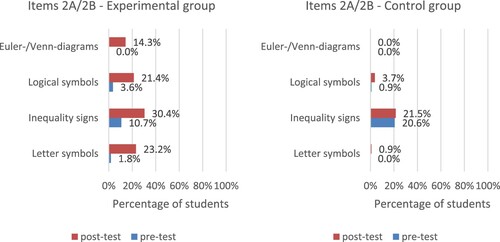
Figure 6. Items 4A/4B, use of formalisations, formally stated if-then statement.
Everyday reasoning tasks
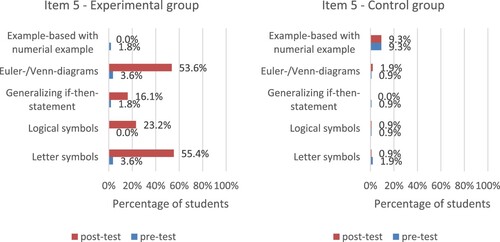
shows that there is a big change in the approach to tasks that involve the analysis of a short everyday reasoning proposition (item 5) among the students from the experimental group, while there are hardly any changes in the control group. Between pre- and post-test, the use of letter symbols increased from 3.6% to 55.4% in the experimental group and 23.2% used logical symbols in the post-test. Similar percentages were found for the use of Euler/Venn diagrams: from 3.6% to 53.6%. Further analysis reveals that the odds of using a Venn or an Euler diagram in the post-test item are 113 times higher for students in the experimental group compared to students in the control group (Wald statistic = 20.6, p < .001).
Figure 7. Item 5, use of formalisations or (informal) examples, short everyday reasoning task.
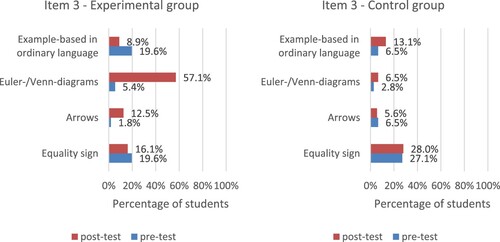
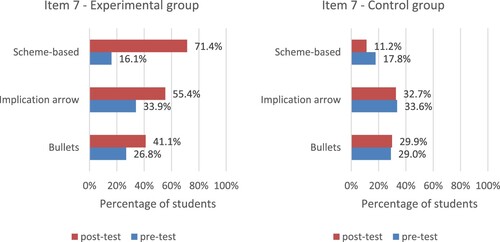
shows the use of formalisations for the task on revealing hidden assumptions in a newspaper article (item 6). Many students from both groups used bullet points to separate the three premises (reasons) in the pre- and post-test. For the connection between the premises and the hidden assumption(s) or conclusion(s), the use of implication arrows almost doubled within the experimental group to 39.3% in the post-test, compared to 26.2% in the control group. None of the students in the experimental group used a scheme-based strategy in the pre-test, which changed to 17.9% in the post-test. However, if explicitly asked for the different reasoning steps in another newspaper article task (item 7), many more students from the experimental group used a scheme-based approach (16.1% in the pre-test to 71.4% in the post-test, see ), providing structured answers: from premises via reasoning steps towards a conclusion. Further analysis reveals that the odds of schematising in the post-test item are 24.3 times higher for students in the experimental group compared to students in the control group (Wald statistic = 47.4, p < .001).
Figure 8. Item 6, use of formalisations, everyday reasoning task (newspaper article).
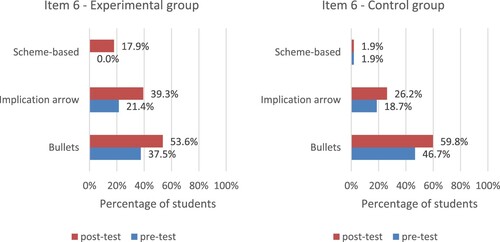
Figure 9. Item 7, use of formalisations, everyday reasoning task (newspaper article).
Murder case, formal reasoning task, non-formally stated
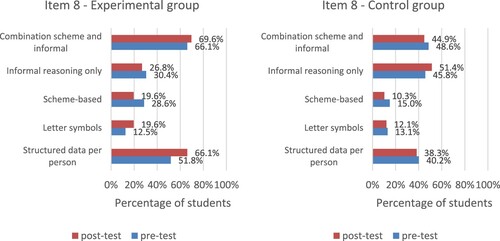
For the larger non-formally stated formal reasoning task, a murder case in item 8, we do not see much difference between pre- and post-test in both groups (see ). However, a change, from 51.8% to 66.1%, is visible in the experimental group for the strategy “structuring the data per person”, which is a formal approach to obtain an overview. Further analysis reveals that the odds of “structuring the data per person” in the post-test item are 3.12 times higher for students in the experimental group compared to students in the control group (Wald statistic = 9.08, p = .003).
Figure 10. Item 8, use of formalisations or (informal) examples, formally stated task (murder case).
Summary use of formalisations
In all tasks, we observe larger differences in students’ use of formalisations between pre- and post-test in the experimental condition. Further analyses by means of logistic regression show that the changes, in using Venn and Euler diagrams and scheme-based strategies in particular, between pre- and post-test are significant compared to the control group.
Overall test performance
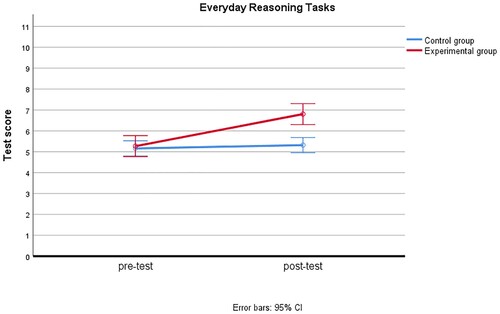
show the effect of our intervention. The differences between the two groups between the pre- and post-test are shown for the mean test scores as well as for grouped item scores per category of tasks (see division in ). The vertical axis is scaled to the maximum score for the total test, the formally stated formal reasoning tasks, the non-formally stated formal reasoning tasks, and the everyday reasoning tasks, respectively. Except for the formally stated formal reasoning tasks, the lower endpoint of the 95% confidence interval for the experimental group is larger than the upper endpoint from the control group for the post-test, while for the pre-test the results are quite similar. The interaction effect, denoting the difference between the groups in terms of the change between pre- and post-test scores is significant for all categories of tasks (p < .05): F(1, 161) = 31.99, p < .001, = .17 for the total test score, F(1, 161) = 4.09, p = .045,
= .025 for the formally stated formal reasoning tasks, F(1, 161) = 20.06, p < .001,
= .11 for the non-formally stated formal reasoning tasks, and F(1, 161) = 20.47, p < .001,
= .11 for the everyday reasoning tasks. For the total test score, the effect size is greater than .14, indicating a large intervention effect (Draper, Citation2019).
Figure 11. Interaction effect for total test.
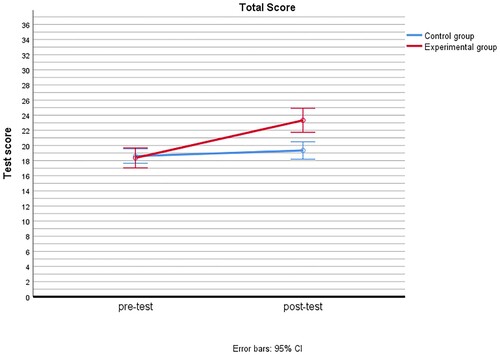
Figure 12. Interaction effect for formally stated formal reasoning tasks.
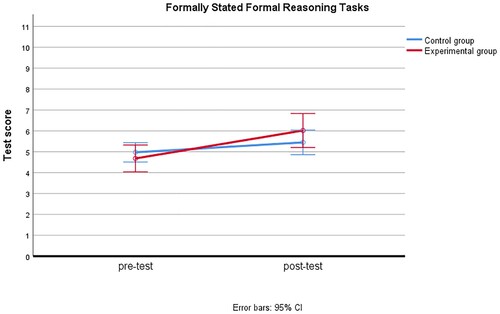
Figure 13. Interaction effect for non-formally stated formal reasoning tasks.
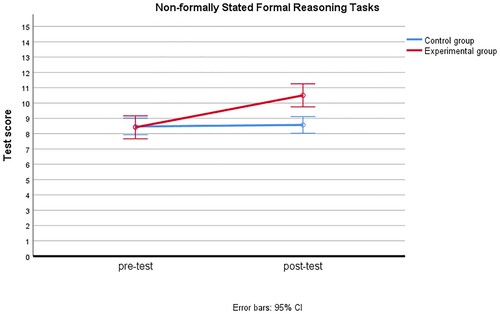
Figure 14. Interaction effect for everyday reasoning tasks.
Further analyses per item are shown in . This table shows the mean scores and standard deviations for each task for the experimental and the control group as well as the results of a Paired Samples t-test for repeated measures in both conditions, indicating the direction and the significance of the change between pre-test and post-test. To control the family-wise error rate due to multiple comparisons, we used Holm's sequential Bonferroni procedure to compute the adjusted p-values. For the combined scores of each group of tasks as well as for the total test scores, the increase is significant for the experimental group and not significant for the control group (see ). The effect sizes of these significant increases are, based in Cohen's d, even large for the grouped everyday reasoning tasks and for the total test score.
Table 2. Test scores pre- and post-test experimental and control group.
Concerning the separate tasks, the scores for item 2B changed significantly with medium effect sizes with p̃ < .05 for the experimental group and with p̃ < .01 for items 2A, 3, 4B, 5, 7, and 8. For the control group we only found a significant change for item 4B, but with a small effect size.
Notable is the difference between items 4A and 4B, both concerning a formally stated if–then-statement. Reasoning with the consequent given shows a significant increase in the scores within the experimental group (p̃ < .01), but the scores for reasoning with the antecedent given did not show significant changes (p̃ = .34).
Formalisations and correctness
We conjectured that the use of Venn and Euler diagrams in formal reasoning tasks will improve students’ reasoning, and that everyday reasoning tasks will benefit from scheme-based strategies. In this subsection, we will investigate the relation between these formalisations and the corresponding tasks.
Venn and Euler diagrams
Venn and Euler diagrams are useful in, respectively, a non-formally stated syllogism task, a formally stated syllogism task, and a short everyday reasoning task (items 1, 3, and 5). Kendall's Tau coefficients were calculated to verify for a positive correlation (one-tailed) between the test score and students’ use of Venn/Euler diagrams, see . To control the family-wise error rate due to multiple comparisons, we used Holm's sequential Bonferroni procedure to compute the adjusted p-values. As shown in , we found a positive correlation between the use of Venn and Euler diagrams and the scores on the syllogism tasks (items 1 and 3). For the experimental group the correlation is fairly strong (τb = .61, p̃ < .001) in the post-test for the formally stated version. However, using a Venn or an Euler diagram in a short everyday reasoning task (item 5) does not show a significant correlation with the scores.
Table 3. Correlation test scores and use of Venn/Euler diagram.
Scheme-based strategy
We hypothesised that in everyday reasoning tasks about the analysis of newspaper articles (items 6 and 7) a scheme-based strategy is beneficial as well as for larger non-formally stated formal reasoning tasks (murder case in item 8). Kendall's Tau coefficients were calculated to verify for a positive correlation (one-tailed) between the test scores and students’ use of scheme-based strategies, see . Again, we used Holm's sequential Bonferroni procedure to compute the adjusted p-values. As shown in , we did not compute the correlation for item 6 for the pre-test of the experimental group, because none of the students used a scheme-based strategy, but in the post-test, we found for items 6 and 7 positive, although weak, correlations. However, for the larger non-formally stated formal reasoning task, a scheme-based strategy has a clear positive correlation for the experimental group in the post-test, increasing from τb = .18, p̃ = .36 to a significant τb = .44, p̃ = .002.
Table 4. Correlation test scores and use of scheme-based strategy.
Conclusions and discussion
In this article, we reported on an intervention study on the feasibility of teaching students to use formalisations in their reasoning in formal and everyday reasoning tasks. This study was guided by three research questions, concerning (1) the use of formalisations in formally and non-formally stated formal reasoning tasks and in everyday reasoning tasks in pre- and post-test, (2) the effect of the intervention on students’ performance, and (3) the association between the use of formalisations and correctness of answers. The conclusions below focus on the experimental group unless stated otherwise.
Students’ use of formalisations
Answering the first research question on the use of formalisations, we found an increase in the use of formalisations in the post-test compared to the pre-test in the experimental condition, both in formal reasoning and everyday reasoning tasks. Students readily used letter symbols (see about items 1, 2A/2B, 5, 8 respectively) providing them with an overview of the information. Also, more complicated formalisations were applied by the students: more than 50% of the students from the experimental group used, for example, Venn and/or Euler diagrams in items 1, 3, and 5 (see ). In the experimental group we also found an increase of the use of logical symbols and/or implication arrows in the post-test compared to the pre-test, although less than 25% of the students used these formalisations (see ). We did not observe changes in the use of formalisations in the control group.
For everyday reasoning tasks, scheme-based strategies are useful for structuring student's reasoning. If explicitly asked to show reasoning steps (item 7), over 70% of the students in the experimental group used a scheme-based formal strategy in the post-test, while only a minority of the students used a scheme-based strategy in the pre-test (see about item 7). However, in another everyday reasoning task without an explicit reference to reasoning steps (item 6), the use of a scheme-based strategy was much lower (0% in the pre-test to 17.9% in the post-test). Again, we did not observe many changes in the use of formalisations in the control group.
Overall, we can conclude that students from the experimental group used formalisations, and Venn and/or Euler diagrams in particular, more often than students from the control group after the intervention. This difference is significant shown by logistic regression with the pre-test as control variable. In general, students from the experimental group are able to apply those strategies in all sorts of tasks, both in formal reasoning tasks and everyday reasoning tasks.
Development of logical reasoning
Answering the second research question about the effect of the course in logical reasoning with a focus on the use of formalisations, sufficient attention for students’ own solution methods, social interactions, and the application of discovered and learned formalisations in open-ended everyday reasoning tasks, we showed a large intervention effect ( = .17 > .14 for the total test score). We also showed that students’ performance in all groups of tasks mentioned in (formally stated formal reasoning task, non-formally stated formal reasoning tasks, and everyday reasoning tasks) as well as the total test scores increased significantly for the experimental group.
Remarkable is the difference between items 4A and 4B in which we asked students to reason with antecedents and consequents given an if–then-statement. The focus on if–then-statements during the lessons improved students’ cautiousness when dealing with if–then-claims. If a consequent is given, they have to evaluate the if–then-claim carefully before they approve a conclusion. In the formally stated task as well as the non-formally stated task, we saw significant improvement for reasoning with a given consequent (items 4B and 2B) within the experimental group. However, in the formally stated version of this task (item 4A), although the scores are reasonably high (see ), we did not see improvement when reasoning with a given antecedent, either in the experimental or in the control group. An explanation might be that students from the experimental group were too careful due to their increased knowledge for the situation of a provided consequent whereby a reversal of the if–then-claim is not allowed.
Some might link these items concerning if–then to the famous Wason selection task (Wason, Citation1968), which has received much criticism (Moshman, Citation1996; Stanovich et al., Citation2016; Wagner-Egger, Citation2007). We had, however, no intention to reopen those debates and, therefore, we did not use the original wording and presentation of the task, nor did we analyse answers separately. We used if–then-statements together with explanation boxes for certain antecedents and consequents. In that way, we forced students to carefully review each situation together with demanded justifications for their reasoning, so that their use of formalisations, became visible. We come back to this in the Limitations below.
Overall, this shows that for our specific target group of pre-university non-science students an approach with attention for supportive methods that structure the reasoning instead of focusing on formal logic is successful and this finding might explain the smaller effect size among undergraduate students in previous studies focusing on formal logic and conditional reasoning (e.g. Attridge et al., Citation2016; Cheng et al., Citation1986). Despite the attention on everyday reasoning tasks, it would be interesting to investigate if the logical reasoning skills students learned in this course are sustainable and can be transferred to other contexts to get more insights into the way these reasoning skills contribute to their future life in society, work, and study, which is essential for twenty-first century learning (NCTM, Citation2009; P21, Citation2015; Vincent-Lancrin et al., Citation2019).
Altogether, we can conclude that a course of 10 lessons in logical reasoning with specific attention to formalising and visualising statements and reasoning, in particular by means of Venn and Euler diagrams, is highly beneficial.
The role of formalisations on logical reasoning
Answering the third research question, we found positive correlations between the use of formalisations and the correctness of students’ answers (see and ). In formal reasoning tasks, the correlation is the highest: positive correlations are found between the use of Venn and Euler diagrams and the scores for the syllogism tasks (items 1 and 3) in the post-test, and between the use of scheme-based strategies and the scores for the non-formally stated murder case (item 8). But the latter was only significant for the experimental group.
Although the post-test scores for the syllogism tasks in this study are still relatively low, the increase of scores within the experimental group is significant and for the formally syllogism task are scores on average 2.5 times higher than in the pre-test. This, combined with the positive correlations, shows that using Venn and Euler diagrams is highly beneficial and, thus, should be incorporated in the daily classroom discourse as also suggested by our earlier conducted exploratory study (Bronkhorst et al., Citation2020).
Contrary to our expectations, we did not find high correlations between the use of scheme-based strategies and the scores for the newspaper article tasks, despite improved total scores on the tasks themselves in the experimental group (everyday reasoning tasks, items 6 and 7) and even significantly for item 7. Probably, differences between these two tasks are an explanation for this finding: item 6 is more open and both items demand different prior knowledge. Although we assumed that our participants had sufficient prior knowledge on these topics, it shows, again, the complex matter of (research on) everyday life reasoning (Galotti, Citation1989).
Limitations
In our research, the control group did not receive teaching in logical reasoning, so that we could verify for changes over time and for retest effects. Because of practical reasons we were not able to compare the experimental group with groups that were taught in logical reasoning with their regular mathematics books, nor with science students. The most used Dutch textbook (Dijkhuis et al., Citation2017) mainly provides step-by-step plans to solve logical reasoning exercises without specific attention for the discovery of own formalisations. This way of teaching is still common practice in most countries, like the UK and USA (Nesmith, Citation2008; Pampaka & Williams, Citation2016; “Traditional teaching methods still dominant in maths classrooms,” Citation2012). If our teaching strategy shows significant improvements compared to the more traditional ways of teaching, it might provide further evidence that it is important to incorporate meaningful tasks related to everyday experiences with room for students’ own solutions and explaining/justifying those to their peers (Gravemeijer, Citation2020; National Research Council, Citation1999). Keijzer and Terwel (Citation2003), for example, explain that meaningful tasks and formalising as an activity for exploring fractions should also be used by low-achieving students because they are also entitled to insightful learning. That is possible as long as those students will not be confused by other arithmetic and mathematical topics that are presented as step-by-step recipes. A precondition is, however, the quality of the teacher, for whom these activities probably demand different teaching strategies, which many teachers are not familiar with (KNAW, Citation2009, Chapter 2).
The test we used was validated with a pilot study and had a more than sufficient inter-rater reliability, but it is important to note that the predetermined weighing of the items affects the total scores of the students. The maximum score per item is 3 or 4 points based on the reasoning steps needed, because we were interested in the actual reasoning and not only in the final answers. On the other hand, the specific demand for explanations might have triggered students enough to review the given situations more carefully, which complicates comparisons with other studies. Still, when we looked at conditional reasoning specifically, we found significantly improved scores for dealing with the consequent. Quintana and Correnti (Citation2019), for example, did not find differences in test scores in determining if such arguments are logically valid in closed questions, despite valuable results concerning everyday arguments. Our results also contradict previously mentioned findings from Cheng et al. (Citation1986), but supplement findings from Attridge et al. (Citation2016), who showed that improvement in logical reasoning is possible, in particular if students had previous experience with logic. Nevertheless, it might be interesting to compare experimental groups with and without specific demands for explanations in their pre- and post-tests.
Future research and recommendations
Overall, this study shows positive effects of teaching logical reasoning with a focus on the use of formalisations, including visualisations and schematisations. The observed increase in test scores on all kind of reasoning tasks, including everyday reasoning tasks, seems promising for developing critical thinking skills as part of the 21st century skills (P21, Citation2015) and thus for students’ future lives, not only in tertiary education, but also in their subsequent professions and for everyday life situations. We therefore recommend to use the described design characteristics for courses on logical reasoning, with the aim to develop critical thinking skills in and outside school. For future research we recommend to investigate long-term effects to see if students will continue using formalisations to decide if conclusions in, for example, newspapers are valid.
Disclosure statement
No potential conflict of interest was reported by the author(s).
Additional information
Funding
References
- Adey, P., & Shayer, M. (1993). An exploration of long-term far-transfer effects following an extended intervention program in the high school science curriculum. Cognition and Instruction, 11(1), 1–29.
- Attridge, N., Aberdein, A., & Inglis, M. (2016). Does studying logic improve logical reasoning? In C. Csíkos, A. Rausch, & J. Szitányi (Eds.), Proceedings of the 40th Conference of the International Group for the psychology of mathematics education (Vol. 2, pp. 27–34). PME.
- Bronkhorst, H., Roorda, G., Suhre, C., & Goedhart, M. (2018). Secondary students’ logical reasoning abilities. In E. Bergqvist, M. Österholm, C. Granberg, & L. Sumpter (Eds.), Proceedings of the 42nd Conference of the International Group for the psychology of mathematics education (Vol. 5, pp. 271). PME.
- Bronkhorst, H., Roorda, G., Suhre, C., & Goedhart, M. (2020). Logical reasoning in formal and everyday reasoning tasks. International Journal of Science and Mathematics Education, 18(8), 1673–1694. https://doi.org/10.1007/s10763-019-10039-8
- Brookhart, S. M. (2010). How to assess higher-order thinking skills in your classroom. ASCD.
- Carrascal, B. (2011). Teaching logic in philosophy. In P. Blackburn, H. van Ditmarsch, M. Manzano, & F. Soler-Toscano (Eds.), Tools for teaching logic (Vol. 6680, pp. 38–45). Springer Berlin Heidelberg.
- Cheng, P. W., Holyoak, K. J., Nisbett, R. E., & Oliver, L. M. (1986). Pragmatic versus syntactic approaches to training deductive reasoning. Cognitive Psychology, 18(3), 293–328. https://doi.org/10.1016/0010-0285(86)90002-2
- Cohen, L., Manion, L., & Morrison, K. (2011). Research methods in education (7th ed.). Routledge.
- College voor Toetsen en Examens. (2013, June 13). Examen VWO 2013 wiskunde C (pilot), tijdvak 1. https://www.examenblad.nl/examendocument/2013/cse-1/wiskunde-c-vwo/opgaven-2/2013/vwo/f=/vw-1026-f-13-1-o.pdf
- College voor Toetsen en Examens. (2016). WISKUNDE C VWO | syllabus centraal examen 2018 (Bij het nieuwe examenprogramma) nader vastgesteld 2. https://www.examenblad.nl/examenstof/syllabus-2018-wiskunde-c-vwo/2018/vwo/f=/syllabus_wiskunde_C_2_versie_vwo_2018_nader_vastgesteld2_def.pdf
- Cook, T. D., & Campbell, D. T. (1979). Quasi-experimentation: Design & analysis issues for field settings. Rand McNally College Pub. Co.
- cTWO. (2012). Denken & doen: Wiskunde op de havo en vwo per 2015. https://slo.nl/@9637/denken-wiskunde-havo/
- Daniel, D. B., & Klaczynski, P. A. (2006). Developmental and individual differences in conditional reasoning: Effects of logic instructions and alternative antecedents. Child Development, 77(2), 339–354. https://doi.org/10.1111/j.1467-8624.2006.00874.x
- Department of Education UK. (2014, July 16). National curriculum in England: Mathematics programmes of study – GOV.UK. https://www.gov.uk/government/publications/national-curriculum-in-england-mathematics-programmes-of-study/national-curriculum-in-england-mathematics-programmes-of-study
- Dijkhuis, J., Admiraal, C. J., Verbeek, J. A., De Jong, G., Houwing, H., Kuis, J. D., Ten Klooster, F., De Waal, S., Van Braak, J., Liesting-Maas, J. H. M., Wieringa, M., Van Maarseveen, M., Hiele, R. D., Romkes, R. D., Haneveld, M., Voets, S., & Cornelisse, I. (2017). Getal & Ruimte 11e editie vwo C deel 4. Noordhoff Uitgevers.
- Draper, S. (2019, February 17). Effect size. http://www.psy.gla.ac.uk/~steve/best/effect.html
- Evans, J. S. B. T. (2002). Logic and human reasoning: An assessment of the deduction paradigm. Psychological Bulletin, 128(6), 978–996. https://doi.org/10.1037/0033-2909.128.6.978
- Galotti, K. M. (1989). Approaches to studying formal and everyday reasoning. Psychological Bulletin, 105(3), 331–351.
- Geerlings, J. (2008, April). Werkstuk vwo-5 wa1/wa1,2 “Logisch redeneren.” http://www.fi.uu.nl/ctwo/lesmateriaaldir/ExperimenteelLesmateriaal/VWO%20Wiskunde%20C/Logisch%20Redeneren/Oud%20materiaal/toetsideeen/20080404_Gregorius_WerkstukLogica_vwo5_a1_a12.doc
- Gravemeijer, K. (1999). How emergent models may foster the constitution of formal mathematics. Mathematical Thinking and Learning, 1(2), 155–177. https://doi.org/10.1207/s15327833mtl0102_4
- Gravemeijer, K. (2020). A socio-constructivist elaboration of realistic mathematics education. In M. V. den Heuvel-Panhuizen (Ed.), National reflections on the Netherlands didactics of mathematics: Teaching and learning in the context of realistic mathematics education (pp. 217–233). Springer International Publishing. https://doi.org/10.1007/978-3-030-33824-4
- Grouws, D. A., & Cebulla, K. J. (2000). Improving student achievement in mathematics. Educational practices series 4 (ED445925). ERIC. https://eric.ed.gov/?id=ED445925
- Halpern, D. F. (1998). Teaching critical thinking for transfer across domains: Dispositions, skills, structure training, and metacognitive monitoring. American Psychologist, 53(4), 449–455.
- Halpern, D. F. (2014). Thought and knowledge: An introduction to critical thinking (5th ed.). Psychology Press.
- Hansen, H., & Cohen, D. (2011). Are there methods of informal logic? In F. Zenker (Ed.), Argumentation: Cognition and community. proceedings of the 9th international conference of the Ontario Society for the Study of Argumentation (CD ROM, pp. 1–13). OSSA, Windsor.
- Hayes, A. F., & Krippendorff, K. (2007). Answering the call for a standard reliability measure for coding data. Communication Methods and Measures, 1(1), 77–89. https://doi.org/10.1080/19312450709336664
- Hof: Wilders moet worden vervolgd. (2009, January 21). NRC Handelsblad. https://www.nrc.nl/nieuws/2009/01/21/hof-wilders-moet-worden-vervolgd-11671820-a414693
- Holm, S. (1979). A simple sequentially rejective multiple test procedure. Scandinavian Journal of Statistics, 6(2), 65–70. JSTOR.
- Johnson, R. H., & Blair, J. A. (2006). Logical self-defence. Central European Uni Press.
- Keijzer, R., & Terwel, J. (2003). Kansen voor formaliseren als wiskundige activiteit in het basisonderwijs. Nieuwe wiskrant, 23(1), 25–28.
- KNAW. (2009). Rekenonderwijs op de basisschool: Analyse en sleutels tot verbetering: advies (p. 113). Koninklijke Nederlandse Akademie van Wetenschappen.
- Kuhn, D. (1991). The skills of argument. Cambridge University Press.
- Lakens, D. (2013). Calculating and reporting effect sizes to facilitate cumulative science: A practical primer for t-tests and ANOVAs. Frontiers in Psychology, 4, https://doi.org/10.3389/fpsyg.2013.00863
- Liu, H., Ludu, M., & Holton, D. (2015). Can K-12 math teachers train students to make valid logical reasoning? In X. Ge, D. Ifenthaler, & J. M. Spector (Eds.), Emerging technologies for STEAM education: Full STEAM ahead (pp. 331–353). Springer International Publishing. https://doi.org/10.1007/978-3-319-02573-5_18
- McChesney, J. (2017). Searching the New Zealand curriculum landscape for clarity and coherence: Some tensions in mathematics and statistics. Curriculum Matters, 13, 115–131.
- McKendree, J., Small, C., Stenning, K., & Conlon, T. (2002). The role of representation in teaching and learning critical thinking. Educational Review, 54(1), 57–67. https://doi.org/10.1080/00131910120110884
- Moshman, D. (1996). The development of metalogical understanding. In L. Smith (Ed.), Critical readings on Piaget. Routledge.
- National Research Council. (1999). How people learn: Brain, mind, experience, and school (J. Bransford, A. L. Brown, & R. R. Cocking, Eds.). National Academies Press.
- National Research Council. (2001). Adding it up: Helping children learn mathematics (B. Findell, J. Swafford, & J. Kilpatrick, Eds.). National Academy Press.
- NCTM. (2009). Focus in high school mathematics. Reasoning and sense making. National Council of Teachers of Mathematics.
- Nesmith, S. J. (2008). Mathematics and literature: Educators’ perspectives on utilizing a reformative approach to bridge two cultures. Forum on Public Policy Online, 2008(2) (EJ1099543). ERIC. https://eric.ed.gov/?id=EJ1099543
- NGA Center and CCSSO. (2016). Common core state standards for mathematics. http://www.corestandards.org/wp-content/uploads/Math_Standards1.pdf
- P21. (2015, May). P21 framework definitions. http://www.p21.org/storage/documents/docs/P21_Framework_Definitions_New_Logo_2015.pdf
- Pampaka, M., & Williams, J. (2016). Mathematics teachers’ and students’ perceptions of transmissionist teaching and its association with students’ dispositions. Teaching Mathematics and its Applications, 35(3), 118–130.
- Quintana, R., & Correnti, R. (2019). The right to argue: Teaching and assessing everyday argumentation skills. Journal of Further and Higher Education, 43(8), 1133–1151. https://doi.org/10.1080/0309877X.2018.1450967
- Reuling, H. (2014, March 19). Materiaal bij workshop “Logische redeneren” in het programma vwo wisC 2015 wisC-dag (SLO). https://prezi.com/embed/9hs2d9d48y83/
- Rojas-Drummond, S., & Mercer, N. (2003). Scaffolding the development of effective collaboration and learning. International Journal of Educational Research, 39(1), 99–111. https://doi.org/10.1016/S0883-0355(03)00075-2
- Roodhardt, A., & Doorman, M. (2012). Experimentele uitgave voor logisch redeneren, vwo, wiskunde C. CTWO.
- Rotterdammers leven anderhalf jaar korter. (2008, February 8). NRC Handelsblad. https://www.nrc.nl/nieuws/2008/02/08/rotterdammers-leven-anderhalf-jaar-korter-11483688-a374237
- Schoenfeld, A. H. (1991). On mathematics as sense-making: An informal attack on the unfortunate divorce of formal and informal mathematics. In J. F. Voss, D. N. Perkins, & J. W. Segal (Eds.), Informal reasoning and education (pp. 311–343). L. Erlbaum Associates.
- Sieben, I., & Linssen, L. (2009). Logistische regressie analyse: Een handleiding. Retrieved from https://www.ru.nl/publish/pages/771745/logistischeregressie.pdf
- Stanovich, K. E., West, R. F., & Toplak, M. E. (2016). The rationality quotient: Toward a test of rational thinking. The MIT Press.
- Teig, N., & Scherer, R. (2016). Bringing formal and informal reasoning together—A new era of assessment? Frontiers in Psychology, 7, 1097. https://doi.org/10.3389/fpsyg.2016.01097
- Traditional teaching methods still dominant in maths classrooms. (2012, June 9). https://www.manchester.ac.uk/discover/news/traditional-teaching-methods-still-dominant-in-maths-classrooms/
- Van Aalten, P., & De Waard, K. (2001). Denklessen. APS.
- Van den Akker, J., Bannan, B., Kelly, A. E., Nieveen, N., & Plomp, T. (2013). Educational design research. Part A: An introduction. SLO.
- Van Gelder, T. (2005). Teaching critical thinking: Some lessons from cognitive science. College Teaching, 53(1), 41–48.
- Vincent-Lancrin, S., González-Sancho, C., Bouckaert, M., de Luca, F., Fernández-Barrerra, M., Jacotin, G., Urgel, J., & Vidal, Q. (2019). Fostering students’ creativity and critical thinking: What it means in school. Centre for Educational Research and Innovation. https://www.oecd-ilibrary.org/content/publication/62212c37-en
- Voss, J. F., Perkins, D. N., & Segal, J. W. (Eds.). (1991). Informal reasoning and education. L. Erlbaum Associates.
- Wagner-Egger, P. (2007). Conditional reasoning and the Wason selection task: Biconditional interpretation instead of reasoning bias. Thinking and Reasoning, 13(4), 484–505. https://doi.org/10.1080/13546780701415979
- Wason, P. C. (1968). Reasoning about a rule. The Quarterly Journal of Experimental Psychology, 20(3), 273–281.
- Yackel, E., Cobb, P., & Wood, T. (1991). Small-group interactions as a source of learning opportunities in second-grade mathematics. Journal for Research in Mathematics Education, 22(5), 390–408. https://doi.org/10.2307/749187
Appendix
Pre- and post-test logical reasoning, translation into English
Note: Adapted from The rationality quotient: Toward a test of rational thinking (pp. 340–341), by K. E. Stanovich, R. F. West, and M. E. Toplak, 2016, Cambridge, MA: The MIT Press.
Note: Adapted from “Werkstuk vwo-5 wa1/wa1,2 ‘Logisch redeneren’,” by J. Geerlings, Citation2008. Retrieved from www.fi.uu.nl/ctwo/lesmateriaaldir/ExperimenteelLesmateriaal/VWO%20Wiskunde%20C/Logisch%20Redeneren/Oud%20materiaal/toetsideeen/20080404_Gregorius_WerkstukLogica_vwo5_a1_a12.doc
Note: Adapted from The rationality quotient: Toward a test of rational thinking (pp. 335–336), by K. E. Stanovich, R. F. West, and M. E. Toplak, 2016, Cambridge, MA: The MIT Press.
Note: Adapted from Experimentele uitgave voor Logisch redeneren, vwo, wiskunde C (p. 42), by A. Roodhardt, and M. Doorman, 2012, Utrecht, the Netherlands: cTWO. “Rotterdammers leven anderhalf jaar korter.” (Citation2008). NRC Handelsblad. Retrieved from https://www.nrc.nl/nieuws/2008/02/08/rotterdammers-leven-anderhalf-jaar-korter-11483688-a374237
Note: Adapted from “Materiaal bij workshop ‘Logische redeneren’ in het programma vwo wisC 2015 wisC-dag (SLO),” by H. Reuling, 2014. Retrieved from https://prezi.com/embed/9hs2d9d48y83/. “Hof: Wilders moet worden vervolgd.” (Citation2009). NRC Handelsblad. Retrieved from https://www.nrc.nl/nieuws/2009/01/21/hof-wilders-moet-worden-vervolgd-11671820-a414693
Note: Adapted from “Examen VWO 2013 wiskunde C (pilot), tijdvak 1.” (2013, p. 7). College voor Toetsen en Examens. Retrieved from https://www.examenblad.nl/examendocument/2013/cse-1/wiskunde-c-vwo/opgaven-2/2013/vwo/f=/vw-1026-f-13-1-o.pdf