
ABSTRACT
Macroautophagy (hereafter autophagy) is a conserved intracellular degradation mechanism required for cell survival. A double-membrane structure, the phagophore, is generated to sequester cytosolic cargos destined for degradation in the vacuole. The mechanism involved in the biogenesis of the phagophore is still an open question. We focused on 4 autophagy-related (Atg) proteins (Atg2, Atg9, Atg14, and Atg18), which are involved in the formation of the phagophore in order to gain a more complete understanding of the membrane dynamics that occur during formation of the autophagosome. The corresponding mutants, while defective in autophagy, nonetheless generate the membrane-bound form of Atg8, allowing us to use this protein as a marker for the nascent autophagosome precursor membrane. Using electron microscopy (EM), we discovered in these atg mutants a novel single-membrane structure (~120 to 150 nm in size). Electron tomography revealed that this structure originates from a part of the nuclear membrane, and we have named it the alphasome. Our data suggest that the alphasome is associated with Atg8, and sequesters selective cargo, the Cvt complex, during autophagy.
Abbreviations: 3D: three-dimensional; AB: autophagic body; AP: autophagosome; Atg: autophagy-related; Cvt: cytoplasm-to-vacuole targeting; EM: electron microscopy; IEM: immunoelectron microscopy; L: lipid droplet; N: nucleus; NM: nuclear membrane; PAS: phagophore assembly site; PE: phosphatidylethanolamine; prApe1: precursor aminopeptidase I; rER: rough endoplasmic reticulum; TEM: transmission electron microscopy; V: vacuole; VLP: virus-like particle;
Introduction
Macroautophagy (hereafter autophagy) plays important roles in cellular homeostasis and is connected to many aspects of cell physiology and development including immune defense, cellular remodeling in response to changing nutrients and cellular differentiation; conversely, defects in autophagy are associated with a range of human diseases including cancer, diabetes, metabolic disorders and neurodegeneration [Citation1–Citation4]. Autophagy plays a critical role in the breakdown of cytoplasmic components including superfluous or dysfunctional organelles, through the induction of a dynamic membrane system that delivers cargo through either selective or nonselective pathways to the degradative compartment, the vacuole/lysosome. Under nutrient-starvation conditions, double-membrane vesicles termed autophagosomes are newly formed in the cytoplasm [Citation5]. Although much work has gone into understanding the source of the membranes and the mechanism involved in autophagosome formation [Citation6–Citation11], the details of the process are still the subject of considerable debate and have resulted in several potentially contradictory models. In yeast, most Atg proteins transitionally accumulate at a single specialized perivacuolar location called the phagophore assembly site (PAS), which is largely uncharacterized; however, autophagosomes are thought to emerge at this site [Citation12].
Atg8 is a ubiquitin-like protein that is covalently conjugated to the phospholipid phosphatidylethanolamine (PE) [Citation13]. In a previous report involving immunoelectron microscopy (IEM) analysis, HA-tagged Atg8 protein is detected on the autophagosome membrane and inside autophagic bodies (the single-membrane vesicles that are generated by fusion of an autophagosome with the vacuole) in the yeast vacuole using an anti-HA antibody [Citation14]. In contrast, essentially none of the other Atg proteins (with the exception of some receptors such as Atg19) [Citation4] remain associated with the completed autophagosome at easily and morphologically detectable levels. Therefore, Atg8 serves as an ideal marker protein for the detection of autophagic structures, and it can be used for morphological analyses by fluorescence and electron microscopy.
The anti-Atg8 antibody used in our studies binds at the N terminus of the protein and has a high affinity for the lipidated form of Atg8, Atg8–PE [Citation13]. In addition, Atg8–PE can be clearly resolved from the free form of Atg8 by SDS-PAGE and detected by western blot analysis [Citation15]. The loss of most of the individual Atg proteins results in an essentially complete block in autophagosome formation. However, even in this situation, western blot data indicate that Atg8 is still converted to the PE-conjugated form, including in atg mutants that function in the step of phagophore formation [Citation12]. Therefore, we predicted that this anti-Atg8 antibody would recognize Atg8-specific signals on the membrane that correspond to the early stages of autophagosome formation in atg mutants that still generate Atg8–PE. Indeed, these mutants display Atg8 as a punctate structure near the vacuole as seen by fluorescence microscopy [Citation16–Citation18]. Based on EM, some of these mutants have a ‘leaky’ phenotype with regard to autophagy, because they accumulate autophagic bodies – albeit of smaller than normal size – in the vacuole [Citation19], and they were excluded from our study. Finally, we selected 4 mutants (atg2∆, atg9∆, atg14∆, and atg18∆) that have defects in autophagosome formation, as well as the atg1∆ mutant. Atg1 functions in the signaling pathway that induces autophagy under starvation conditions; it is part of a protein kinase complex that is placed in a functionally separate group from the other 4 proteins in our study, thus adding to the potential stages of the pathway covered in our analysis [Citation4]. Atg9 is an essential transmembrane protein for autophagy, and it plays a central role in generating the autophagosome [Citation20–Citation23]; Atg2 interacts with Atg18, and this complex is required for the movement of Atg9 during autophagosome formation [Citation24,Citation25]. Atg14 binds to Vps34, Vps30/Atg6, Vps15 and Atg38 to form the class III phosphatidylinositol 3-kinase complex I, which is specifically involved in double-membrane vesicle formation; for example, Atg18 recruitment to the PAS involves binding to phosphatidylinositol-3-phosphate [Citation1].
The newly synthesized precursor form of aminopeptidase I (prApe1) is one of the selective cargos sequestered by the phagophore, and it is transported via the cytoplasm-to-vacuole targeting (Cvt) pathway or autophagy, depending on the nutrient conditions, in the form of a large oligomer [Citation26]. The prApe1 oligomer bound to the receptor Atg19 is referred to as the Cvt complex, and EM was used to morphologically identify the corresponding structure [Citation27]. The central core of the Cvt complex, composed primarily of prApe1, appears as an electron-dense structure, and the phagophore, Cvt vesicle or autophagosome membrane is tightly associated with the complex due to the interaction between Atg19 and Atg8–PE lining the concave surface of the sequestering compartment [Citation27,Citation28]. Thus, prApe1 in the context of the Cvt complex provides a very useful and easily distinguishable morphological landmark that serves as a good marker for the detection of autophagy-related membrane structures that otherwise might lack specific proteins on ultrathin sections used for EM examination.
In this study, we searched for Atg8-positive early membrane structures sequestering a Cvt complex in atg mutants. Using IEM, we discovered a novel membrane-bound structure, named the alphasome, under nitrogen-starvation conditions. Electron tomography demonstrated that the alphasome was generated from the nuclear membrane in the mutants we analyzed. We propose that the alphasome is the initial sequestering membrane for binding the core of the Cvt complex.
Results
Specific detection of the lipidated form of Atg8 using anti-Atg8 antibody by IEM
First, we assessed whether the anti-Atg8 antibody we used specifically stained the PE-conjugated Atg8 protein on ultrathin sections, similar to the results obtained in a previous western blotting analysis [Citation15]. In this control analysis, we used 2 strains, pep4∆ cells, and atg4∆ atg8∆ cells expressing [3HA (hemagglutinin)]-Atg8 ∆R, which lacks the C-terminal arginine; because of this alteration, Atg8 ∆R does not require Atg4-dependent processing to be conjugated to PE. Therefore, this Atg8 cannot be deconjugated from PE in the absence of Atg4, and as a result serves as a membrane-bound control [Citation29]. Autophagy was induced by the deprivation of nitrogen. Deletion of the PEP4 gene enables us to observe autophagic bodies accumulated in the vacuole lumen [Citation30]. As previously reported [Citation14], anti-HA antibody recognized both HA-tagged proteins, the free form of Atg8 present in the cytoplasm and within the lumen of autophagic bodies, and Atg8–PE present on the limiting membrane of autophagic bodies in atg8∆ pep4∆ cells expressing [3HA]-Atg8. In contrast to the results with anti-HA antibody [Citation14], the anti-Atg8 antibody detected only autophagosome- and phagophore membrane-bound Atg8–PE in the atg4∆ atg8∆ cells expressing [3HA]-Atg8 ∆R (Figure S1A). Finally, we examined the localization of untagged Atg8 in pep4∆ cells using the anti-Atg8 antibody. Gold particles exclusively decorated membranous regions of nascent autophagosomes and phagophores (Figure S1B and C, arrowheads). Atg8-specific signals within the autophagic bodies were rarely seen (Figure S1D), that is; 78% of the autophagic bodies had no gold particles (13 of 60 autophagic bodies displayed gold particles), and when gold particles were detected, they were typically seen on the limiting membrane.
These results indicated that the anti-Atg8 antibody used in this study specifically recognized Atg8–PE, but not the soluble form of Atg8 on ultrathin sections analyzed by IEM.
Detection of a novel membrane structure in atg mutants
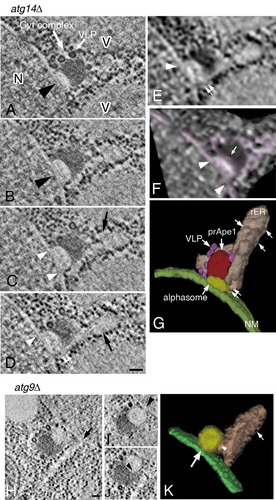
Several atg mutants, such as atg1∆, atg2∆, atg9∆, atg14∆, and atg18∆ are unable to form autophagosomes, although the Atg8–PE conjugation system is not affected [Citation12]. To determine the nature of the early intermediate structure that contributes to autophagosome formation we investigated these mutants by IEM. In all of the mutants, with the exception of atg1∆ cells, we found Atg8-positive membrane structures near the nucleus or vacuole (, arrows). These Atg8-positive membranes corresponded to small spherical-like structures, which ranged in size from 120 nm to 150 nm in atg2∆ (), atg9∆ (), atg14∆ ()), and atg18∆ () cells. The lumen of this structure was mostly electron transparent, and the membrane of this structure was decorated by gold particles, indicating the presence of Atg8–PE. Although the spherical structures were labeled with anti-Atg8 antibody, the gold particles were completely excluded from the nuclear membrane () and from the vacuolar membrane (). In contrast, we often noticed that the spherical structure decorated with gold particles, localized near the contact region between the nucleus and the vacuole (, arrowheads). In most cases, the Atg8-positive membrane structures were in contact with the core region of the Cvt complex, which was stained with anti-Ape1 antibody (). Ty1 virus-like particles (VLPs), another component of the Cvt complex [Citation31], were observed in the area next to the core region of the complex () or fixed to an Atg8-positive membrane structure (), arrow). Occasionally, a tubular membrane structure seemed to originate from the Atg8-positive membranes (, arrowheads). A part of this membrane seemed to be bound with ribosomes (, arrowhead). The IEM images showed that this tubular membrane structure was not stained with anti-Atg8 antibody. We drew a schematic of the image corresponding to ) to help with the interpretation of these data, and to point out the tubular membrane structure (labeled 2 in )). In contrast, Atg8–PE was localized around the Cvt complex in atg1∆ cells (); however, the spherical membrane structures, observed in the other 4 atg mutants, were not detected in this strain.
Figure 1. Detection of novel Atg8-positive membrane structures in atg mutants using anti-Atg8 and anti-Ape1 antibodies. (A to F) atg2∆, (G to I) atg9∆, (J) atg14∆, (K and L) atg18∆, and (M and N) atg2∆ cells were grown in YPD to mid-log phase and shifted to SD-N medium for 3 h, then processed for IEM. Sections were stained with anti-Atg8 (A to L) or anti-Ape1 (M and N) antibodies. (F) A schematic model corresponding to (E). No. 1 means Atg8-positive membrane structure (subsequently an alphasome). No. 2 means tubular membrane structure. A part of the structure shows ribosome-bound membrane. Large arrows mark Atg8-positive membranes, and arrowheads point to tubular membrane structures. Small arrows mark Ty1 VLPs. G, gold particle; N, nucleus; R, ribosome; V, vacuole; VLP, virus-like particle. Scale bars: 100 nm.
Figure 2. Localization of Atg8–PE in atg1∆ cells stained with anti-Atg8 antibody. Cells were grown in YPD to mid-log phase and shifted to SD-N medium for 3 h, then processed for IEM as in . The electron dense core of the Cvt complex, comprised primarily of prApe1, is marked with an arrow. V, vacuole. Scale bar: 100 nm.
These results suggest that an Atg8-positive membrane structure is formed in atg mutants that are defective in the proteins that participate in membrane formation and/or expansion of the phagophore. IEM analysis revealed that the localization of Atg8–PE was completely confined to the spherical structures. In addition, the Atg1 complex, which acts at an initial step in autophagosome formation, is required for the generation of the spherical structure.
Morphological features of the Atg8-positive membrane structure
To investigate the details of the Atg8-positive membrane structures, we further observed ultrathin sections of the atg mutants by using a rapid immobilization fixation method including osmium fixative solution. In atg1∆ cells, the Cvt complex was localized to the periphery of the vacuole without the spherical structure (), white arrow), and Ty1 VLPs were present around the core of the Cvt complex (), arrowhead) similar to our previous results (). We next examined the single membrane-bound structure that is attached to the electron-dense core region of the Cvt complex as observed in IEM (). The size of the spherical structure was almost the same as that of the Atg8-positive membrane structure observed in IEM () and its lumen was rather electron transparent. The spherical membrane structure was usually observed next to the vacuole or nucleus (). In addition, we also found that the membrane structures seemed to protrude from the outer nuclear membrane (, black and white arrows). Ty1 VLPs were excluded from the site of contact between these membranes and the core of the Cvt complex, but could be detected on the opposite side of the membrane (, arrowheads). In some cases, ribosome-attached, rough endoplasmic reticulum (rER)-like membrane structures were located in close proximity to the Cvt complex (, arrows).
Figure 3. Ultrastructure of the Atg8–PE-containing compartments induced under nitrogen starvation conditions. (A) atg1∆, (B and C) atg2∆, (D) atg14∆, (E) atg9∆, and (F and G) atg18∆ cells were grown in YPD to mid-log phase and shifted to SD-N medium for 3 h. (H) atg18∆ cells were grown in YPD. The white arrow (A) marks the Cvt complex. Black and white arrow (B and F) marks the protrusion from the nuclear membrane. Arrowheads (A, C, D and H) point to Ty1 VLPs, and arrows (C and F) mark ribosome-attached, rER-like membrane. Scale bars: 100 nm. N, nucleus; V, vacuole.
Next, we examined whether these spherical membrane structures were induced under nitrogen-starvation conditions. We examined 50 Cvt complexes in cells grown in nutrient-rich conditions (YPD). However, we could not detect these spherical structures attached to the core of the Cvt complex, or the protrusion of the nuclear membrane ()). Ty1 VLPs were still observed around the core region of the Cvt complex (), white arrowheads).
These results suggest that we discovered a novel membrane-bound structure, which is enriched with Atg8–PE, in the 4 atg mutants that we examined, exclusive of atg1∆ cells. In addition, the Atg8–PE-positive membrane structure preferentially attaches to the core region of the Cvt complex, and was induced under nitrogen-deficient conditions. It is important to note that we are monitoring the Cvt complex as a marker of selective autophagy, but not as a specific marker of the Cvt pathway, which occurs under growing conditions. We provisionally named the novel membrane structure an ‘alphasome,’ because the feature is roughly spherical similar to the Greek character alpha, and in recognition of the mammalian structure that has been termed an omegasome [Citation32].
Atg9 is not required for the formation of the alphasome
Atg9 is a conserved integral membrane protein that is essential for autophagosome formation [Citation20]. In wild-type cells, Atg9 resides at numerous puncta in the cytoplasm [Citation22], and is proposed to supply, or direct the delivery of, membrane to nascent autophagosomes [Citation21]. In agreement with this hypothesis, Atg9-containing vesicles are incorporated into the phagophore at an early step of autophagosome formation [Citation22]. We observed, however, that Atg9 was not involved in alphasome formation, because the Atg8–PE-labeled alphasome was observed in atg9∆ cells (). However, Atg9-containing vesicles are generated normally in the other atg mutants we used to observe the alphasome, namely atg2∆, atg14∆, and atg18∆ cells. To exclude the possibility of a requirement for Atg9 for alphasome formation, we tested atg double-knockout mutants (atg2∆ atg9∆, atg14∆ atg9∆, and atg18∆ atg9∆). As shown in Figure S2, the alphasome was observed in these atg double-knockout mutants in a similar manner as in the single mutants; the alphasome was in direct contact with the core of the Cvt complex (Figure S2A, arrowhead), and protrusion of the nuclear membrane was also detected (Figure S2B, arrowhead). In addition, the core of the Cvt complex attached directly to the nuclear membrane, which may be the source membrane of the alphasome (Figure S2C). The rER-like membrane structure was also observed next to the core of the Cvt complex in the double-knockout mutants (Figure S2A, arrow), similar to the images obtained in single-knockout mutants.
From these observations, we concluded that Atg9 is dispensable for the formation of the alphasome. Because the Atg9 protein and Atg9-containing vesicles are thought to function as a supplier of membrane lipids that are important for the formation of the autophagosome [Citation21,Citation22], our results suggest that the alphasome is a membrane structure that forms without an Atg9-dependent membrane source at the early stage of autophagosome formation for the sequestration of selective cargo.
Atg8 signals are localized not only at the periphery of the vacuole, but also next to the nucleus in the atg mutants
To further search for the Atg8 signals observed in atg mutants, we performed a live-cell imaging analysis using fluorescence microscopy. We used 3 strains, wild-type (WT), atg9∆, and atg14∆ cells, and visualized Atg8 signals and the nuclear membrane by expressing GFP-Atg8 and nuclear pore targeted mCherry (Nup49-mCherry), respectively. The vacuole was stained with CMAC. Cells were grown in YPD medium to mid-log phase, and then shifted to SD-N medium for 3 h. In all strains, we detected the puncta of GFP-Atg8 near both the nucleus and the vacuoles. Typical images of GFP-Atg8 in the 3 strains are shown in . In this image, the localization pattern of GFP-Atg8 matched with that of the IEM observations in . To examine the distribution of Atg8 signals in the cells, we divided the localization of GFP-Atg8 into 3 categories as follows: 1) near the nucleus (), NN); 2) near both the nucleus and the vacuole (namely, the puncta that could not be differentiated as to whether it was near the nucleus or near the vacuole; ), I); and 3) near the vacuole (), PV). We counted the number of puncta in each category; percentages of GFP-Atg8 puncta were calculated from more than 200 cells in all the strains we used ()). In WT cells, nearly 60% of the puncta were localized near the vacuole, and far fewer puncta were found near the nucleus. In addition, the intensity of Atg8 signals was rather low. Conversely, a significant fraction (40%) of the puncta were localized near the nucleus, most of which were also adjacent to the vacuole. In the 2 mutants (atg9∆ and atg14∆), the localization of GFP-Atg8 showed a similar result ()). Although 40% of GFP-Atg8 puncta were localized near the vacuole, approximately 20% were localized near the nucleus of the cells. Furthermore, 40% of the puncta were detected next to both the nucleus and vacuole. In these signals, puncta of Atg8 corresponding to the Atg8 signals in the IEM images of may be included, indicating the existence of the signals in contact with the nuclear membrane.
Figure 4. Live-cell imaging of GFP-Atg8 in WT, atg14∆, and atg9∆ cells. (A) Typical localization images of GFP-Atg8 in cells divided into 3 catogories. (B) Percentages are shown as the mean ± SD of 3 independent experiments. For NN, P < 0.005 (WT vs atg9∆); P < 0.05 (WT vs atg14∆). Cells were grown in YPD medium to mid-log phase and then shifted to SD-N medium for 3 h. NN; next to the nuclear membrane. I; intermediate area between nucleus and vacuole. PV; proximity to the vacuolar membrane. Scale bars: 500 nm.
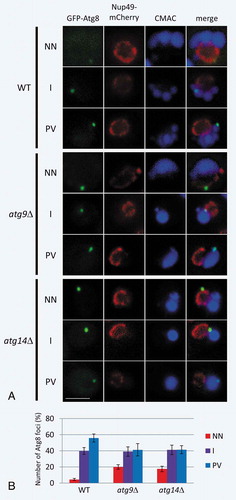
These results show that GFP-Atg8 signals are localized not only in the periphery of the vacuole, but also next to the nucleus at a significant frequency. Together with the fact that Atg8 is present on the alphasome, GFP-Atg8 signals may correspond to the alphasome.
The alphasome sequesters the core region of the Cvt complex
To extend our analysis of live-cell imaging, we examined the localization pattern of the Cvt complex in ultrathin sections of atg mutants. A core region of the Cvt complex attached preferentially to the Atg8-positive alphasome ( and ). The Cvt complex is a selective cargo sequestered to the vacuole and was observed primarily near the nucleus in wild-type cells [Citation27]. However, in the atg mutants, the Cvt complex was observed next to both the nucleus and the vacuole (). The number of Cvt complexes used for the examination was 73 in atg2∆ cells, 60 in atg9∆ cells, 96 in atg14∆ cells, 77 in 18∆ cells, and 62 in atg1∆ cells. Although 30% of the Cvt complexes were localized near the nucleus, approximately 60% were localized next to the vacuole in atg2∆, atg9∆,atg14∆, and atg18∆ cells (Figure S3). The rest (10%) were localized to the intermediate area between the nucleus and the vacuole, or were apart from the vacuole or nucleus (Figure S3). The majority of Cvt complexes (85%) were observed to be adjacent to the vacuolar membrane in atg1∆ cells that lacked an alphasome (Figure S3). The observation frequency of Cvt complexes associated with the alphasome or membrane structure ranged from 85% to 90% in the ultrathin sections of 4 atg mutants.
These results show that the Cvt complex localized near the nucleus at a significant frequency; however, the most common location of the Cvt complex was at the periphery of the vacuole in these 4 mutants. In combination with the results shown in , the core of the Cvt complex was tightly attached to the alphasome in various locations, indicating that ultimately the alphasome moved from near the nuclear membrane to the periphery of the vacuole. This fact supported the hypothesis that the alphasome is the membrane structure for the sequestration of the core region of the Cvt complex.
Three-dimensional analysis confirms that the alphasome originates from the nuclear membrane
Based on the images that show a protruding part of the outer nuclear membrane () and S2B), we suggest that the alphasome originates from the nuclear membrane. To further explore these observations, we performed a 3D tomographic analysis by generating 25 tomograms and examining them. Statistical texture analysis [Citation33], described in the Materials and Methods section, was used to extract specific structures such as the lumen and membrane, and to segment the 3D tomographic data without manual operation for the construction of 3D models. The texture feature image represents the differences in local image patterns formed from the size, gray-level, and spatial distribution of fine-staining granules, and is obtained by statistical calculations.
The architecture of the membrane area including the Cvt complex in atg14∆ and atg9∆ cells was analyzed by making 150-nm serial sections, or an ~400-nm semi-thick section, respectively. The 3D reconstructions of atg14∆ cells showed that a part of the outer nuclear membrane protruded with a hemispherical budding profile (), large arrowheads). These tomograms revealed that the core of the Cvt complex was already in contact with this hemispherical protrusion (, large white arrow). The image of the alphasome showed ribosome-free profiles in the tomogram (). The lumens of the nuclear membrane and alphasome were apparently shared (, white arrowheads). This was supported with the texture feature image of the tomographic image presented in ) (), white arrowhead). Furthermore, we examined the 3D morphology of the alphasome by using volume-rendering models ()). The continuous area of lumen from the nuclear membrane was colored with pink for visibility (), white arrowheads). The shape of the alphasome was observed clearly as a protrusion of the nuclear membrane, shaped like a hemisphere (), white arrow). This membrane structure presumably corresponds to the early stage of alphasome formation.
Figure 5. 3D reconstruction analysis of an alphasome and the Cvt complex in atg14∆ (A to G) and atg9∆ (H to K) cells. (A to D) Cross-section images of a 3D reconstruction derived from a 150-nm serial section. (E) Texture map corresponding to (D). (F) Volume rendering model corresponding to (E). Pink shows all membrane structures around the Cvt complex. (G) 3D model derived from tomogram and texture map. The color shows rER-like and tubular membrane structure (pink), the nuclear membrane (green; the small rounded structures on this membrane represent ribosomes), the hemispherical structure (the alphasome, yellow) on the nuclear membrane, the core of the Cvt complex (red) and Ty1 VLPs (purple). (H to J) Cross-section images in a 3D reconstruction from a 400-nm section. (K) 3D model derived from tomography. Cells were grown in YPD to mid-log phase and shifted to SD-N medium for 3 h. Large white arrow (A) marks the Cvt complex. Large arrowheads and white arrow (A and B) mark an alphasome and Ty1 VLPs, respectively. The white arrowheads (C to F) point to the apparent continuity between the alphasome and nuclear membrane lumen. rER-like structure (C and D) marked by black arrows. The white double arrow (D, E, and G) notes the continuity between the alphasome and rER-like structure. The white arrow (F) points to the hemisphere-shaped alphasome. The arrow (H) notes an rER-like structure originated from the nuclear membrane. The arrowhead in (I) points to the continuity between the alphasome and nuclear membrane lumen. The arrowhead (J and K) notes the continuity between the alphasome and rER-like structure. The white arrows (G and K) mark ribosomes. Scale bars: 100 nm. N, nucleus; NM, nuclear membrane; rER, rough endoplasmic reticulum; V, vacuole.
In the previous observations of ultrathin section images, sometimes the rER-like membrane structure elongated into the cytoplasm was attached, or located in close proximity, to the Cvt complex ( and S2A, arrows). Several papers have presented the importance of the rER membrane in autophagosome formation [Citation34,Citation35]. The 3D tomogram depicted the rER-like membrane structure adjacent to the core of the Cvt complex (, large arrows). We noticed that the lumen of the alphasome on the nuclear membrane connected significantly with that of the rER-like membrane structure (), white double arrows). Finally, we obtained a complete image of the relationship among the alphasome, the rER-like membrane structure, and the Cvt complex in a 3D model (), Movie 1). The connection site between the alphasome and rER-like membrane structure was indicated by white double arrows ()). The small rounded structures represent ribosomes attached to the membrane (), white arrows). Although each structure was classified with a different color for identification, the lumen of the alphasome, the nuclear membrane, and rER-like membrane structure was continuous.
In the tomogram of atg9∆ cells, similar results were obtained (); however, the alphasome was approximately spherical in shape. Furthermore, the tomographic images showed the direct continuity between the alphasome and the nuclear membrane (), arrowhead). The Cvt complex also attached to the spherical alphasome on the nuclear membrane (). We visualized the 3D relationship between the alphasome and the nuclear membrane in a 3D model; the connection site is indicated by a large arrow () and Movie 2). The lumen of the spherical alphasome also connected with that of the rER-like membrane structure (, arrowheads).
Taken together, these data demonstrated that a specific domain of the outer nuclear envelope lacking ribosomes protrudes, and this small site may be formed into a spherical structure, the alphasome, during nutrient deprivation. 3D tomographic analysis revealed that the core of the Cvt complex tightly associated with the early stage of alphasome formation as a hemispherical structure protruding from the nuclear membrane. This indicates that the membrane may capture the core in the early stage of phagophore formation. Although from this observation the alphasome on the nuclear membrane and the rER-like membrane structure showed a significant connection, the role of the rER-like membrane structure and the precise nature of membrane flow is still an open question in these mutants.
The alphasome releases from the generation site on the nuclear membrane
In the above examination ( and ), the alphasome was sometimes observed near the vacuole. The frequency of this localization was approximately 40% in a live-cell image analysis ()). One question is whether the alphasome is released from the nuclear membrane. Therefore, we further analyzed the spatial relationship between the alphasome and the nucleus or vacuole using stereo TEM pairs with 200-nm semi-thick sections (Figure S4). This analysis allows for the quick acquisition of 3D information and we examined 30 Cvt complexes. Although the alphasome was released from the nuclear membrane, we noticed images where the alphasome appeared to be connected to a short membrane structure that resembles rER, with ribosomes lining this short membrane structure (Figure S4A to C, arrows). These images provided information that the alphasome may connect to the nuclear membrane through the rER-like membrane structure. To examine more precisely the connection and correlation between the Cvt complex and the peripheral membrane structures, we further performed a 3D tomographic analysis. A TEM image of an ~400-nm semi-thick section in atg9∆ cells showed that alphasomes surrounded the core of the Cvt complex adjacent to the vacuole (), red arrowheads).
Figure 6. 3D analysis of an alphasome and the peripheral membrane structure in atg9∆ cells. (A) TEM image of a 400-nm thick section. (B to E) Cross-section (X-Y plane) images of 3D reconstruction and corresponding texture map (F to I). (J to M) 3D models. Cells were grown in YPD to mid-log phase and shifted to SD-N medium for 3 h. The colors show an alphasome and rER-like structure (yellow), nuclear membrane (green), prApe1 presumably bound to Atg19 (Cvt complex; red) and Ty1 VLPs (purple). Red arrowheads (A) indicate the membrane structure area around the core of the Cvt complex. Red plus (B and C) mark alphasomes. Blue arrowheads mark the tubular membrane structure (B, D, F, H, J, L and M). The yellow arrows (A, D and E) point to the connection between the nuclear membrane and rER-like membrane. The green arrowheads (C to I) note the continuity of the lumens, and purple arrowheads mark Ty1 VLPs (B to E, J and M). The white arrow (C, J, K and M) points to ribosomes attached to the membrane. The white double arrows (M) show a tubular membrane structure decorated with ribosomes. Scale bars: 100 nm. L, lipid droplet; N, nucleus; NM, nuclear membrane; V, vacuole.
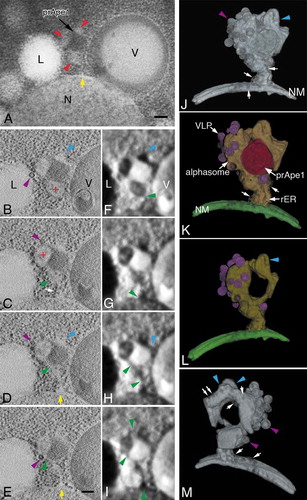
In the 3D tomographic images, the core of the Cvt complex was in tight contact with 2 alphasomes (, red plus), and the tubular but slightly bulging membrane structure (, blue arrowheads). The lumen of the 2 alphasomes was continuous (, green arrowheads), and it reached that of the nuclear membrane (, yellow arrows). The texture analysis supported this continuity (), green arrowheads). The texture feature value was calculated to be in the same range from the lumen of the nuclear membrane to the alphasome. From these results, it is shown that the alphasome did not connect directly to the nuclear membrane; rather, it connected to this membrane through a short membrane structure attached with ribosomes, as observed in the semi-thick sections (), white arrow). The result of the 3D tomogram was visualized in the 3D models (), Movie 3). Small rounded structures in the 3D models indicate ribosomes attached to the membrane structure (,K,M), white arrows). Finally, 3D analysis revealed that many ribosomes were attached on the surface of the membrane structure between the alphasome and the nuclear membrane, so this appeared to be the rER-like membrane structure (), white arrows).
The tomographic images of atg9∆ cells revealed that the tubular but bulging membrane structure (, blue arrowheads) was connected to the alphasome associated with many Ty1 VLPs (, purple arrowheads). This membrane structure was further elongated along the core of the Cvt complex in the tomographic images () and the texture feature image (), blue arrowheads). The structural position relationship was presented by the 3D models for these membranes and the core of the Cvt complex (), Movie 3, blue arrowheads). The 3D model indicated that all membrane structures around the core of the Cvt complex were connected. In addition to this image, ribosomes appeared to attach side by side on this part of the tubular membrane (), white arrows). Furthermore, the tubular membrane structure elongating from the alphasome was definitely detected in the stereo TEM pairs with 200-nm semi-thick sections (Figure S5) and also in the IEM images (, arrowheads).
From these observations, the alphasome appeared to have already been released from the nuclear membrane, but is still docked to the nuclear membrane through the rER-like membrane structure with ribosomes. However, it is still unknown whether the alphasome existed at the periphery of the vacuole connected mostly with the rER-like membrane structure. The connection of the lumen of all membrane structures around the core of the Cvt complex suggested the possibility that membrane flow may occur through the rER-like membrane structure between the alphasome and the nuclear membrane. The role of a tubular membrane structure will be unveiled in a near-future analysis.
The alphasome was identified in the atg9ts mutant
Next, to examine whether the alphasome is a correct intermediate in the knockout of ATG genes, rather than an aberrant structure, a temperature-sensitive mutant of Atg9 (atg9ts) was used. atg9∆ pep4∆ cells expressing Atg9ts (formerly Cvt7ts) were grown in SD selective medium to mid-log phase at the permissive temperature (24°C), and then shifted to 37°C in SD-N medium for 4 h. We detected a single membrane structure resembling an alphasome, near the nucleus or vacuole (, arrows). The size of this structure was approximately 120 nm to 150 nm, and its shape was roughly spherical. The Cvt complex was also attached to this membrane structure. From these results, we concluded that this structure corresponded to an alphasome. Upon shifting the cells back to the permissive temperature for 5 min in the SD-N medium, we obtained a rather elongated membrane sac surrounding a part of the Cvt complex (, arrowheads). In ), the membrane around the Cvt complex seemed to be originating from the nuclear membrane. Furthermore, we observed autophagosomes tightly adhered to the concave membrane of the nucleus (). In some cases, the lumen of the autophagosomes was expanded and seemed to connect to the elongated membrane around the Cvt complex (), arrow), or membranous sac (), arrows), indicating that the autophagosomes were not complete. The Cvt complex was included in the autophagosomes attached to the nuclear membrane (–H)). In addition, an autophagic body including the Cvt complex was observed ()).
Figure 7. The detection of the alphasome and autophagosome in atg9∆ pep4∆ cells expressing Atg9ts. (A to C) Cells were grown in SD selective media to mid-log phase at permissive temperature (24°C), and then shifted to SD-N medium at 37°C for 4 h. (D to I). After the shift up to 37°C in SD-N medium for 4 h, the cells were shifted down to 24°C in SD-N medium for 5 min. The arrows (A to C) point to alphasomes. The arrowheads (D and E) show the elongated membrane sac. The arrows (F and G) point to the lumen of an autophagosome. Scale bars: 200 nm. N, nucleus; V, vacuole.
Taken together, these results clarified that the alphasome was probably not an aberrant structure induced by the knockout of the ATG genes. In addition, the Cvt complex might be sequestered by or attached to the alphasome membrane in the early step of phagophore formation.
Discussion
One of the major interests in the field of autophagy is the mechanism through which cargos are sequestered by the phagophore [Citation26]. Although tremendous insight has been gained through molecular genetic studies [Citation1,Citation3], morphological analyses will play a critical role in understanding the complex aspects of dynamic membrane rearrangements that are involved in this process [Citation2]. In this report, we present the first observations of a novel Atg8–PE-containing membrane structure – the alphasome – and show that it was generated from a part of the outer nuclear envelope in the atg2∆, atg9∆, atg14∆, and atg18∆ mutants, which are defective at the stage of autophagosome membrane formation [Citation4]. The continuous connection of the lumen between the alphasome and the nuclear membrane was demonstrated using 3D electron tomography, and by texture analysis of image processing using a technique developed in our laboratory [Citation33,Citation36,Citation37]. Finally, the data suggest the possibility that the alphasome releases from the nuclear membrane via the elongation of an rER-like membrane structure (Figure S6). The alphasome is a spherical single-membrane structure that has not elongated, and it is morphologically distinct from the phagophore, an elongated double-membrane structure [Citation2]. In growing cells, we could not detect the spherical single-membrane structure in contact with the core of the Cvt complex. Rather, our data indicated that the alphasome may be induced under nitrogen-starvation conditions.
The identification of the alphasome in the atg9ts conditional mutant suggested that the alphasome maybe not a dead-end structure induced by a defect of Atg proteins. Upon shifting cells back to the permissive temperature for 5 min, there was a significant morphological change of the alphasome around the Cvt complex. However, the autophagosome or immature autophagosome was already observed. Therefore, the early process of phagophore formation is likely very rapid. In WT cells, the precursor form of the phagophore (i.e., the PAS) has still not been detected morphologically. It therefore remains an open question whether the membrane in the form of an alphasome appears during the formation process of the phagophore in WT cells. The analysis of this process will still require some ingenuity.
We found that Atg8 proteins were localized only on the surface of alphasomes, indicating that Atg8 conjugation to PE occurred during the protrusion of the alphasome from its source membrane. Therefore, we predict that the majority of the Atg proteins required for autophagosome formation had already carried out at least part of their function at the alphasome-generating site; however, the specific location on the nuclear membrane where the alphasome originates is still an open question at this moment. The alphasome associated with prApe1 in the form of the Cvt complex remained adjacent to the vacuole. Based on our EM observations we propose that this stage of the alphasome may represent a later event after movement of the partially sequestered structure from the initial emerging site on the nuclear membrane. A previous paper indicated that the PAS is always located in proximity to the vacuole and plays a fundamental role in the generation of the autophagosome in yeast [Citation38]. In this paper, the counting of puncta at the PAS was performed by fluorescence microscopy observation of tagged GFP proteins [Citation38]. However, the correlation between the localization of GFP-Atg8 and a nuclear membrane was not examined, and an EM analysis was not performed. Interestingly, our EM analysis showed that the puncta of GFP-Atg8 next to the vacuole correspond to the membrane-bound structure, the alphasome. From our observations of Atg8 signals by fluorescence microscopy and EM analysis of the alphasome, the localization of the Atg8-positive alphasome next to the nuclear membrane cannot be negligible in these 4 atg mutants. Rather, we think these data suggest that the identification of the nuclear membrane generating site is important for understanding the biogenesis of the autophagosome membrane.
The precursor form of Ape1 is synthesized in the cytosol, forms a dodecamer, and subsequently assembles into a large oligomer (the Ape1 complex) [Citation26]; this oligomer, along with the Atg19 receptor, is observed as an electron-dense core referred to as the Cvt complex [Citation26]. The selectivity for the engulfment of the Cvt complex during either the Cvt pathway or autophagy is retained because of the function of Atg19 [Citation28] and a scaffold protein, Atg11 [Citation39], resulting in the attachment of Atg8–PE-containing membrane to the core of the Cvt complex; this process does not depend on other Atg proteins and therefore proceeded normally in the atg mutants examined in this study. Our observation of the association between the core of the Cvt complex and the early stage of the alphasome protruded from the nuclear membrane strongly supported the hypothesis that selective cytoplasmic cargo is recognized at an early step during the formation of the autophagosome. The examination of the localization of the Cvt complex and Atg8 signals revealed that the core of the Cvt complex is attached to the membrane of the alphasome during its movement from the generating site on the nuclear membrane to the periphery of the vacuole. This indicates that the role of the alphasome might be the recognition and sequestration of the core of the Cvt complex. Therefore, the membrane formation which captures the Cvt complex may have occurred in the atg mutants we examined under nitrogen-starvation conditions. However, the timing of the recognition and binding to the alphasome is still not known. In future analyses, more precise information about the role of these membrane structures will be obtained.
Yeast cells generate numerous autophagic bodies that accumulate within the vacuole following 3 h of nutrient starvation when their degradation is blocked [Citation30]. However, normal autophagosomes and phagophores were not generated in the atg mutants examined here. Nonetheless, normal membrane lipid suppliers may work in these cells, as indicated by the continuous induction of autophagy. The appearance of the rER-like membrane structure and the generation of the tubular membrane enclosing the core of the Cvt complex occur. These findings suggested that the rER-like membrane structure may play a critical role in the step of phagophore formation. Many reports have implicated a specific domain of the rER as one of the sources of the autophagosome membrane [Citation11,Citation34,Citation35]. Genetic studies in yeast indicate that genes necessary for membrane trafficking from the rER are required for autophagosome formation [Citation6]. In mammalian cells, 2 groups demonstrated a physical connection between a subdomain of the rER and the phagophore by electron tomography [Citation40,Citation41]. Furthermore, in mammalian cells, the ZFYVE1/DFCP1 protein, which binds to PtdIns3P, is localized to the omegasome [Citation32]. Omegasomes are a subcompartment of the endoplasmic reticulum, and phagophores seem to emerge inside or next to omegasomes [Citation32,Citation42]. The alphasome originated from a protrusion of the outer nuclear membrane; this membrane connects to the perinuclear ER as shown in the 3D tomographic analysis and stereo pair observations. Although yeast has no ZFYVE1 ortholog, a similar mechanism of membrane flow may be required in phagophore formation. In fact, when the atg9ts cells were returned to the permissive temperature for 5 min, we detected immature autophagosomes, which were in close contact with the concave nuclear membrane, suggesting that the membrane flow through the perinuclear ER originating from the nuclear membrane may have occurred to result in the formation of the autophagosome.
Clearly, many additional studies will be needed to elucidate the process of phagophore formation in autophagosome biogenesis. The present study nonetheless provides a useful foundation for continued work in this direction. Thus, our results provide further insight into the question of how the alphasome membranes and the rER-like structure are associated during autophagy.
Materials and methods
Yeast strains and media
The yeast strains used in this study are listed in Table S1. The construction of double-knockout mutants was done as previously reported [Citation43]. A Nup49-mCherry strain was generated using homologous recombination with a PCR fragment derived from genomic DNA of a strain previously described [Citation44]. Cells were grown in YPD (1% yeast extract, 2% peptone, and 2% glucose), SD (2% glucose, and 0.67% yeast nitrogen base without amino acids, containing any required amino acids and/or nucleosides to supplement auxotrophies) and transferred to SD-N (2% glucose, 0.17% yeast nitrogen base without amino acids and ammonium sulfate), and incubated for 3 to 4 h at 30°C.
The pRS414[CVT9/Atg9ts] plasmid was a gift from Dr. Daniel J. Klionsky, University of Michigan, USA, and the pRS316[GFP-Atg8] plasmid [Citation12,Citation45] was distributed from the National BioResource Project (Yeast).
Freezing and freeze substitution
For fixation, cells were prepared as described previously [Citation46]. In brief, cells were plunged into liquid propane and subjected to freeze substitution in 2% osmium tetroxide in acetone at −85°C for 2 d, and then slowly warmed to room temperature. The specimens were infiltrated with a mixture of Quetol-812 (Nisshin EM, 340). For immunoelectron microscopy, cells were freeze substituted with 1% formaldehyde in acetone at −85°C for 2 d, and then slowly warmed to −20°C. The specimens were rinsed with acetone and substituted with ethanol at −20°C, then infiltrated with LR White resin (EMS, 14381). Polymerization was done with a UV light at −20°C.
Immunolabeling
Thin sections were collected on formvar-coated nickel grids (EMS, M150-Ni). The blocking was performed with phosphate-buffered saline (137 mM NaCl, 2.7 mM KCl, 8 mM Na2HPO4, 1.5 mM KH2PO4, pH 7.4). Thin sections were stained with anti-HA antibody (Covance, 901513), affinity purified anti-Ape1 antibody (a gift from Dr. Daniel J. Klionsky, University of Michigan, USA), and affinity purified anti-Atg8 antibody (a gift from Dr. T. Kirisako, NIBB, Japan) followed by ultra-small colloidal-gold-conjugated goat anti-rabbit IgG (Aurion, 800.022), and detected with silver enhancement (Aurion, 500.033). Thin sections were examined with an H-800 or HT7700 electron microscope (Hitachi High-Technologies, Tokyo, Japan) at 125kV or100kV, respectively.
Fluorescence microscopy
Fluorescence microscopy was performed using an inverted microscope, DeltaVision (GE Healthcare, Buckinghamshire, UK). Images were captured using softWoRx image acquisition and analysis software. For vacuolar staining, 7-amino-4-chloromethylcoumarin (CMAC; Thermo Fisher Scientific, C2110) was added to cells (final concentration, 10 µM). The cells were incubated at 30°C for 30 min, and cells resuspended in fresh SD-N were subjected to microscopy observation.
Stereo TEM image pairs
200-nm semi-thick sections were examined with the angle of ± 7° at 200 kV using an H-8100 electron microscope (Hitachi High-Technologies, Tokyo, Japan). Stereo image pairs were captured with a Gatan CCD camera (SC200, Pleasanton, CA, USA)
Electron tomography
Semi-thick sections (400–500 nm) were stained by the method described previously [Citation47]. Both surfaces of the grids were coated with carbon films. A tilt series was collected from −60° to + 60° with 3° increments at 300 kV using an H-9500SD electron microscope (Hitachi High-Technologies, Tokyo, Japan). Tilt images were serially captured with a TemCam-F224HD CCD camera (TVIPS, Gauting, Germany) using EMMENU3 software (TVIPS, Gauting, Germany). Serial sections (150 nm) were collected onto single-slot copper grids (VECO, 2571). Both sides of the grids were supported with 0.7% Formvar films (Nisshin EM, 604–1), and coated with carbon film (Vacuum device Inc, 901009J). Serial sections were examined with an HT7700 electron microscope (Hitachi High-Technologies, Tokyo, Japan) at 120 kV. For dual-axis tilting, the specimen grids were rotated over an angle of approximately 90° in the holder by hand, and the tilt series were recorded automatically with an angular range of −60° to + 60° with 2° increments with a XR-41B CCD camera (AMT, Woburn, MA, USA) using EMIP-3D software (Hitachi High-Technologies, Tokyo, Japan). For the tomographic image reconstruction, the image alignment of each tilt series was done with originally developed software without colloidal gold markers [Citation36,Citation37]. The reconstruction was done by the filtered back-projection method [Citation48]. For dual-axis tomography, 2 tomogram volumes, each of which was reconstructed from each aligned tilt series, were combined with the DAT system (Hitachi High-Technologies, Tokyo, Japan) equipped with an HT7700 electron microscope (Hitachi High-Technologies, Tokyo, Japan). For the construction of 3D models, we used the ‘slicer’ function installed in the ‘IMOD’ application software [Citation49] and the texture analysis.
Texture analysis
Texture analysis methods are commonly used in the field of image processing for classifying regions which have common properties [Citation33,Citation50–Citation52]. A texture is usually described by its visual features: granular, smooth, regular, linear, etc. For quantitative texture analysis, second-order statistics are used, namely, the interactions are measured between a pair of pixel gray values located at a certain small distance, d, from each other. To do this, specific local image statistics are calculated using a computer. This calculation is made within a local image region (called ‘window’ in this text) centered at every pixel, and the statistics are put together in the matrix. Details of this method have been described previously [Citation33]. Furthermore, to quantify various textures, the matrix is substituted to mathematical expressions called ‘descriptors.’ Various descriptors have been proposed to distinguish different object textures [Citation51,Citation53]. Each value calculated from a descriptor is used as a ‘feature value,’ and a 2D map of the feature value is called a ‘texture feature image.’ In this study, approximately 10 descriptors were examined, and the optimum descriptor, called the ‘Sum Average’, was chosen. The parameters of window size and distance d were chosen to achieve the most effective segmentation and the extraction of specific structures, namely around 3 to 6 pixels.
Segmentation
Segmentation was performed with an improved watershed-based method [Citation54], adapted to the texture feature image, which was uniquely modified in our lab. A brief summary of the method is as follows: In the texture feature image, the distribution may be considered a topographic relief in which the feature value of a pixel is interpreted as its altitude. A drop of water falling on a topographic relief flows along a path to ultimately reach a local minimum. Intuitively, a watershed of the relief corresponds to the limits of the adjacent catchment basins for the drops of water. This principle was used for the segmentation. We modified the method so that the watershed lines adequately drew the domains to be segmented without being affected by locally obscured domain edges. This segmentation method is generally adaptable to relatively rough segmentation.
For fine segmentation, another method was employed in which a boundary line such as a membrane was traced. In this work, the tomographic cross-section planes were tilted in various 3D directions to determine membranes or equivalent boundary lines to segment the domains as clearly as possible, with the ‘slicer’ function installed in the ‘IMOD’ application software [Citation49].
Statistical analyses
Statistical evaluations were carried out using the Welch t test.
Supplemental Material
Download Zip (19.8 MB)Acknowledgments
The authors thank Dr. T. Kirisako, Dr. Daniel J. Klionsky, and the National BioResource Project (NBRP) Yeast for yeast strains and plasmids. The authors also thank Dr. K.S. Noda, Dr. T. Noda, and Dr. T. Yoko-o for help with the genetic work. A part of this work was supported by the “Nanotechnology Network Project” of the Ministry of Education, Culture, Sports, Science and Technology (NEXT), Japan at the Research Center for Ultrahigh Voltage Electron microscopy, Osaka University. This work was supported by Grants-in-Aid for Scientific Research to M.B. (21570069 and 24570076), and Grands-in-Aid for Scientific Research to N.B. (21310075 and 24510156) from the Ministry of Education, Culture, Sports, Science and Technology of Japan.
Disclosure statement
No potential conflict of interest was reported by the authors.
Supplementary material
Supplemental data for this article can be accessed here
Additional information
Funding
Related Research Data
References
- Yang Z, Klionsky DJ. An overview of the molecular mechanism of autophagy. Curr Top Microbiol Immunol. 2009;335: 1–32. PMID: 19802558.
- Eskelinen E-L., Reggiori F, Baba M, Kovács AL, Seglen PO. Seeing is believing: the impact of electron microscopy on autophagy research. Autophagy. 2011;7: 935–956. PMID: 21566462.
- Reggiori F, Komatsu M, Finley K, Simonsen A. Autophagy: more than a nonselective pathway. Int J Cell Biol. 2012;2012: 1–18. PMID: 22666256.
- Reggiori F, Klionsky DJ. Autophagic processes in yeast: mechanism, machinery and regulation. Genetics. 2013;194: 341–361. PMID: 23733851.
- Baba M, Takeshige K, Baba N, Ohsumi Y. Ultrastructural analysis of the autophagic process in yeast: detection of autophagosomes and their characterization. J Cell Biol. 1994;124: 903–913. PMID: 8132712.
- Reggiori F, Wang C-W, Nair U, Shintani T, Abeliovich H, Klionsky DJ. Early stages of the secretory pathway, but not endosomes, are required for Cvt vesicle and autophagosome assembly in Saccharomyces cerevisiae. Mol Biol Cell. 2004;15: 2189–2204. PMID: 15004240.
- Hamasaki M, Noda T, Baba M, Ohsumi Y. Starvation triggers the delivery of the endoplasmic reticulum to the vacuole via autophagy in yeast. Traffic. 2005;6: 56–65. PMID: 15569245.
- Yen W-L, Shintani T, Nair U, Cao Y, Richardson BC, Li Z, Hughson FM, Baba M, Klionsky DJ. The conserved oligomeric Golgi complex is involved in double-membrane vesicle formation during autophagy. J Cell Biol. 2010;188:101–114. Published January 11, 2010 PMID: 20065092
- Hailey DW, Rambold AS, Satpute-Krishnan P, Mitra K, Sougrat R, Kim PK, Lippincott-Schwartz J. Mitochondria supply membranes for autophagosome biogenesis during starvation. Cell. 2010;141: 656–667. PMID: 20478256.
- Longatti A, Tooze SA. Recycling endosomes contribute to autophagosome formation. Autophagy. 2012;8: 1682–1683. PMID: 22874560.
- Hamasaki M, Furuta N, Matsuda A, Nezu A, Yamamoto A, Fujita N, Oomori H, Noda T, Haraguchi T, Hiraoka Y, Amano A, Yoshimori T. Autophagosomes form at ER–mitochondria contact sites. Nature. 2013;495: 389–393. PMID: 23455425.
- Suzuki K, Kirisako T, Kamada Y, Mizushima N, Noda T, Ohsumi Y. The pre-autophagosomal structure organized by concerted functions of APG genes is essential for autophagosome formation. EMBO J. 2001;20: 5971–5981. PMID:11689437.
- Ichimura Y, Kirisako T, Takao T, Satomi Y, Shimonishi Y, Ishihara N, Mizushima N, Tanida I, Kominami E, Ohsumi M, Noda T, Ohsumi Y. A ubiquitin-like system mediates protein lipidation. Nature. 2000;408: 488–492. PMID:11100732.
- Kirisako T, Baba M, Ishihara N, Miyazawa K, Ohsumi M, Yoshimori T, Noda T, Ohsumi Y. Formation process of autophagosome is traced with Apg8/Aut7p in yeast. J Cell Biol. 1999;147: 435–446. PMID:10525546.
- Ichimura Y, Imamura Y, Emoto K, Umeda M, Noda T, Ohsumi Y. In Vivo and In Vitro reconstitution of Atg8 conjugation essential for autophagy. J Biol Chem. 2004;279: 40584–40592. PMID: 15277523.
- Geng J, Baba M, Nair U, Klionsky DJ. Quantitative analysis of autophagy-related protein stoichiometry by fluorescence microscopy. J Cell Biol. 2008;182: 129–140. PMID: 18625846.
- Nair U, Cao Y, Xie Z, Klionsky DJ. Roles of the lipid-binding motifs of Atg18 and Atg21 in the cytoplasm to vacuole targeting pathway and autophagy. J Biol Chem. 2010;285: 11476–11488. PMID: 20154084.
- Rieter E, Vinke F, Bakula D, Cebollero E, Ungermann C, Proikas-Cezanne T, Reggiori F. Atg18 function in autophagy is regulated by specific sites within its β-propeller. J Cell Sci. 2013;126: 593–604. PMID: 23230146.
- Kabeya Y, Kamada Y, Baba M, Takikawa H, Sasaki M, Ohsumi Y. Atg17 functions in cooperation with Atg1 and Atg13 in yeast autophagy. Mol Biol Cell. 2005;16: 2544–2553. PMID: 15743910.
- Noda T, Kim J, Huang WP, Baba M, Tokunaga C, Ohsumi Y, Klionsky DJ. Apg9p/Cvt7p is an integral membrane protein required for transport vesicle formation in the Cvt and autophagy pathways. J Cell Biol. 2000;148: 465–480. PMID: 10662773.
- Mari M, Griffith J, Rieter E, Krishnappa L, Klionsky DJ, Reggiori F. An Atg9-containing compartment that functions in the early steps of autophagosome biogenesis. J Cell Biol. 2010;190: 1005–1022. PMID: 20855505.
- Yamamoto H, Kakuta S, Watanabe TM, Kitamura A, Sekito T, Kondo-Kakuta C, Ichikawa R, Kinjo M, Ohsumi Y. Atg9 vesicles are an important membrane source during early steps of autophagosome formation. J Cell Biol. 2012;198: 219–233. PMID: 22826123.
- Shirahama-Noda K, Kira S, Yoshimori T, Noda T. TRAPPIII is responsible for vesicular transport from early endosomes to Golgi, facilitating Atg9 cycling in autophagy. J Cell Sci. 2013;126: 4963–4973. PMID: 23986483.
- Reggiori F, Tucker KA, Stromhaug PE, Klionsky DJ. The Atg1-Atg13 complex regulates Atg9 and Atg23 retrieval transport from the pre-autophagosomal structure. Dev Cell. 2004;6: 79–90. PMID: 14723849.
- Watanabe Y, Kobayashi T, Yamamoto H, Hoshida H, Akada R, Inagaki F, Ohsumi Y, Noda NN. Structure-based analyses reveal distinct binding sites for Atg2 and phosphoinositides in Atg18. J Biol Chem. 2012;287: 31681–31690. PMID: 22851171.
- Lynch-Day MA, Klionsky DJ. The Cvt pathway as a model for selective autophagy. FEBS Lett. 2010;584: 1359–1366. PMID:20146925.
- Baba M, Osumi M, Scott, SV, Klionsky DJ, Ohsumi Y. Two distinct pathways for targeting proteins from the cytoplasm to the vacuole/lysosome. J Cell Biol. 1997;139: 1687–1695. PMID:9412464.
- Sawa-Makarska J, Abert C, Romanov J, Zens B, Ibiricu I, Martens S. Cargo binding to Atg19 unmasks additional Atg8 binding sites to mediate membrane-cargo apposition during selective autophagy. Nat Cell Biol. 2014;16: 425–433. Epub 2014 Apr 6. PMID: 24705553.
- Kirisako T, Ichimura Y, Okada H, Kabeya Y, Mizushima N, Yoshimori T, Ohsumi M, Takao T, Noda T, Ohsumi Y. The reversible modification regulates the membrane-binding state of Apg8/Aut7 essential for autophagy and the cytoplasm to vacuole targeting pathway. J Cell Biol. 2000;151: 263–276. PMID: 11038174.
- Takeshige K. Autophagy in yeast demonstrated with proteinase-deficient mutants and conditions for its induction. J Cell Boil. 1992;119: 301–311. PMID: 1400575.
- Suzuki K, Morimoto M, Kondo C, Ohsumi Y. Selective autophagy regulates insertional mutagenesis by the Ty1 retrotransposon in Saccharomyces cerevisiae. Dev Cell. 2011;21: 358–365. PMID: 21839922.
- Axe EL, Walker SA, Manifava M, Chandra P, Roderick HL, Habermann A, Griffiths G, Ktistakis NT. Autophagosome formation from membrane compartments enriched in phosphatidylinositol 3-phosphate and dynamically connected to the endoplasmic reticulum. J Cell Biol. 2008;182: 685–701. PMID: 18725538.
- Baba N, Ichise N, Tanaka T. Image area extraction of biological objects from a thin section image by statistical texture analysis. J Electron Microsc. 1996;45: 298–306. PMID:8888585.
- Graef M, Friedman JR, Graham C, Babu M and Nunnari J. ER exit sites are physical and functional core autophagosome biogenesis components. Mol Biol Cell. 2013;24: 2918–2931. PMID:23904270.
- Suzuki K, Akioka M, CKondo-Kakuta C, Yamamoto H, Ohsumi Y. Fine mapping of autophagy-related proteins during autophagosome formation in Saccharomyces cerevisiae. J Cell Sci. 2013;126: 2534–2544. PMID: 23549786.
- Tomonaga S, Baba M, Baba N. Alternative automatic alignment method for specimen tilt-series images based on back-projected volume data cross-correlations. Microscopy. 2014;63: 279–294. PMID: 24815505.
- Tomonaga S, Baba M, Yamazaki S, Baba N. A newfield-of-viewautotracking method for online tomography reconstruction based on back-projected ray image cross-correlation. Microscopy. 2014;63: 357–369. PMID: 24938231.
- Suzuki K, Kubota Y, Sekito T, Ohsumi Y. Hierarchy of Atg protein in pre-autophagosomal structure organization. Genes Cells. 2007;12: 209–218. PMID:17295840.
- Shintani T, Huang WP, Stromhaug PE, Klionsky DJ. Mechanism of cargo selection in the cytoplasm to vacuole targeting pathway. Dev Cell. 2002;3: 825–837. PMID: 12479808.
- Hayashi-Nishino M, Fujit N, Noda T, Yamaguchi A, Yoshimori T, Yamamoto A. A subdomain of the endoplasmic reticulum forms a cradle for autophagosome formation. Nat Cell Biol. 2009;11: 1433–1437. PMID: 19898463.
- Ylä-Anttila P, Vihinen H, Eija Jokitalo E, Eskelinen EL. 3D tomography reveals connections between the phagophore and endoplasmic reticulum. Autophagy. 2009;5: 1180–1185. PMID: 19855179.
- Uemura T, Yamamoto M, Kametaka A, Sou YS, Yabashi A, Yamada A, Annoh H, Kametaka S, Komatsu M, Waguri S. A cluster of thin tubular structures mediates transformation of the endoplasmic reticulum to autophagic isolation membrane. Mol Cell Biol. 2014;34: 1695–1706. PMID: 24591649.
- Gueldener U, Heinisch J, Koehler GJ, Voss D, Hegemann JH. A second set of loxP marker cassettes for Cre-mediated multiple gene knockouts in budding yeast. Nucleic Acids Res. 2002;30: e23. PMID:11884642.
- Kira S, Kumano Y, Ukai H, Takeda E, Matsuura A, Noda T. Dynamic relocation of the TORC1-Gtr1/2-Ego1/2/3 complex is regulated by Gtr1 and Gtr2. Mol Biol Cell. 2016;27: 382–396. PMID:26609069.
- Matsui A, Kamada Y, Matsuura A. The role of autophagy in genome stability through suppression of abnormal mitosis under starvation. PLoS Genet. 2013;9: e1003245. PMID:23382696.
- Baba M. Electron microscopy in yeast. Methods Enzymol. 2008;451: 133–149. PMID: 19185718.
- Takaoka A, Hasegawa T, Yoshida K, Mori H. Microscopic tomography with ultra-HVEM and applications. Ultramicroscopy. 2008;108: 230–238. PMID:18036740.
- Frank J. Three-dimensional electron microscopy of macromolecular assemblies. Vol. (1996). San Diego: Academic Press; 1996. p. 202–210.
- Kremer JR, Mastronarde DN, McIntosh JR. Computer visualization of three-dimensional image data using IMOD. J Struct Biol. 1996;116: 71–76. PMID: 8742726.
- Cataldo S.D, Ficarra E. Mining textural knowledge in biological images: Applications, methods and trends. Compt Struct Biotech J. 2017;15: 56–67. PMID: 27994798.
- Cendre E, Kaftandjian V, Peix G, Jourlin M, Mitton D, Babot D. An investigation of segmentation methods and texture analysis applied to tomographic images of human vertebral cancellous bone. J Microsc. 2000;197: 305–316. PMID:10692134.
- Carr JR. De Miranda FP. The semivariogram in comparison to the co-occurrence matrix for classification of image texture. Geosci Remote Sens. 1998;36:1945–1952.
- Haralick RM, Shanmugam K, Dinstein I. Textural features for image classification. IEEE Trans Syst Man Cybern. 1973;SMC-3:610–621.
- Russ JC. The image processing handbook. 6th ed. London: CRC Press; 2011. p. 443–509.