
ABSTRACT
Cadmium (Cd) is a toxic metal that is widely found in numerous environmental matrices and induces serious adverse effects in various organs and tissues. Bone tissue seems to be a crucial target of Cd contamination. Macroautophagy/autophagy has been proposed to play a pivotal role in Cd-mediated bone toxicity. However, the mechanisms that underlie Cd-induced autophagy are not yet completely understood. We demonstrated that Cd treatment increased autophagic flux and inhibition of the autophagic process using Atg7 gene silencing blocked the Cd-induced mesenchymal stem cell death. Mechanistically, Cd activated nuclear translocation of TFE3 but not that of TFEB or MITF, which contributed to the expression of autophagy-related genes and lysosomal biogenesis. Specifically, Cd decreased expression of phospho-AKT (Ser473). The reduction in AKT activity led to dephosphorylation of cytosolic TFE3 at Ser565 and promoted TFE3 nuclear translocation independently of MTORC1. Notably, Cd treatment increased the activity of PPP3/calcineurin, and pharmacological inhibition of PPP3/calcineurin with FK506 suppressed AKT dephosphorylation and TFE3 activity. These results suggest that PPP3/calcineurin negatively regulates AKT phosphorylation and is involved in Cd-induced TFE3-dependent autophagy. Modulation of the PPP3/calcineurin-AKT-TFE3 autophagic-lysosomal machinery may offer novel therapeutic approaches for the treatment of Cd-induced bone damage.
Abbreviations: ACTB: actin: beta; AKT: thymoma viral proto-oncogene; AMPK: AMP-activated protein kinase; ATG: autophagy related; Baf A1: bafilomycin A1; Cd: cadmium; FOXO3: forkhead box O3; MAP1LC3/LC3: microtubule-associated protein 1 light chain 3; MITF: melanogenesis associated transcription factor; MSC: mesenchymal stem sell; MTORC1: mechanistic target of rapamycin kinase complex 1; RPS6KB1: ribosomal protein S6 kinase: polypeptide 1; SGK1: serum/glucocorticoid regulated kinase 1; SQSTM1/p62: sequestosome 1;TFE3: transcription factor E3; TFEB: transcription factor EB; TFEC: transcription factor EC
Introduction
Cadmium (Cd) is a widespread environmental contaminant that poses a threat to human health [Citation1,Citation2]. Many people have been exposed to cadmium directly or indirectly through smoking or eating fruits, vegetables, and seafood in which the cadmium content exceeds the regulatory standards [Citation3,Citation4]. The rapid increase in Cd exposure in modern society has raised considerable concerns about its potentially hazardous effects on human health [Citation5,Citation6]. Over recent decades, epidemiological research has indicated that even low-level environmental exposure to Cd leads to reduced bone mineral density, increased risk of bone fractures and osteoporosis in humans and these findings have been confirmed in animal experiments [Citation7,Citation8]. Autophagy has been proposed to play a pivotal role in Cd-mediated bone toxicity. Our previous report demonstrated that Cd triggers AMP-activated protein kinase (AMPK)-FOXO3 (forkhead box O3) mediated autophagic cell death in mesenchymal Stem Cells (MSCs), which may contribute to osteoporosis [Citation9]. However, Foxo3 knockdown could not completely prevent Cd-induced autophagy, which suggests that some other important signaling pathways may be involved in the Cd-induced autophagy in MSCs. This possibility warrants further investigation.
TFE3 (transcription factor E3), a member of the basic helix-loop-helix leucine zipper family of transcription factors, has recently been identified as a master regulator of the expression of genes that are associated with autophagy and lysosomal biogenesis [Citation10]. Following certain autophagic stimuli, TFE3 translocates to the nucleus and activates a subset of target genes that are closely associated with lysosomal structure and function, including hydrolases, lysosomal membraved that the percne proteins, and the V-type H+-translocating ATPase (V-ATPase) complex [Citation11]. Moreover, activation of TFE3 positively promotes autophagosome-lysosome fusion, enabling a coordinated and efficient response to increased degradative needs [Citation12,Citation13]. Under certain cellular conditions, TFE3 overexpression may promote cell survival by enhancing the expression of pro-survival genes [Citation14]. However, a recent study showed that under some conditions, activation of TFE3 may increase the expression of pro-apoptotic factors, which leads to cell death [Citation15].
An opportunity for pharmacological activation of TFE3 has been demonstrated in cell-based studies, which indicate that TFE3 is negatively regulated by MTORC1 (mechanistic target of rapamycin kinase complex 1) [Citation16,Citation17]. MTORC1 phosphorylates TFE3 at several residues, but Ser321 of TFE3 is particularly relevant because phosphorylation of this residues creates a binding site for the cytosolic chaperone YWHA/14–3-3. Interaction with YWHA/14–3-3 results in sequestration of this transcription factor in the cytosol. Conversely, when nutrients are scarce, inactivation of MTORC1, and the associated dephosphorylation of Ser321 prevent the binding to 14–3-3, which results in the rapid accumulation of TFE3 in the nucleus [Citation18]. Although phosphorylation plays a role in regulating the nuclear abundance of TFE3, the cellular mechanisms that sense the lysosomal status and transduce the signals that regulate the TFE3 localization in Cd-induced bone toxicity remain unclear.
The data presented in the current report indicate that Cd induced TFE3-dependent autophagic cell death in MSCs. Moreover, we also identified AKT (thymoma viral proto-oncogene) as a pharmacologically actionable target that controls TFE3 activity independently of MTORC1. TFE3 activity is modulated by AKT phosphorylation at Ser565, and pharmacological inhibition of PPP3/calcineurin promotes AKT phosphorylation and suppresses the TFE3-dependent autophagic cell death. Therefore, the finding that PPP3/calcineurin-AKT-TFE3-mediated autophagic-lysosomal machinery opens novel perspectives for future pharmacological therapies against Cd-induced bone toxicity.
Results
Cd induces autophagic cell death in cultured mscs
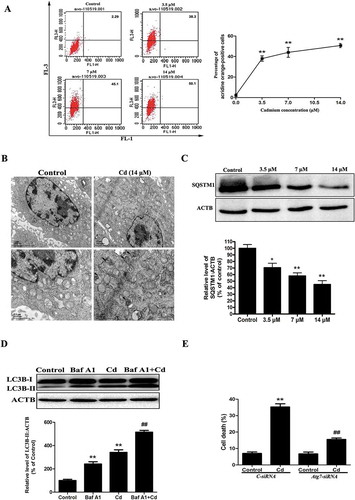
Cd-induced autophagy was examined by staining with acridine orange. As revealed in ), we observed that the percentage of acidic vesicular organelles was increased to 50.1% at a concentration of 14 μM Cd. Evidence of Cd-induced autophagy was also determined by direct observation of the formation of autophagosomes using transmission electron microscopy ()). Autophagy is a dynamic flux process. As such, increased levels of autophagosomes can signify either an increase in autophagosome formation, a block in downstream lysosomal processing of these autophagosomes, or both [Citation19]. We first examined the change of SQSTM1/p62 (sequestosome 1) protein levels. This protein is selectively incorporated into autophagosomes through direct binding to MAP1LC3/LC3 (microtubule-associated protein 1 light chain 3) and is efficiently degraded by autophagy [Citation20]. We observed an evident decrease in SQSTM1 protein levels in MSCs that were treated with Cd in a concentration-dependent manner, confirming intact autophagic flux in the Cd-treated MSCs ()). Bafilomycin A1 (Baf A1), a specific inhibitor of the V-ATPase, prevents autophagy at the latest stage by inhibiting the fusion of autophagosomes with lysosomes [Citation20]. To detect autophagic flux, we measured the level of LC3B-II in the absence or presence of Baf A1. We found that a Baf A1 challenge resulted in increased expression of LC3B-II in cells that were treated with 14 μM Cd ()). This finding demonstrated that Cd treatment induced autophagic flux in MSCs, rather than inhibiting autophagosome/lysosome fusion. To further ascertain the role of autophagy in the Cd-induced cytotoxicity, autophagosome formation was blocked using siRNA against the Atg7 gene. Atg7 siRNA efficiently protected against the Cd-induced cell death ()).
Figure 1. Cd induces autophagic cell death in cultured MSCs. (a) The cells were treated with Cd at various concentrations (0, 3.5, 7, 14 μM) for 24 h and then analyzed for autophagy using acridine orange staining assessed with flow cytometry. (b) Electron microscopy revealed an increased number of AVs, and the lower panels are magnified portions of the upper panels. (c) A representative immunoblot and quantification analysis of SQSTM1 in MSCs treated with increasing concentrations of Cd. ACTB (actin, beta) was used as a loading control. (d) The MSCs were incubated with Cd (14 μM) in the absence or presence of Baf A1 (10 nM) for 24 h. The expression of LC3B-II was quantified by normalization of its density to that of ACTB. (e) Atg7 siRNA treatment decreased cell death by inhibiting autophagy. The results are expressed as the percentage of the control, which was set to 100 %. The values are presented as the means ±SEM, *p < 0.05, **p < 0.01 versus the control group, ##p < 0.01 versus the Cd (14 μM) group. (n = 3).
Cd induces expression of autophagy-related genes and lysosomal biogenesis in cultured mscs
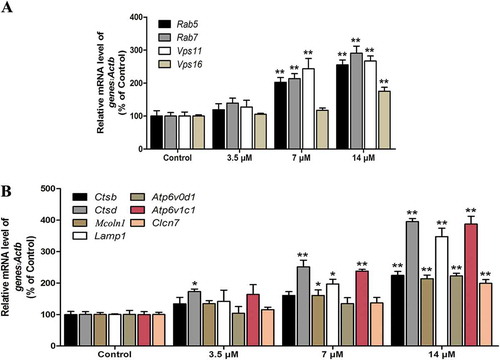
Our previous study confirmed that the mRNA levels of genes associated with the formation of autophagosomes, including Map1lc3b, Becn1(beclin 1, autophagy related), Ulk1(unc-51 like kinase 1), Atg5, and Atg12, were elevated in a dose- and time-dependent manner in Cd-treated MSCs [Citation9]. Here, as expected, Cd greatly increased the mRNA abundance of the 11 autophagy-related and lysosomal biogenesis genes that were examined, including those that encode several subunits of the V-ATPase (Atp6v0d1 and Atp6v1c1), lysosomal transmembrane proteins (Clcn7, Lamp1, and Mcoln1), lysosomal hydrolases (Ctsb and Ctsd), and proteins that play essential roles in the formation of autophagosomes (Vps11 and Vps16) as well as their degradation (Rab5a and Rab7;) (). Taken together, these results suggested that Cd increased the expression of autophagy-related genes and triggered lysosomal biogenesis in MSCs.
Figure 2. Cd induces the expression of autophagy-related genes and lysosomal biogenesis. MSCs were treated with Cd at various concentrations (0, 3.5, 7, 14 μM) for 24 h. (a) The mRNA levels of autophagy-related genes were determined using RT-PCR. (b) The mRNA levels of lysosomal biogenesis genes were determined using RT-PCR. The results are expressed as the percentage of the control, which was set at 100 %. The values are presented as the means ±SEM, *p < 0.05,**p < 0.01 versus the control group. (n = 3).
Cd induces nuclear translocation of TFE3 in cultured mscs
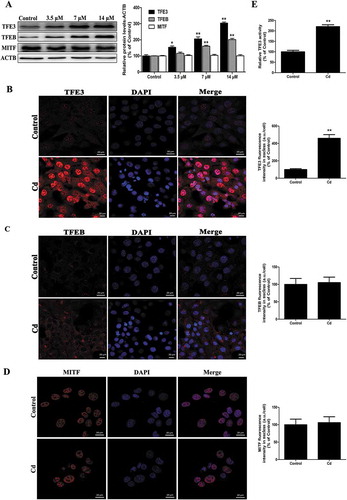
More recently, the MiT/TFE proteins – MITF (melanogenesis associated transcription factor), TFE3, and TFEB (transcription factor EB), which are major regulators of autophagy and lysosomal biogenesis, have emerged as leading factors in human disease pathology [Citation21]. Based on these results, we investigated whether the MiT/TFE family is involved in the action of Cd in MSCs. Interestingly, Cd treatment significantly increased TFEB and TFE3 expression in a concentration-dependent manner and no significant changes were detected in the levels of MITF ()). Activation of MiT/TFE proteins was based on the detection of their translocation into the cell nuclei from their initial location in the cytoplasm, in which they are present in an inactive form. Notably, only TFE3 was observed to translocate into the nucleus following Cd exposure as indicated by immunofluorescence staining (. Similar results were also shown in western blotting of MiT/TFE proteins in the nuclear and cytosolic fractions of MSCs (Fig. S1). Luciferase reporter assays indicated that Cd treatment dramatically increased TFE3-induced transcription in MSCs ()). Collectively, these results showed that Cd activated TFE3 nuclear translocation, and increased TFE3 activity, which contributed to autophagy-related gene expression and lysosomal biogenesis.
Figure 3. Cd induces nuclear translocation of TFE3 in MSCs. (a) MSCs cells were treated with various concentrations of Cd for 24 h, and the protein levels of the MITF/TFE family were analyzed by western blotting. ACTB was used as a loading control. Immunofluorescence of MSCs incubated with antibodies to TFE3 (b), TFEB (c), and MITF (d) following Cd (14 μM) treatment for 24 h. Nuclei were stained with DAPI. (e) MSCs were transfected with a TFE3-luciferase expression vector and incubated with 14 μM Cd. The luciferase activity was then measured. The results are expressed as the percentage of the control, which was set at 100 %. The values are presented as the means ± SEM, *P < 0.05, **P < 0.01 versus the control group. (n = 3). a.u., arbitrary units.
TFE3 mediates cd-induced autophagy in cultured mscs
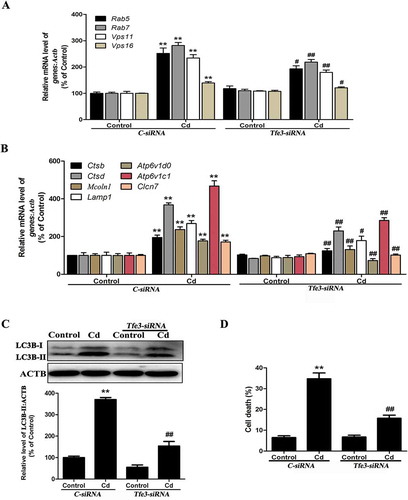
To further determine whether TFE3 could mediate Cd-induced autophagy, TFE3 was suppressed with a Tfe3-specific siRNA prior to Cd treatment of the MSCs. As shown in , suppression of TFE3 activity decreased the expression of the Cd-induced TFE3-responsive genes. Additionally, the protein level of LC3B-II/LC3B-I was also decreased ()). Moreover, the Tfe3-siRNA inhibited the Cd-induced death of the MSCs ()). These results suggested that Cd induced autophagic cell death by activating the TFE3 pathway and that inhibiting TFE3-dependent autophagy protected against the Cd–induced toxicity in MSCs.
Figure 4. The TFE3 pathway in Cd-induced autophagy in MSCs. (a-b) MSCs were treated with the siRNA for Tfe3 or the control and then incubated with 14 μM Cd for another 24 h. The mRNA levels of TFE3-target genes were then measured. (c) MSCs transfected with either control siRNA or Tfe3 siRNA were grown with or without Cd (14 μM) for 24 h. The LC3B-II level was determined by western blot. ACTB was the internal standard for protein loading. (d) MSCs transfected with either control siRNA or Tfe3 siRNA were grown with or without Cd (14 μM) for 24 h. Cell death was determined by trypan blue. The results are expressed as the percentage of the control, which was set to 100%. The values are presented as the means ± SEM, **P < 0.01 versus the control group, #P < 0.05, ##P < 0.01 versus the control-siRNA+ Cd (14 μM) group. (n = 4).
Cd activates TFE3 independently of MTORC1 in cultured mscs
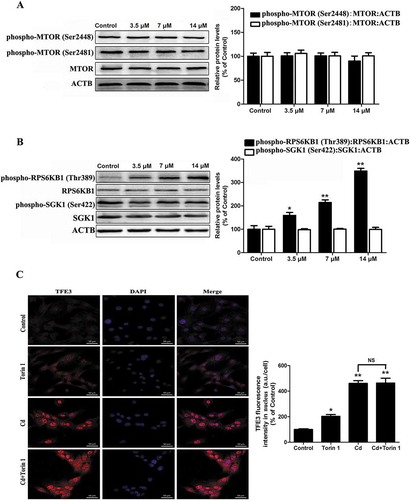
Recent studies have suggested that the transcription-regulating activity of TFE3 is dependent on its modification by phosphorylation and is controlled by a signaling mechanism that is sensitive to nutrients and growth factors, such as MTORC [Citation16]. MTOR (mechanistic target of rapamycin kinase) is a multidomain protein kinase that interacts with other proteins to form two primary complexes, MTORC1 and MTORC2 (mechanistic target of rapamycin kinase complex 2), whose activation status can be monitored by the evaluation of the phosphorylation of their target proteins RPS6KB1 (ribosomal protein S6 kinase, polypeptide 1) or SGK1 (serum/glucocorticoid regulated kinase 1) and PRKCA (protein kinase C, alpha), respectively [Citation22]. Surprisingly, we found that Cd induced a concentration-dependent increase in phosphorylation of RPS6KB1 but that no significant changes in the levels of phosphorylation of MTOR, SGK1 or PKCA were observed ( and Fig. S2). However, Torin1, a catalytic inhibitor that is able to completely suppress MTORC1 via binding to ATP-binding sites, did not affect TFE3 subcellular localization ()). Consistently, confocal microscopic analysis showed that although Rptor (regulatory associated protein of MTOR, complex 1)-siRNA alone significantly increases the subcellular localization of TFE3 in MSCs, it had no effect on the Cd-induced TFE3 nuclear translocation (Fig. S3A). Moreover, inactivation of MTORC1, together with dephosphorylation of TFE3 at Ser321, prevents binding to YWHA/14–3-3, resulting in the rapid accumulation of TFE3 in the nucleus [Citation23]. Here, 14 μM Cd treatment significantly increased the phosphorylation of TFE3 at Ser321 (Fig. S3B). All together, these results indicated that Cd induced TFE3 nuclear translocation through mechanisms that did not include MTORC1-inactivation.
Figure 5. Cd activates TFE3 in a manner independent of MTORC1 in cultured MSCs. MSCs were treated with various concentrations of Cd for 24 h. Western blot analysis was then performed to assess the expression levels of (a) phospho-MTOR (Ser2448) and phospho-MTOR (Ser2481) and (b) phospho-RPS6KB1 (Thr389) and phospho-SGK1 (Ser422). (c) Immunofluorescence of the 14 μM Cd-exposed MSCs that were incubated with anti-TFE3 antibody and DAPI after incubation with or without 250 nM of the MTORC1 inhibitor Torin 1. The results are expressed as the percentage of the control, which was set to 100%. The values are presented as the means ± SEM, *p < 0.05, **p < 0.01 versus control group. (n = 3).
AKT controls TFE3 activity via phosphorylation at ser565
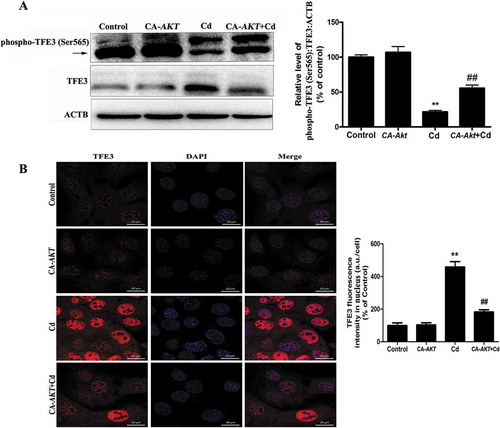
Our data indicated that a pharmacologically actionable pathway activates TFE3, independent of MTORC1. Recent work demonstrated that MTORC1-independent TFEB activation via AKT inhibition promotes cellular clearance in neurodegenerative storage diseases [Citation24]. Because TFE3 and TFEB share a similar structure, we postulated that AKT activity may be required for nuclear translocation of TFE3 in Cd-treated MSCs. Western blot analysis showed that the phosphorylated AKT levels in the MSCs were downregulated by exposure to Cd in a concentration-dependent manner ()). To determine whether AKT directly phosphorylates TFE3, we first built a position weight matrix (PWM) of the AKT target sequences using experimentally validated AKT substrates, and used AKT PWM to scan the TFE3 amino-acid sequences from multiple species. Using KinasePhos2.0, GPS3.0 and Scansite3 software, we predicted 4 potential AKT phosphorylation sites in TFE3, including Ser414, Ser545, Ser565, and Ser567 (, S4, and Table S1-S3). To further understand the mechanism by which TFE3 becomes activated in response to AKT dephosphorylation, we generated 4 antibodies that were individually specific for TFE3 that had been phosphorylated at Ser414, Ser545, Ser565, or Ser567. Interestingly, Cd treatment caused a significant decrease in the phosphorylation of TFE3 at Ser565, but no significant changes were detected in the levels of phosphorylation at the other sites ( and S4). An in vitro AKT kinase assay showed that AKT phosphorylates purified TFE3, but not the S565A mutant form of TFE3 (Fig. S5). Therefore, these results identify TFE3 as a direct phosphorylation substrate of AKT and demonstrate that Ser565 is a key residue for such phosphorylation. As expected, a mutant form of TFE3, TFE3S565A, displayed reduced cytosolic localization and increased the nuclear distribution ()). Importantly, overexpression of CA-Akt (constitutively active Akt) attenuated the Cd-induced decrease in phospho-AKT (Ser473), phospho-AKT (Thr308), phospho-GSK3B (Ser9) (glycogen synthase kinase 3 beta, downstream of phospho-AKT), and phospho-TFE3 (Ser565) protein expression and blocked Cd-induced TFE3 nuclear translocation in MSCs ( and S6). Together, these results support our hypothesis that the AKT-TFE3 pathway is involved in the regulation of Cd-mediated autophagy in MSCs.
Figure 6. AKT controls TFE3 activity via phosphorylation of Ser565. (a) MSCs were treated with various concentration of Cd for 24 h. Western blot analysis was then performed to assess the expression level of phospho-AKT (Ser473). ACTB was used as a loading control. (b) Identified phosphoacceptor motif for AKT. (c) KinasePhos2.0, GPS3.0 and Scansite3 software was used to predict the potential AKT phosphorylation sites in TFE3. (d) Multi-alignment of the TFE3 amino-acid sequences from the following species: Ac, Anolis carolensis; Bt, Bos taurus; Dr, Danio rerio; Fc, Felix catus; Gg, Gallus gallus; Hs, Homo sapiens; La, Loxodonta africana; Mm, Mus musculus; Rn, Rattus norvegicus; Sh, Sarcophilus harrisii; Sp, Strongylocentrotus purpuratus; Xl, Xenopus laevis . A consensus logo of AKT phosphorylation sites (generated at http://weblogo.berkeley.edu/logo.cgi) is aligned with TFE3 sequences. (e) MSCs were treated with various concentration of Cd for 24 h, and western blot analyses were then performed to assess the expression levels of phospho-TFE3 (Ser565). TFE3 was the internal standard for protein loading. (f) Subcellular localization of TFE3, TFE3S565D and TFE3S565A by fluorescently-tagged proteins. The results are expressed as the percentage of the control, which was set to 100 %. The values are presented as the means ± SEM, **p < 0.01 versus control or TFE3 group, ##p < 0.01 versus the TFE3S565D group. (n = 3).
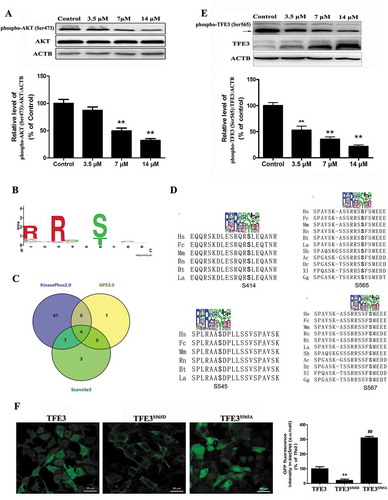
Figure 7. Overexpression of CA-Akt blocks the Cd-induced TFE3 nuclear translocation in MSCs. Overexpression of CA-Akt (a) attenuated the Cd-induced decrease in phospho-TFE3 (Ser565) protein expression, and TFE3 was the internal standard for protein loading. (b) Overexpression of CA-Akt blocked the Cd-induced TFE3 nuclear translocation in MSCs. The results are expressed as the percentage of the control, which was set to 100 %. The values are presented as the means ± SEM, **p < 0.01 versus the control group, and ##p < 0.01 versus the Cd (14 μM) group. (n = 4).
Ppp3/calcineurin accounts for the dual roles of AKT-TFE3 pathway in the effects of cd in cultured mscs
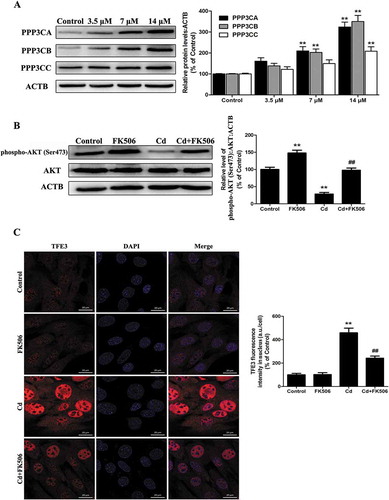
The Puertollano group has recently reported that the CALM (calmodulin)-regulated protein phosphatase PPP3/calcineurin plays an important role in TFE3 regulation [Citation15]. Therefore, we assessed whether PPP3/calcineurin might regulate TFE3 activity and whether it contributed to TFE3 activation in response to Cd stress. As seen in and S7, Cd treatment increased the activity of PPP3/calcineurin and enhanced the expression of the PPP3/calcineurin catalytic subunits PPP3CA (protein phosphatase 3, catalytic subunit, alpha isoform), PPP3CB (protein phosphatase 3 catalytic subunit beta) and PPP3CC (protein phosphatase 3, catalytic subunit, gamma isoform). Moreover, after treatment with the PPP3/calcineurin inhibitor FK506, the Cd-induced dephosphorylation of phospho-AKT (Ser473) was significantly inhibited ()). Furthermore, the translocation of TFE3 to the nucleus upon Cd treatment was significantly reduced in the presence of the FK506 (). These observations indicate that PPP3/calcineurin may mediate AKT dephosphorylation and may have an important role in the Cd-induced TFE3 nuclear translocation.
Figure 8. PPP3/calcineurin accounts for the dual roles of the AKT/TFE3 pathway in the effects of Cd. (A) MSCs were treated with various concentrations of Cd for 24 h. Western blot analysis was then performed to assess the expression level of the PPP3/calcineurin catalytic subunits PPP3CA, PPP3CB and PPP3CC. Treatment with the PPP3/calcineurin inhibitor FK506 (10 μM) for 24 h significantly reduced (B) the Cd-induced decreases in phospho-AKT (Ser473) as measured by western blot and (C) the Cd-induced nuclear translocation of TFE3 as indicated by immunofluorescence. Nuclei were stained with DAPI. The results are expressed as the percentage of the control, which was set to 100%. The values are presented as the means ± SEM, **p < 0.01 versus the control group, and ##p < 0.01 versus the Cd (14 μM) group. (n = 3).
Discussion
Cd is one of the most toxic metal compounds found in the environment and is an important environmental pollutant that can be distributed through the food chain [Citation25]. In 2004, the World Health Organization released a report recommending an acceptable daily intake level of 3 μg/l of drinking water for exposure where in some industrial areas the level of Cd in the water reached 18.4 mg/l [Citation26,Citation27]. This means that the Cd exposure concentration of human could be as high as 100 μM in some industrial areas. Long-term exposure of Cd could cause Cd accumulation in bone or other tissues. For example, increased Cd concentration was detected in aortic walls (up to 20 μM) of young smokers [Citation28]. Although there is still no report about the Cd concentration in the bone tissue of humans, we could cautiously speculate that the concentration of Cd in bone tissue can be higher than 20 μM in some smokers and other factory workers who exposed to Cd at very high concentrations. Increasing numbers of studies have shown that Cd exposure is associated with bone loss and a high risk of bone fractures [Citation29–Citation31]. Moreover, Cd can act directly on osteoclasts or osteoblasts by stimulating bone resorption or inhibiting bone formation both in vitro and in vivo [Citation32–Citation35]. Recently, Cd was shown to alter osteoblast functions and bone formation by inducing death of MSCs via membrane impairment, intracellular calcium elevation, and DNA breakage [Citation26,Citation36]. However, the precise mechanism of Cd-induced MSCs death is unclear. The current study is the first to show that (i) Cd activated the nuclear translocation of TFE3 but not that of TFEB or MITF, and increased TFE3 activity. These responses contributed to autophagy-related gene expression and lysosomal biogenesis, which resulted in autophagic cell death in MSCs. (ii) Cd decreased the levels of phospho-AKT (Ser473), which directly binds and dephosphorylates TFE3 at Ser565, thus promoting the nuclear translocation of TFE3 independently of the mechanistic target of MTORC1. (iii) PPP3/calcineurin accounts for the dual roles of AKT-TFE3 pathway in the effects of Cd in MSCs. Thus, the results of the present study provide new evidence that blocking PPP3/calcineurin-AKT-TFE3-dependent autophagy could provide the beneficial effects in the treatment of Cd-induced bone toxicity.
Autophagy may aid in cell survival by removing dysfunctional or damaged intracellular organelles induced by toxic metabolites and intracellular pathogens. However, excessive autophagic activation evokes autophagic programmed cell death [Citation37]. Consistent with our previous study [Citation9], the LC3 turnover experiment confirmed that Cd increased the autophagic flux in MSCs. In addition, Atg7 silencing significantly inhibited this increase in MSC death. These results provide further evidence that autophagy contributes predominantly to the Cd-mediated bone toxicity.
The MiT/TFE family of basic helix-loop-helix leucine zipper transcription factors includes MITF, TFEB, TFE3, and TFEC (transcription factor EC). MITF, TFEB, and TFE3 show a more ubiquitous pattern of expression and have been detected in multiple cell types, whereas TFEC expression is restricted to cells of myeloid origin [Citation38]. For this reason we did not measure TFEC expression in our model. Many of the autophagy subgroup of genes are targets of the MiT/TFE family of transcription factors. MiT/TFE family members are activated upon induction of autophagy, and these proteins serve to sustain both autophagosome formation and lysosome biogenesis [Citation39]. Moreover, assessment of the activation of the members of the MiT/TFE family was based on the detection of their translocation into the cell nuclei from their initial status as inactive forms that are located in the cytoplasm. Nuclear translocation of the members of the MiT/TFE family stimulates autophagy in various cell types through the increased expression of numerous genes associated with autophagy and lysosomal biogenesis [Citation40]. Interestingly, Cd treatment activated only the nuclear translocation of TFE3, but not that of TFEB or MITF, and increased TFE3 reporter activity, which demonstrated the TFE3-targeted gene expression. Moreover, Mitf-siRNA had no effect on Cd-increased autophagy-related genes, and this result may rule out the possibility that MITF is involved in the Cd-induced autophagy in MSCs (Fig. S8). Taken together, our results suggest that TFE3 can be considered to be the most relevant master transcriptional regulator of autophagy and lysosome function in Cd-induced MSCs death. In support of this, our previous study showed that Cd induced AMPK-FOXO3-BECN1-mediated autophagy in MSCs [Citation9]. However, the percentage of autophagy was not fully inhibited by treatment with Compound C borate to suppress the AMPK activity or by treatment with a specific Foxo3-siRNA to attenuate FOXO3 nuclear translocation, suggesting that Cd induces multiple signaling pathways to conduct MSCs autophagy including the TFE3 pathway.
TFE3 plays a dual role in determining cellular fate. TFE3 may promote cell survival by enhancing the expression of pro-survival genes. For example, overexpressed TFE3 increased the abundance of the lysosomal calcium channel MCOLN1(mucolipin 1), triggered lysosomal exocytosis, and promoted cellular clearance in Pompe myotubes [Citation16]. However, under prolonged stress conditions, activation of TFE3 may increase autophagic cell death [Citation15]. Consistent with this concept, Tfe3-siRNA inhibited the Cd-induced death of MSCs in our study, and it is well established that when cells fail to reach homeostasis and undergo a persistent stress such as Cd-induced bone toxicity, TFE3 can lead to autophagic cell death.
The intracellular localization of TFE3 is mainly regulated by the MTORC1, an amino acid-sensing complex on the lysosomal membrane that is strongly involved in the coordination of lysosomal activity and autophagy [Citation18]. Studies have shown that under normal conditions, TFE3 is diffusely distributed in the cytoplasm, where it can be phosphorylated by MTORC1. Phosphorylated TFE3 can associate with YWHA/14–3-3, which leads to the cytoplasmic sequestration of TFE3. TFE3 is transported into the nucleus when the activity of MTORC1 is abolished, and the nuclear transcriptional function of TFE3 activates the transcription of TFE3-targeting genes. However, Martina et al. suggest that treatment with ER stressors causes translocation of TFE3 to the nucleus in a process that is dependent on phospho-MAPK/ERK and PPP3/calcineurin but not on MTORC1 [Citation15]. In our study, we observed that Cd increased the MTORC1 activity levels in a dose-dependent manner. We also found that Torin 1 or Rptor-siRNA had no effect on the subcellular localization of TFE3 in Cd-treated MSCs. Thus, Cd does not induce TFE3 nuclear translocation in MSCs by inhibiting MTORC1.
AKT signaling has critical roles in multiple cellular metabolic, cell survival, cell proliferation, cell growth, and differentiation pathways [Citation41]. Under pathological conditions, downregulation of AKT activity can lead to cell death [Citation42]. Moreover, pioneering studies have shown that AKT regulates macroautophagy and chaperone-mediated autophagy [Citation43,Citation44]. Interestingly, Palmieri et al. [Citation24] identified AKT as an MTORC1-independent regulator of TFEB, which opens new perspectives for the pharmacological control of TFEB-mediated autophagy. Moreover, TFE3 and TFEB share a similar structure that includes 3 critically important regions, and these 2 factors bind overlapping sets of promoters and are post-transcriptionally regulated through a similar mechanism [Citation45]. It may be predicted that AKT activity might be required for TFE3 nuclear translocation in Cd-treated MSCs. Our study is the first to elucidate the mechanism by which AKT regulates the retention of TFE3 in the cytosol and to identify Ser565 as a novel phosphorylation site in TFE3. Moreover, co-immunoprecipitation (IP) experiments confirmed that AKT interacts with TFE3 and that this interaction is altered in the presence of Cd, suggesting that Cd affects not only the activity of AKT but also its interaction with TFE3(Fig. S9). However, it is noteworthy that the activity of TFE3 may be controlled by post-translational modifications, or interactions with other proteins [Citation15,Citation45,Citation46]. Further study is needed to identify other mechanisms for the Cd-mediated effects on the TFE3 pathway.
PPP3/calcineurin, a Ca2+-CALM (calmodulin)-dependent protein phosphatase, is a key mediator of diverse biological processes, including differentiation, apoptosis, growth and adaptive responses [Citation47]. Previous studies have shown that PPP3/calcineurin may mediate AKT dephosphorylation through the formation of a complex with AKT and that this complex has an important role in ischemic injury-induced dephosphorylation of AKT [Citation48]. In the present study, the dephosphorylation of AKT at (Ser473) was significantly reduced with FK506 treatment, which is consistent with previous reports [Citation48,Citation49]. Recently, some new findings have identified PPP3/calcineurin as a novel regulator of the lysosomal-autophagic pathway. Direct binding of PPP3/calcineurin to TFEB or TFE3 regulates autophagy [Citation15,Citation50,Citation51]. Our results provide new evidence that Cd-induced PPP3/calcineurin activation and the subsequent dephosphorylation of AKT significantly increased the translocation of TFE3 to the nucleus. These results confirmed that PPP3/calcineurin also indirectly communicates with TFE3 and that this process involves the bridging action of AKT.
However, our results are from cultured MSC cell line and we should be careful with extrapolating results from in vitro culture experiments to human populations. The problems with the current system are expected to be overcome by further improvements, including using animal studies in our future work.
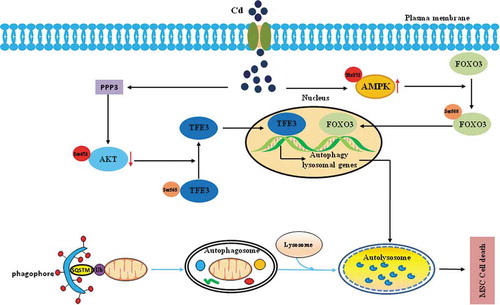
In summary, our findings provide new insights into the link between Cd and autophagy signaling, which could contribute to the development of drugs that target the PPP3/calcineurin-AKT-TFE3 signaling pathway. This possibility warrants future studies aimed at the clinical translation of these results to the treatment of Cd-induced bone toxicity ().
Figure 9. Schematic model of the MTORC1-independent TFE3 activation via PPP3/calcineurin-AKT inhibition to promote autophagic-lysosomal machinery in Cd-induced bone mesenchymal stem cell toxicity. The events occurred in a specific sequence: first, Cd exposure stimulates an increase in the PPP3/calcineurin activity that is responsible for the AKT(Ser473) dephosphorylation. Second, AKT(Ser473) dephosphorylation contributes to the dephosphorylation of TFE3 at Ser565, thus promoting TFE3 nuclear translocation. Third, after translocation to nuclei, TFE3 triggers excessive autophagy and lead to the death of the MSCs. The FOXO3 portion of the figure as well as the autophagy pathway at the bottom is seen text for further details.
Materials and methods
Drugs and reagents
Baf A1 (196,000) and 3-MA (M9281) were purchased from Sigma. Torin1 (475,991) and FK506 (342,500) were purchased from Millipore. Stock solutions were prepared in dimethylsulfoxide (DMSO), stored at −20°C, and diluted in fresh medium for each experiment. The final concentration of DMSO did not exceed 0.1% in any of the experiments to prevent cell toxicity.
Cell culture and experimental protocol
The C57BL/6 mouse bone marrow mesenchymal stem cell, MSC, was purchased from the Cyagen Biosciences (Guangzhou, China, MUBMX-01001). The MSCs were cultured in Dulbecco’s high glucose modified Eagle’s medium (DMEM) (HyClone, SH30022.01B) that was supplemented with 10% heat-inactivated FBS (Biological Industries, 04–001-1A) and 1% (v/v) penicillin/streptomycin (Sigma, P4333). The cells were grown in a 5% CO2 humidified atmosphere at 37 °C. At 80% confluence, the cells were treated with cadmium chloride (CdCl2; Sigma, 439,800) at various concentrations (0, 3.5, 7, and 14 μM) for 24 h. The dose of Cd we used is based on our previous study and studies from other groups [Citation9,Citation26].
Measurement of acidic vesicular organelles
Cell staining was performed according to published procedures. Briefly, acridine orange (Sigma, 235,474) was added at a final concentration of 1 μg/ml for a period of 30 min. The cells were then removed from the plate by trypsinization (Beyotime, C0205) and collected in phenol red-free growth medium (Thermo Fisher, 21,063,029). The green(510 nm) and red (650 nm) fluorescence emissions from 1 × 10⁴ cells illuminated with blue (488 nm) excitation light were measured with a FACSVerse flow cytometer using CellQuest software (Becton Dickinson) [Citation52].
Transmission electron microscopy
For the transmission electron microscopy studies, the MSCs were treated with Cd (14 μM) for 24 h,then washed twice with PBS (Thermo Fisher, 10,010,049) and fixed with 2.5% glutaraldehyde (Sigma, G5882) . The cells were post-fixed in 2% osmium tetroxide (Sigma, O5500), embedded and stained with uranyl acetate/lead citrate (Sigma, 15,326). The cells were observed using a JEM-1400Plus electron microscope (JEOL, Japan) to detect autophagic vacuoles.
RNA interference
The MSCs were transfected with either 100 pmol/L Atg7-targeting small siRNA (Santa Cruz Biotechnology, sc41448), Tfe3-targeting small siRNA (Santa Cruz Biotechnology, sc38508), Rptor-targeting small siRNA (Santa Cruz Biotechnology, sc108002) or a control nonspecific siRNA (C-siRNA, Santa Cruz Biotechnology, sc37007). Beginning 24 h after the transfection, the cells were exposed to 14 μM Cd for 24 h. The cells were then collected and processed for immunoblotting (Fig. S10) and the cell death was analyzed [Citation53].
Cell death assay
MSCs were plated in the 6-well plates (5 × 10⁵ cells per well) and incubated for 24 h. After being treated with Cd, the cells were detached with 300 μl of a trypsin-EDTA solution (Beyotime, C0011-2). The suspension of the detached cells was centrifuged at 300 g for 5 min. Then, the pellet was combined with 800 μl trypan blue solution and dispersed. After staining for 3 min, the cells were counted using an automated cell counter (TC10, Bio-Rad). The dead cells were stained blue. The cell mortality (%) is expressed as percentage of the dead cells [Citation20].
Luciferase reporter assays
To detect the activation of TFE3, MSCs were transfected with an adenovirus that encoded TFE3-responsive firefly luciferase and Renilla luciferase (generated by OBIO Technology, China). After transfection for 48 h, the cells were washed with PBS, exposed to different doses of Cd for 24 h, and then assayed for luciferase activity using the dual-luciferase reporter assay kit (Beyotime, RG027) according to the manufacturer’s instructions [Citation9]. The relative luciferase activity was normalized to the luciferase activity of the negative control, which was used for the comparisons among the groups. TFE3 transcriptional activity = (relative light units of firefly luciferase/relative light units of renilla luciferase)× 100. The Renilla luciferase activity was used to normalize for variations in transfection efficiency. The readings were normalized against to the protein concentrations of the cell lysates.
Real-time PCR analysis
Total RNA was extracted using RNAiso Plus RNA extraction reagent (TaKaRa, 9109), and 1 μg of total RNA was reverse transcribed in a 20 μl reaction mixture using the PrimeScript RT Reagent Kit with gDNA Eraser (Perfect Real Time; TaKaRa, RR047A) for cDNA synthesis according to the manufacturer’s protocols. The resulting RT product was expanded using the NovoStart® SYBR qPCR Supermix (Novoprotein, E090-01A) and the data were collected using an iQ5 Real-Time PCR Detection System (Bio-Rad) system. The mean fold change is shown as the natural logarithm of the RQ values and the error was estimated by evaluating the 2−△△Ct equation using △△Ct plus standard deviation and △△Ct minus the standard deviation [Citation54]. The primers used for the amplification of the indicated genes are listed in Table S4.
Immunocytochemical analysis of MSCs
Immunofluorescence analysis was performed according to standard procedures. Briefly, the cells were grown on gelatin-coated glass coverslips. After incubating with the indicated agent, the cells were fixed with 4% (w/v) paraformaldehyde (Sigma, 16,005) in PBS for 30 min followed by permeabilization with 0.25% Triton X-100 (Sigma, T9284) in PBS for 10 min at room temperature. Then, the cells were blocked with 10% BSA in PBS. The fixed cells were incubated with anti-TFEB (1:500, Bethyl Laboratories, A303-673A), anti-TFE3 (1:100, Sigma, HPA023881), or anti-MITF (1:100, ThermoFisher, PA5-38294) in an immuno staining dilution buffer at 4°C overnight. The slides were then washed 5 times with PBS and incubated with an Alexa Fluor® 568 donkey anti-rabbit IgG (H + L) antibody (Life Technologies, A10042) at a 1:200 dilution for 1 h at 37°C. DAPI Staining Solution (Beyotime, C1005) was used for nuclear counterstaining. The coverslips were mounted onto glass slides using Antifade Mounting Medium (Beyotime, P0126). The stained samples were examined using a Zeiss confocal laser scanning microscope (Zeiss, LSM780) equipped with a 63 x oil objective. At least 50 cells were counted for each experiment [Citation55].
Immunoprecipitation
MSCs were treated with Cd and lysed with cell lysis buffer (Beyotime, P0013). The lysates were clarified by centrifugation at 12,000 x g for 15 min, and the supernatants were used for immunoprecipitation. Aliquots of 500 μg of the protein extracts were incubated with the pan-AKT primary antibody (Cell Signaling Technology, 4685) for 4 h at 4°C, followed by a second incubation overnight at 4°C with the appropriate protein A agarose (Beyotime, P2006). The beads were washed 3 times, solubilized in 40 μl of 3x SDS sample buffer (Cell Signaling Technology, 7722), and analyzed by western blotting.
Nuclear and cytoplasmic protein extraction
Nuclear–cytoplasmic fractionation was conducted using NE-PER™ Nuclear and Cytoplasmic Extraction Reagents (Life Technologies, 78,833) according to the manufacturer’s instructions. The protein concentration was determined using the BCA protein assay reagent (Beyotime, P0010) with bovine serum albumin as the standard, and equal amounts of each cell lysate were separated by 12% SDS-PAGE. To assess the purity of the fractionation, the cytoplasmic and nuclear fractions were confirmed by immunoblotting using anti-ACTB (1:1000; Sigma, A1978) as a cytoplasmic marker and anti-histone H3(1:1000, Sigma, SAB4500352) as a nuclear marker, respectively [Citation23].
TFE3 phosphosite antibodies
Rabbit polyclonal TFE3 to phosphosite-specific antibodies were custom-made through Abmart [Citation56,Citation57]. Briefly, a phosphopeptide and a control peptide were synthesized for each phosphosite, and rabbits were immunized with the phosphopeptide conjugated to keyhole limpet hemocyanin (KLH) carrier. The polyclonal antiserum was purified by affinity chromatography using phosphopeptide, and the eluate was passed through the column coupled with control peptides to remove nonspecific antibodies. For anti-p-Ser414, the phosphopeptide is (CLESRQRS[P]LEQ). For anti-p-Ser545, the phospho-peptide is (CSPLRAAS[P]DPL). For anti-p-Ser565, the phosphopeptide is (CASSRRSS[P]FSM). For anti-p-Ser567 the phosphopeptide is (CNIKREIS[P]ETE). The specificity of the antibody was validated by the Abmart Company using TFE3 knockout (KO) HeLa cell line (EdiGene, CL0016564402A) and TFE3 knockout (KO) HeLa cell lysate (EdiGene, L0016564402A) according to previous study (Fig. S11) [Citation58,Citation59]. Moreover, the specificity of the antibody was also confirmed by our lab by using Tfe3 knockdown (KD) MSCs (Fig. S12). Furthermore, the original data are provided to guide researchers who want to use the TFE3 phosphosite-specific antibodies (Fig. S13).
Western blot analysis
The MSC lysates were centrifuged for 15 min at 12,000 x g, and the resulting supernatant fractions were transferred to a new tube. The protein concentrations were determined using a Bradford protein assay kit (Novoprotein, PA001-01A). Equal quantities of total protein per lane were separated by SDS-PAGE and transferred to PVDF membranes (Sigma, Z671010). The membranes were blocked with 5% non-fat dry milk powder in 0.05% TBST for 1h at room temperature, and then incubated overnight at 4°C with the specific antibodies. Following incubation with primary antibody, the membranes were washed 3 times in TBST (Sigma, SRE0031) and subsequently incubated with the corresponding HRP-conjugated goat anti-rabbit or goat anti-mouse secondary antibody (Beyotime, A0208 and A0216, respectively) for 1 h at room temperature. Next, the membranes were washed, and the bands were visualized using a Luminata Forte Western HRP Substrate (Merck Millipore, WBLUF0500) and quantified using ImageJ software [Citation60]. provides further details regarding the identity and specificity of the primary antibodies.
Table 1. Antibodies used for the western blot experiments.
Recombinant protein
GST-AKT1 proteins were expressed in bacterial BL21 (DE3) cells (Beyotime, D0337) and purified with glutathione-Sepharose beads (Separopore, 20,181,044–2). MBP-TFE3 and MBP-TFE3S565A proteins were expressed in bacterial BL21 (DE3) cells and purified with amylose resin (New England BioLabs, E8021S). All of the purified active AKT1, TFE3 enzyme and TFE3S565A proteins are generated by GenScript Corporation (Nanjing, China).
In vitro kinase assays
Purified TFE3S565A or TFE3 proteins (3 μg) were incubated with purified active AKT1 for 1 h at 37 °C in kinase buffer (25 mM HEPES, pH 7.4, 50 mM NaCl, 5 mM MgCl2, 1 mM CaCl2, 1 mM dithiothreitol, 30 μM ATP, 0.5 mg/ml BSA) containing 0.5 μCi of [γ−32 P]ATP (Sigma, 10,102,342,001). Kinase reaction was stopped by heating at 100 °C for 5 min in 2.5x SDS loading dye. Half of the sample was subjected to SDS-PAGE. The gels were dried and exposed to phosphor-imager screens (Typhoon FLA 7000 IP, GE) for autoradiography, followed by Coomassie blue (Beyotime, P0017) staining to visualize the proteins [Citation61].
AKT phosphosite prediction
To identify the candidate phosphosites on TFE3 that could be targeted by AKT, experimentally determined, non-redundant AKT phosphosite sequences were downloaded from the PhosphositePlus database (http://www. phosphosite.org/) and used to build a PWM to scan TFE3 amino-acid sequences using the MEME Suite 4.11.3 (http://meme-suite.org/). KinasePhos2.0, GPS3.0 and Scansite3 software were used to predict the potential AKT phosphorylation sites in TFE3. The TFE3 sequences were aligned by using MAFFT (http://mafft.cbrc.jp/alignment/software/) with the E-INS-i mode.
PPP3/calcineurin activity assay
PPP3/calcineurin activity was measured using a PPP3/calcineurin cellular activity assay kit (Enzo LifeSciences, BML-AK816-0001), following manufacturer’s instructions [Citation62,Citation63]. The RII phosphopeptide was used as a highly specific substrate for PPP3/calcineurin. The detection of free inorganic phosphate released from RII by PPP3/calcineurin was based on a malachite green dye reaction. After incubation at 30°C for 20 min, the reactions were terminated, and the optical density at 620 nm was determined for each sample on a microplate reader. The amount of free phosphate was determined by using a phosphate standard curve.
Virus-mediated gene expression
MSCs were transfected with PAdeno-mCMV-EGFP-3FLAG-Tfe3, PAdeno-mCMV-EGFP- 3FLAG-Tfe3(S565A),PAdeno-mCMV-EGFP-3FLAG-Tfe3(S565D), PAdeno-mCMV-3FLAG-CA -Akt (generated by OBIO Technology, China) or a control vector, according to the manufacturer’s instructions. Briefly, a total of 5 × 10⁴ cells were seeded into each well of a 6-well plate. At 50 % confluence, 1 ml DMEM without FBS but containing 1 μl adenovirus was added into each well (MOI = 300). Then, 2 h later, another 1 ml DMEM with FBS was supplemented with 10 % FBS added into each well. After cultured for 24 h, the supernatant and adenovirus which did not infect the cells were replaced by 2 ml fresh DMEM supplemented with 10 % FBS. Forty-eight h after the adenovirus transduction, the cells were treated with either the control vehicle or 14 μM Cd for 24 h, and then imaged using a Zeiss confocal laser scanning microscope (Zeiss, LSM780) or further analyzed by western blotting.
Statistical analysis
The data were analyzed using GraphPad Prism-5 software. All of the experimental data are expressed as the mean ±SEM, and each experiment was performed a minimum of 3 times. The data for the groups were compared using one-way ANOVAs (Bonferroni’s multiple comparison test) for parametric (normality and equal variance passed) data. The Kruskal-Wallis ANOVA-based test on ranks followed by Dunn’s post-hoc test was used for nonparametric data (i.e., those that failed normality and/or equal variance tests). For experiments with only 2 groups, the 2-tailed Mann-Whitney rank-sum test (nonparametric) or the 2-tailed unpaired Student t-test was performed.
Supplemental Material
Download Zip (6.5 MB)Disclosure statement
No potential conflict of interest was reported by the authors.
Supplementary Material
Supplemental data for this article can be accessed here.
Additional information
Funding
Related Research Data
References
- Waalkes MP. Cadmium carcinogenesis. Mutat Res. 2003 Dec 10;533(1–2):107–120.
- Satarug S, Baker JR, Urbenjapol S, et al. A global perspective on cadmium pollution and toxicity in non-occupationally exposed population. Toxicol Lett. 2003 Jan 31;137(1–2):65–83.
- Perlman GD, Berman L, Leann K, et al. Agency for Toxic substances and disease registry brownfields/land-reuse site tool. J Environ Health. 2012 Dec;75(5):30–34.
- Huang J, Okuka M, McLean M, et al. Telomere susceptibility to cigarette smoke-induced oxidative damage and chromosomal instability of mouse embryos in vitro. Free Radic Biol Med. 2010 Jun 15;48(12):1663–1676.
- Larson C. ENVIRONMENTAL SCIENCE China gets serious about its pollutant-laden soil. Science. 2014 Mar 28;343(6178):1415–1416.
- Jin L, Liu J, Ye B, et al. Concentrations of selected heavy metals in maternal blood and associated factors in rural areas in Shanxi Province, China. Environ Int. 2014;66:157–164.
- Chen X, Ren S, Zhu G, et al. Emodin suppresses cadmium-induced osteoporosis by inhibiting osteoclast formation. Environ Toxicol Pharmacol. 2017;54:162–168.
- Chen X, Wang K, Wang Z, et al. Effects of lead and cadmium co-exposure on bone mineral density in a Chinese population. Bone. 2014;63:76–80.
- Yang M, Pi H, Li M, et al. From the cover: autophagy induction contributes to cadmium toxicity in mesenchymal stem cells via AMPK/FOXO3a/BECN1 signaling. Toxicol Sci. 2016 Nov;154(1):101–114.
- Perera RM, Stoykova S, Nicolay BN, et al. Transcriptional control of autophagy-lysosome function drives pancreatic cancer metabolism. Nature. 2015 Aug 20;524(7565):361–365.
- Raben N, Puertollano R. TFEB and TFE3: linking Lysosomes to Cellular Adaptation to Stress. Annu Rev Cell Dev Biol. 2016 Oct 06;32:255–278.
- Martina JA, Puertollano R. TFEB and TFE3: the art of multi-tasking under stress conditions. Transcription. 2017 Jan;8(1):48–54.
- Pastore N, Brady OA, Diab HI, et al. TFEB and TFE3 cooperate in the regulation of the innate immune response in activated macrophages. Autophagy. 2016;12(8):1240–1258.
- Bordi M, Berg MJ, Mohan PS, et al. Autophagy flux in CA1 neurons of Alzheimer hippocampus: increased induction overburdens failing lysosomes to propel neuritic dystrophy. Autophagy. 2016;Dec;12(12):2467–2483.
- Martina JA, Diab HI, Brady OA, et al. TFEB and TFE3 are novel components of the integrated stress response. Embo Journal. 2016 Mar 1;35(5):479–495.
- Martina JA, Diab HI, Lishu L, et al. The nutrient-responsive transcription factor tfe3 promotes autophagy, lysosomal biogenesis, and clearance of cellular debris. Sci Signal. 2014 Jan 21;7:309.
- Slade L, Pulinilkunnil T. The MiTF/TFE family of transcription factors: master regulators of organelle signaling, metabolism and stress adaptation. Mol Cancer Res. 2017 Aug 29.
- Roczniak-Ferguson A, Petit CS, Froehlich F, et al. The transcription factor TFEB links mTORC1 signaling to transcriptional control of lysosome homeostasis. Sci Signal. 2012 Jun 12;5(228):ra42.
- Kliosnky D. Guidelines for the Use and interpretation of assays for monitoring autophagy (3rd edition). Autophagy. 2016;12(2):443.
- Pi H, Xu S, Reiter RJ, et al. SIRT3-SOD2-mROS-dependent autophagy in cadmium-induced hepatotoxicity and salvage by melatonin. Autophagy. 2015;11(7):1037–1051.
- Ferguson SM. Beyond indigestion: emerging roles for lysosome-based signaling in human disease. Curr Opin Cell Biol. 2015 Aug;35:59–68.
- Zhou J, Tan SH, Nicolas V, et al. Activation of lysosomal function in the course of autophagy via mTORC1 suppression and autophagosome-lysosome fusion. Cell Res. 2013 Apr;23(4):508–523.
- Fan T, Pi H, Li M, et al. Inhibiting MT2-TFE3-dependent autophagy enhances melatonin-induced apoptosis in tongue squamous cell carcinoma. J Pineal Res. 2017 Nov;17.
- Palmieri M, Pal R, Nelvagal HR, et al. mTORC1-independent TFEB activation via Akt inhibition promotes cellular clearance in neurodegenerative storage diseases. Nat Commun. 2017 Feb 06;8:14338.
- Larison JR, Likens GE, Fitzpatrick JW, et al. Cadmium toxicity among wildlife in the colorado rocky mountains. Nature. 2000 Jul 13;406(6792):181–183.
- Abnosi MH, Golami S. Cadmium chloride treatment of rats significantly impairs membrane integrity of mesenchymal stem cells via electrolyte imbalance and lipid peroxidation, a possible explanation of Cd related osteoporosis. Iran J Basic Med Sci. 2017 Mar;20(3):280–287.
- Sarwar N, Malhi SS, Zia MH, et al. Role of mineral nutrition in minimizing cadmium accumulation by plants. J Sci Food Agric. 2010 Apr 30;90(6):925–937.
- Abu-Hayyeh S, Sian M, Jones KG, et al. Cadmium accumulation in aortas of smokers. Arterioscler Thromb Vasc Biol. 2001 May;21(5):863–867.
- Akesson A, Bjellerup P, Lundh T, et al. Cadmium-induced effects on bone in a population-based study of women. Environ Health Perspect. 2006 Jun;114(6):830–834.
- Sughis M, Penders J, Haufroid V, et al. Bone resorption and environmental exposure to cadmium in children: a cross–sectional study. Environ Health. 2011 Dec;8(10):104.
- Schutte R, Nawrot TS, Richart T, et al. Bone resorption and environmental exposure to cadmium in women: a population study. Environ Health Perspect. 2008 Jun;116(6):777–783.
- Chen X, Zhu G, Gu S, et al. Effects of cadmium on osteoblasts and osteoclasts in vitro. Environ Toxicol Pharmacol. 2009 Sep;28(2):232–236.
- Arbon KS, Christensen CM, Harvey WA, et al. Cadmium exposure activates the ERK signaling pathway leading to altered osteoblast gene expression and apoptotic death in Saos-2 cells. Food Chem Toxicol. 2012 Feb;50(2):198–205.
- Rodriguez J, Mandalunis PM. Effect of cadmium on bone tissue in growing animals. Exp Toxicol Pathol. 2016 Aug;68(7):391–397.
- Chen X, Qin B, Li X, et al. Effects of fluoride and cadmium co-exposure on bone in male rats. Biol Trace Elem Res. 2013 Sep;154(3):396–402.
- Hussein AM, Hasan S. Cadmium affects viability of bone marrow mesenchymal stem cells through membrane impairment, intracellular calcium elevation and DNA breakage. Indian J Med Sci. 2010 Apr;64(4):177–186.
- Liu Y, Levine B. Autosis and autophagic cell death: the dark side of autophagy. Cell Death Differ. 2014 Sep 26. DOI:10.1038/cdd.2014.143.
- Rehli M, Lichanska A, Cassady AI, et al. TFEC is a macrophage-restricted member of the microphthalmia-TFE subfamily of basic helix-loop-helix leucine zipper transcription factors. J Immunol. 1999 Feb 01;162(3):1559–1565.
- Ploper D, De Robertis EM. The MITF family of transcription factors: role in endolysosomal biogenesis, Wnt signaling, and oncogenesis. Pharmacol Res. 2015 Sep;99:36–43.
- Martina JA, Diab HI, Li H, et al. Novel roles for the MiTF/TFE family of transcription factors in organelle biogenesis, nutrient sensing, and energy homeostasis. Cell Mol Life Sci. 2014 Jul;71(13):2483–2497.
- Ouyang ZH, Wang WJ, Yan YG, et al. The PI3K/Akt pathway: a critical player in intervertebral disc degeneration. Oncotarget. 2017 Aug 22;8(34):57870–57881.
- Datta SR, Brunet A, Greenberg ME. Cellular survival: a play in three Akts. Genes Dev. 1999 Nov 15;13(22):2905–2927.
- Wang RC, Wei Y, An Z, et al. Akt-mediated regulation of autophagy and tumorigenesis through Beclin 1 phosphorylation. Science. 2012 Nov 16;338(6109):956–959.
- Arias E, Koga H, Diaz A, et al. Lysosomal mTORC2/PHLPP1/Akt regulate chaperone-mediated autophagy. Mol Cell. 2015 Jul 16;59(2):270–284.
- Nezich CL, Wang CX, Fogel AI, et al. MiT/TFE transcription factors are activated during mitophagy downstream of Parkin and Atg5. J Cell Biol. 2015 Aug 3;210(3):435–450.
- Taniguchi M, Nadanaka S, Tanakura S, et al. TFE3 Is a bHLH-ZIP-type transcription factor that regulates the mammalian golgi stress response. Cell Struct Funct. 2015;40(1):13–30.
- Steiner JP, Dawson TM, Fotuhi M, et al. High brain densities of the immunophilin FKBP colocalized with calcineurin. Nature. 1992 Aug 13;358(6387):584–587.
- Park CH, Kim YS, Kim YH, et al. Calcineurin mediates AKT dephosphorylation in the ischemic rat retina. Brain Res. 2008 Oct;09(1234):148–157.
- Gabryel B, Pudelko A, Adamczyk J, et al. Calcineurin and Erk1/2-signaling pathways are involved in the antiapoptotic effect of cyclosporin A on astrocytes exposed to simulated ischemia in vitro. Naunyn Schmiedebergs Arch Pharmacol. 2006 Nov;374(2):127–139.
- Medina DL, Di Paola S, Peluso I, et al. Lysosomal calcium signalling regulates autophagy through calcineurin and TFEB. Nat Cell Biol. 2015 Mar;17(3):288–299.
- Song R, Li J, Zhang J, et al. Peptides derived from transcription factor EB bind to calcineurin at a similar region as the NFAT-type motif. Biochimie. 2017;142:158–167.
- Wang SH, Shih YL, Kuo TC, et al. Cadmium toxicity toward autophagy through ros-activated gsk-3 beta in mesangial cells. Toxicol Sci. 2009 Mar;108(1):124–131.
- Pi H, Xu S, Zhang L, et al. Dynamin 1-like-dependent mitochondrial fission initiates overactive mitophagy in the hepatotoxicity of cadmium. Autophagy. 2013 Nov 01;9(11):1780–1800.
- Pi H, Li M, Tian L, et al. Enhancing lysosomal biogenesis and autophagic flux by activating the transcription factor EB protects against cadmium-induced neurotoxicity. Sci Rep. 2017 Feb;27(7):43466.
- Li M, Pi HF, Yang ZQ, et al. Melatonin antagonizes cadmium-induced neurotoxicity by activating the transcription factor EB-dependent autophagy-lysosome machinery in mouse neuroblastoma cells. J Pineal Res. 2016 Oct;61(3):353–369.
- Li L, Li M, Yu L, et al. The FLS2-associated kinase BIK1 directly phosphorylates the NADPH oxidase RbohD to control plant immunity. Cell Host & Microbe. 2014 Mar 12;15(3):329–338.
- Zhu G, Fan Z, Ding M, et al. An EGFR/PI3K/AKT axis promotes accumulation of the Rac1-GEF Tiam1 that is critical in EGFR-driven tumorigenesis. Oncogene. 2015 Dec 3;34(49):5971–5982.
- Uhlen M, Bandrowski A, Carr S, et al. A proposal for validation of antibodies. Nature Methods. 2016 Oct;13(10):823–827.
- Yin JA, Gao G, Liu XJ, et al. Genetic variation in glia-neuron signalling modulates ageing rate. Nature. 2017 Nov 8;551(7679):198–203.
- Guo P, Pi H, Xu S, et al. Melatonin Improves mitochondrial function by promoting MT1/SIRT1/PGC-1 alpha-dependent mitochondrial biogenesis in cadmium-induced hepatotoxicity in vitro. Toxicol Sci. 2014 Nov;142(1):182–195.
- Li Y, Xu M, Ding X, et al. Protein kinase C controls lysosome biogenesis independently of mTORC1. Nat Cell Biol. 2016 Oct;18(10):1065–1077.
- Faccenda D, Tan CH, Seraphim A, et al. IF1 limits the apoptotic-signalling cascade by preventing mitochondrial remodelling. Cell Death Differ. 2013 May;20(5):686–697.
- Niitsu H, Hinoi T, Kawaguchi Y, et al. KRAS mutation leads to decreased expression of regulator of calcineurin 2, resulting in tumor proliferation in colorectal cancer. Oncogenesis. 2016 Aug 15;5(8):e253.