
ABSTRACT
Helicobacter pylori (H. pylori) is a common human pathogenic bacterium. Once infected, it is difficult for the host to clear this organism using the innate immune system. Increased antibiotic resistance further makes it challenging for effective eradication. However, the mechanisms of immune evasion still remain obscure, and novel strategies should be developed to efficiently eliminate H. pylori infection in stomachs. Here we uncovered desirable anti-H. pylori effect of vitamin D3 both in vitro and in vivo, even against antibiotic-resistant strains. We showed that H. pylori can invade into the gastric epithelium where they became sequestered and survived in autophagosomes with impaired lysosomal acidification. Vitamin D3 treatment caused a restored lysosomal degradation function by activating the PDIA3 receptor, thereby promoting the nuclear translocation of PDIA3-STAT3 protein complex and the subsequent upregulation of MCOLN3 channels, resulting in an enhanced Ca2+ release from lysosomes and normalized lysosomal acidification. The recovered lysosomal degradation function drives H. pylori to be eliminated through the autolysosomal pathway. These findings provide a novel pathogenic mechanism on how H. pylori can survive in the gastric epithelium, and a unique pathway for vitamin D3 to reactivate the autolysosomal degradation function, which is critical for the antibacterial action of vitamin D3 both in cells and in animals, and perhaps further in humans.
Abbreviations: 1,25D3: 1α, 25-dihydroxyvitamin D3; ATG5: autophagy related 5; Baf A1: bafilomycin A1; BECN1: beclin 1; CagA: cytotoxin-associated gene A; CFU: colony-forming unit; ChIP-PCR: chromatin immunoprecipitation-polymerase chain reaction; Con A: concanamycin A; CQ: chloroquine; CRISPR: clustered regularly interspaced short palindromic repeats; CTSD: cathepsin D; GPN: Gly-Phe-β-naphthylamide; H. pylori: Helicobacter pylori; LAMP1: lysosomal associated membrane protein 1; MAP1LC3B/LC3B: microtubule associated protein 1 light chain 3 beta; MCOLN1: mucolipin 1; MCOLN3: mucolipin 3; MCU: mitochondrial calcium uniporter; MOI: multiplicity of infection; NAGLU: N-acetyl-alpha-glucosaminidase; PDIA3: protein disulfide isomerase family A member 3; PMA: phorbol 12-myristate 13-acetate; PRKC: protein kinase C; SQSTM1: sequestosome 1; STAT3: signal transducer and activator of transcription 3; SS1: Sydney Strain 1; TRP: transient receptor potential; VacA: vacuolating cytotoxin; VD3: vitamin D3; VDR: vitamin D receptor
Introduction
Helicobacter pylori (H. pylori) is a gram-negative spiral bacterium that has colonized over 50% of the world’s population as a result of constant failure in H. pylori clearance by the host immune system in the upper gastrointestinal tract [Citation1]. Even worse, the globally accepted triple therapy comprising a proton pump inhibitor plus 2 antibiotics is challenged by a steady increase in H. pylori resistance to classical antibiotics, especially to clarithromycin [Citation2]. It has been suggested that the inefficacy in pathogen eradication is due to the capacity of H. pylori for hiding inside the host cells [Citation3,Citation4], thereby escaping from the innate response by immune cells. Although the precise mechanisms of immune evasion still remain obscure, increasing evidence suggests that macroautophagy/autophagy could play an important role in the pathogenesis of H. pylori-associated gastric disorders [Citation5,Citation6].
Autophagy, characterized by the formation of double-membrane vesicles designated as autophagosomes, is an evolutionarily conserved self-degradation process utilized by host cells to maintain cellular homeostasis and protect against invading pathogens [Citation7]. Lysosomes are membrane-bound organelles that contain over 50 different degradative hydrolases. By fusing with lysosomes, autophagosomes mature into autolysosomes, in which they sequester pathogens followed by degradation by lysosomal proteases [Citation8]. Initially, the autophagic pathway was regarded as the host defense strategy against invading pathogens, as several microbes such as Listeria monocytogenes were captured by autophagosomes, then degraded to avoid persistent infection [Citation9]. However, emerging evidence underlines an unexpected behavior of bacteria to disrupt this autophagic process, allowing active intracellular replication [Citation10]. In the past decades, researchers have proved that H. pylori can induce autophagy in several gastric cell lines [Citation11]. D Raju et al. even revealed a suppressive function of H. pylori vacuolating cytotoxin (VacA) in autophagosome maturation [Citation12], suggesting that the bacterium might utilize these intracellular compartments to hibernate and further replicate for long-term survival in the gastric mucosa. However, the molecular mechanisms concerning the evasion of H. pylori from the host immune system and attack by antibiotics still needs to be elucidated, and novel ‘antibiotics’ are urgently demanded for drug-resistant H. pylori treatment.
Vitamin D3 (VD3) as a steroid hormone is known as a supplement to improve overall health. Emerging evidence also pointed out a potential antimicrobial activity of VD3. Indeed, its antimicrobial action against Mycobacterium tuberculosis infection has been verified for years [Citation13], even though the precise mechanisms governing this antibacterial activity still remain controversial. In the present study, we sought to delineate the mechanisms of how VD3 can revitalize the host defense mechanism through promoting autolysosome function, which could be hampered by H. pylori infection, thereby helping to eliminate invading bacteria in the gastric epithelium. We demonstrated that the PDIA3/ERp57/Grp58/1,25-MARRS (protein disulfide isomerase family A member 3)-STAT3 (signal transducer and activator of transcription 3) complex-evoked upregulation of the Ca2+ channel MCOLN3 (mucolipin 3), followed by enhanced Ca2+ release from lysosomes, are necessary for the antimicrobial action imposed by VD3 in gastric epithelial cells. These novel antibacterial mechanisms are different from the traditional antibiotics, which represent an effective therapeutic option against H. pylori, especially useful for those antibiotic-resistant strains in clinical practice.
Results
H. pylori was eradicated by VD3 both in vivo and in vitro
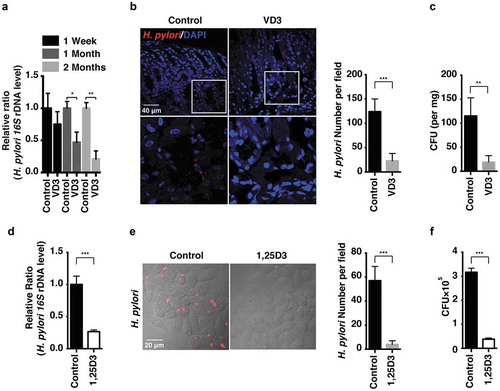
H. pylori Sydney Strain 1 (SS1) was used to establish chronic gastritis in mouse stomachs as described previously [Citation14,Citation15]. H. pylori infection levels in a bacteria-gavaged mouse model were measured by real-time PCR (), immunofluorescence staining () and colony formation assay of quantitative cultures (). H. pylori infection levels were efficiently reduced after VD3 administration for 2 months; 1α, 25-dihydroxyvitamin D3 (1,25D3) is the biologically active form of vitamin D3. In order to assess its antimicrobial action on intracellular H. pylori replication, human normal gastric epithelial cells (HFE145) were infected with H. pylori SS1 strain for 72 h with or without 1,25D3 treatment. Consistent with the animal results, intracellular H. pylori levels were significantly reduced in 1,25D3-treated HFE145 cells (), indicating that VD3 enhanced the clearance of H. pylori both in vitro and in vivo.
Figure 1. H. pylori was eradicated by VD3 both in vivo and in vitro. (a–c) C57BL/6 mice (n = 8 per group) were infected with H. pylori SS1 strain for 1 month, and then administered with or without VD3 (1000 IU/kg, intragavage) every other day for the indicated times. (a) Mouse gastric tissues were extracted for DNA. H. pylori levels were quantified by real-time PCR, detecting H. pylori-specific 16S ribosomal DNA. Mouse Gapdh was used as the internal control. (b) Paraffin-embedded sections of mouse stomachs from the 2-months group were stained to visualize H. pylori (red) and nuclei (blue). Fifty visual fields per group were randomly selected to count bacteria number. Scale bar: 40 µm. (c) Mouse gastric tissues from the 2-months group were harvested and weighed, and then homogenized in sterile PBS. Following serial dilution, samples plated on H. pylori-selective blood agar plates were incubated for 1 week to count colony number. (d–f) HFE145 cells were infected with H. pylori SS1 strain (MOI 100) and treated with 1,25D3 (200 nM, 72 h) as detailed in ‘Materials and Methods’ (n = 3). (d) Intracellular H. pylori DNA levels were measured by real-time PCR, detecting H. pylori-specific 16S ribosomal DNA. Gapdh was used as the internal control. (e) Cells were stained to visualize H. pylori (red). Thirty visual fields from each group were randomly selected to count bacteria number. Scale bar: 20 µm. (f) Cells were permeabilized with 0.5% saponin for 15 min at room temperature, then plated on blood agar plates with serial dilutions, and cultured for 1 week to count colony number. All the quantitative data are presented as means ± S.E.M. *P < 0.05; **P < 0.01; ***P < 0.001.
Anti-H. pylori activity of VD3 was mediated through enhancement of lysosomal degradation but was independent of cathelicidin expression
CAMP/LL-37 (cathelicidin antimicrobial peptide) is induced by VD3, which is also a critical mediator for autophagy induction in VD3-treated macrophages [Citation16]. Previously, we demonstrated that mouse CAMP/Cramp protected against H. pylori colonization and the associated gastritis in mouse stomachs [Citation17,Citation18]. We questioned whether CAMP expression was required for the antimicrobial action of VD3 on H. pylori infection in human macrophages and human gastric epithelial cells. We observed that 1,25D3 significantly increased human CAMP mRNA expression () and further accelerated the anti-H. pylori action in human macrophages (Figure S1(a)). However, a parallel action was not observed in 2 other human normal gastric epithelial cell lines, HFE145 and GES-1 (). In addition, mouse studies revealed that administration of VD3 for 2 months did not increase Camp mRNA levels in mouse stomach tissues (). To further ascertain whether the antimicrobial action of VD3 is independent of CAMP in gastric epithelial cells, small interfering RNA (siRNA) or small hairpin RNA (shRNA) was used to knock down CAMP mRNA expression in HFE145 () or THP-1 cells (Figure S1(b)). As shown in ), unlike human macrophages (Figure S1(c)), knockdown of CAMP expression did not abolish the antibacterial actions of 1,25D3 in HFE145 cells. Thus, these findings demonstrate that the antimicrobial action of VD3 on H. pylori is not mediated by CAMP in human gastric epithelial cells.
Figure 2. Anti-H. pylori activities of VD3 were not mediated by CAMP expression. (a) HFE145, GES-1 and THP-1 cells treated with 1,25D3 (200 nM) for the indicated time were analyzed for CAMP mRNA level. (b) C57BL/6 mice (n = 8 per group) were infected with the H. pylori SS1 strain for 1 month, and then administered with or without VD3 (1000 IU/kg, ig.) every other day for another 2 months. Mouse gastric tissues were harvested to examine the Camp mRNA level. (c,e) HFE145 cells were transfected with CAMP-specific siRNA or shRNA for 24 h. Cells were harvested to examine the CAMP mRNA level, in order to assess the knockdown efficiency. (d,f) HFE145 cells transfected with CAMP-specific siRNA or shRNA were infected with H. pylori SS1 strain (MOI 100), and then treated with or without 1,25D3 (200 nM, 72 h). Intracellular H. pylori DNA levels were measured by real-time PCR. GAPDH was used as the internal control. All the quantitative data were presented as means ± S.E.M. from three independent experiments. **P < 0.01; ***P < 0.001.
We then sought to determine the participation of autophagy in the H. pylori eradication processes. MAP1LC3B/LC3B and SQSTM1 are well-established autophagy markers. The conversion of LC3B-I to the lipidated form LC3B-II is considered one of the hallmarks of autophagosome formation, whereas SQSTM1 degradation indicates a dynamic autophagic flux [Citation19]. CTSD (cathepsin D) is a principal lysosomal aspartate protease, which is responsible for long-lived protein degradation. CTSD protein conversion from its inactive precursor to mature form is considered one of the hallmarks of lysosomal maturation and degradative function [Citation20]. As shown in , we observed concomitantly reduced LC3B-II and SQSTM1 proteins levels in 1,25D3-challenged cells, suggesting that 1,25D3 treatment alone enhanced lysosomal degradation function rather than affecting autophagosome formation in HFE145 cells. However, H. pylori infection led to accumulation of both LC3B-II and SQSTM1 proteins, suggesting a blockade of autolysosomal degradation function. Notably, we observed that LC3B-II and SQSTM1 protein levels were lowered by 1,25D3 treatment in H. pylori-infected HFE145 cells, suggesting 1,25D3 could rectify the impaired lysosomal degradation function. Moreover, H. pylori infection caused a stagnant conversion of the CTSD protein from its precursor into the mature form, and it was also reversed after 1,25D3 co-incubation (). Therefore, these results demonstrated for the first time that the disrupted autolysosomal degradation function induced by H. pylori infection could be restored after 1,25D3 treatment. This conclusion was further supported by the results obtained from mouse stomach tissues () and THP-1 cells (Figure S1(d)).
Figure 3. Anti-H. pylori activities of VD3 were mediated through enhancement of lysosomal degradation. (a) HFE145 cells were infected with H. pylori SS1 strain (MOI 100) and treated with 1,25D3 (200 nM, 72 h). Whole-cell lysates were examined for LC3B, SQSTM1 and CTSD protein levels. LC3B-II:LC3B-I ratio, pre-CTSD:mature-CTSD ratio and SQSTM1 protein levels were quantified. (b) C57BL/6 mice (n = 8 per group) were infected with the H. pylori SS1 strain for 1 month, and then administered with or without vitamin D3 (1000 IU/kg, intragavage) every other day for another 2 months. Stomach tissues from 3 mice from each group were randomly selected to analyze for LC3B, SQSTM1 and CTSD protein levels. LC3B-II:LC3B-I ratio, pre-CTSD:mature-CTSD ratio and SQSTM1 protein levels were quantified. (c) HFE145 cells infected with the H. pylori SS1 strain (MOI 100) were treated with 1,25D3 (200 nM) and/or Baf A1 (100 μM) for 72 h. Cell lysates were analyzed for LC3B and SQSTM1 protein levels. LC3B-II:LC3B-I ratio and SQSTM1 protein levels were quantified. (d,e) HFE145 cells were infected with or without H. pylori SS1 strain (MOI 100), and then treated with 1,25D3 (200 nM, 72 h). (d) Cells were stained with LysoTracker Red (100 nM, 30 min) to assess lysosomal activities (n = 3). Scale bar: 20 µm. (e) Whole-cell lysates from each group were examined for CTSD activity. (f) C57BL/6 mice (n = 8 per group) were infected with the H. pylori SS1 strain for 1 month, and then administered with or without VD3 (1000 IU/kg, intragavage) every other day for another 2 months. Mouse gastric tissues were harvested to examine CTSD activity. (g,h) Lysosome fractions were enriched. ACP2 (g) and NAGLU (h) activities were determined using the appropriate commercial kits. (i) HFE145 cells infected with the H. pylori SS1 strain (MOI 100) were treated with 1,25D3 (200 nM) and/or CQ (10 μM) for 72 h. Intracellular H. pylori DNA levels were measured by real-time PCR. GAPDH was used as the internal control. All the quantitative data are presented as means ± S.E.M. from 3 independent experiments. **P < 0.01; ***P < 0.001.
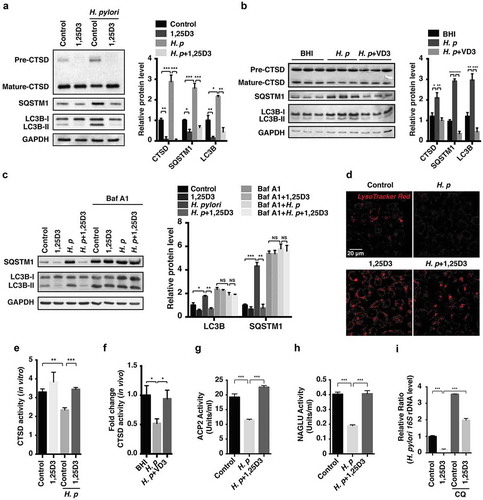
To verify that the boosted autolysosomal degradation is due to an increased autophagic flux, we first sought to exclude the possibility that H. pylori infection caused a disrupted autophagosome-lysosome fusion by visualizing the colocalization of LAMP1 (lysosomal associated membrane protein 1) and LC3B. In contrast to cells incubated with chloroquine (CQ, an inhibitor of lysosomal hydrolases, autophagosome-lysosome fusion, and lysosomal degradation), the colocalization efficient of LAMP1 and LC3B was not inhibited in H. pylori-infected HFE145 cells with or without 1,25D3 treatment (Figure S2). Moreover, cells infected with H. pylori with or without 1,25D3 treatment were exposed to bafilomycin A1 (Baf A1, a selective inhibitor of the vacuolar-type H+-ATPase that prevents lysosomal acidification). The autophagic flux assay showed that H. pylori did not further increase LC3B-II and SQSTM1 protein levels upon treatment with Baf A1 (), which is consistent with our previous work [Citation15], validating that bacterial infection caused an impairment of autolysosomal degradation function. Importantly, we did not observe decreased LC3-II and SQSTM1 protein levels in cells infected with H. pylori after treatment with 1,25D3 in the presence of Baf A1 as compared to H. pylori-infected cells treated with Baf A1 alone (), confirming that 1,25D3 treatment led to an enhanced autolysosomal degradation function rather than reducing autophagosome formation.
An increased transformation of CTSD protein from its precursor to the mature form was found in 1,25D3-treated HFE145 cells (), suggesting lysosomal activity was upregulated by 1,25D3 treatment. To further verify it, LysoTracker Red was applied to trace and label acidic organelles. As revealed in ), incubation with H. pylori significantly reduced the uptake of LysoTracker Red into lysosomes, whereas it was reversed after 1,25D3 treatment, corroborating the idea that 1,25D3 could enhance lysosomal activity, which was further supported by a CTSD activity assay (). Next, lysosomal fractions were enriched and the activities of 2 classical lysosomal enzymes, namely ACP2 (acid phosphatase 2, lysosomal) and NAGLU/β-N-acetylglucosaminidase, were measured. In line with the previous results, both enzymes activities were decreased in H. pylori-infected cells, whereas a normalized action was observed after treatment with 1,25D3 (). Importantly, co-incubation with CQ strongly counteracted the antimicrobial action of 1,25D3 (). Taken together, these results demonstrate that the antibacterial impact of VD3 on H. pylori relies on the enhancement of lysosomal degradation function in gastric epithelial cells.
Autophagosomes were subverted by H. pylori as survival niches in human stomachs
H. pylori was originally considered a non-invasive pathogen adhering to the gastric epithelium surface [Citation21]. However, growing evidence indicates that pathogen invasion into cells occurs during H. pylori infection [Citation3–Citation5,Citation22]. To investigate whether bacteria can invade into human gastric epithelium, biopsies from patients chronically infected with H. pylori were assessed. As shown in , compared to a dispersive distribution of LC3B protein in H. pylori-negative samples, we observed massive LC3B-positive dots in H. pylori-positive biopsies, a hallmark of autophagosome formation, which is consistent with previous data [Citation11]. Importantly, a fair number of H. pylori were found to be colocalized with LC3B (yellow puncta), suggesting that bacteria were sequestered inside autophagosomes. Moreover, transmission electron microscopy analysis of H. pylori-positive human biopsies show onion-like (autophagosome-like) structures containing intact bacteria [Citation16], as well as autolysosomes enclosing degraded materials (), resembling the findings reported by Y Liu et al [Citation23]. To further determine whether engulfed H. pylori might survive in non-digestive autophagosomes, siRNAs were applied to specifically knock down ATG5 (autophagy related 5) or BECN1 (beclin 1), proteins indispensable for autophagosome formation (). Consistent with our previous study [Citation15], we found an accelerated bacterial clearance effect after ATG5 or BECN1 expression was silenced (). Additionally, as compared to cells infected with H. pylori for 48 h, we observed a subtle but significant increase in H. pylori number after bacterial infection for 72 h (), corroborating the idea that H. pylori could survive and replicate modestly in non-degradative autophagosomes [Citation5].
Figure 4. Autophagosomes were taken by H. pylori as survival niches in human stomachs. (a) H. pylori-negative (n = 7) and -positive (n = 12) human patient biopsies were stained to visualize LC3B (green), H. pylori (red) and nuclei (blue). Thirty visual fields per group were randomly selected. Colocalization coefficient was presented as the percentage of punctate signals of LC3B that were positive for H. pylori. Scale bar: 50 µm. Reported values are the means ± S.E.M. *p < 0.05. (b) Ultrastructural features of H. pylori-negative (n = 5) and -positive (n = 12) human patient biopsies were analyzed by transmission electron microscopy. Scale bar: 2 µm. (Left panel) The typical images of mitochondria, autophagosomes (AP, arrow) enclosing intact H. pylori and autolysosomes (AL, arrowhead) are shown at higher magnification. (Right panel) Fifteen consecutive cross-sections from each patient were selected to count the number of autophagosomes and autolysosomes. (c–d) HFE145 cells transfected with control, ATG5- or BECN1-specific siRNAs were infected with the H. pylori SS1 strain (MOI 100) for the indicated times. (c) Cell lysates were analyzed and quantified for ATG5 and BECN1 protein levels. (d) Cells were permeabilized with 0.5% saponin for 15 min at room temperature, then plated on blood agar plates with serial dilutions, and cultured for 1 week to count colony number. The quantitative data are presented as means ± S.E.M. *P < 0.05; **P < 0.01; ***P < 0.001.
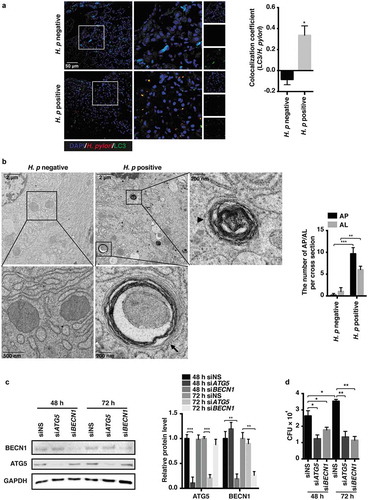
Thus, these observations revealed a likely neglected phenomenon of H. pylori invasion into human gastric epithelium, as such loss of degradation function of autolysosomes might be the niche for bacteria to survive in the gastric mucosa.
VD3 enhanced lysosomal degradation function via ca2+-dependent lysosomal acidification
Lysosome function relies on an acidic environment in the lumen to execute digestive functions, and to recycle the degraded cargos [Citation24]. To investigate whether restored lysosomal function by VD3 is mediated by enhanced lysosomal acidification, acridine orange staining was used. Consistent with our postulation, we found a compromised lysosomal acidification in H. pylori-infected cells as well as cells exposed to Baf A1 (). However, cells incubated with 1,25D3 regardless of the presence of H. pylori infection showed a normal acidification level (), suggesting that the disrupted lysosomal acidification was recovered by 1,25D3 incubation in H. pylori-infected cells. Lysosomal acidification was further determined by the expression of GFP-mCherry-LC3 fusion protein in HFE145 cells. When fused to LC3, GFP and mCherry both fluoresce under a neutral pH environment. However, in an acidic pH condition, the GFP fluorescence signal is quenched, while the mCherry signal still remains stable [Citation25]. Using this approach, we observed a retained GFP fluorescence colocalized with mCherry signals in H. pylori-infected and Baf A1-treated cells (yellow puncta) (), confirming an impaired acidification action did occur. On the contrary, in 1,25D3-treated HFE145 cells, most of the LC3B-positive autophagic puncta lost the GFP signal but retained the mCherry signal, indicating unimpeded autolysosomal degradation (). To further examine the effect of VD3 on lysosomal acidification, lysosomal pH was assessed by LysoSensor Yellow/Blue DND-160 assay [Citation26]. Consistently, we observed an elevated lysosomal pH in H. pylori-infected cells, whereas it was reduced back to normal when treated with 1,25D3 (). We next determined whether restoration of lysosomal acidification could exert a prominent role in 1,25D3-induced H. pylori clearance. Concanamycin A (Con A, a more powerful V-ATPase inhibitor than Baf A1) [Citation27], was applied to pharmacologically block the acidification in the lysosomal lumen. In this regard, Con A remarkably counteracted the anti-H. pylori effect induced by 1,25D3 in HFE145 cells (), supporting the critical role of lysosomal acidification in the antimicrobial actions induced by 1,25D3.
Figure 5. VD3 enhanced lysosomal degradation function via Ca2+-dependent lysosomal acidification. (a–c) HFE145 cells infected with the H. pylori SS1 strain (MOI 100) were treated with or without 1,25D3 (200 nM, 72 h). Cells were labelled with acridine orange (1 μM, 15 min) (n = 3), scale bar: 100 µm (a) or expressed GFP-mCherry-LC3 fusion protein (n = 3), scale bar: 20 µm (b). Baf A1 (100 μM, 24 h) was used as a positive control. (c) Lysosomal pH values were measured ratiometrically using LysoSensor Yellow/Blue DND-160. (d) HFE145 cells infected with the H. pylori SS1 strain (MOI 100) were treated with 1,25D3 (200 nM) and/or Con A (50 nM) for 72 h. Intracellular H. pylori DNA levels were measured by real-time PCR. (e) HFE145 cells infected with the H. pylori SS1 strain (MOI 100) were treated with or without 1,25D3 (200 nM, 72 h). Cells loaded with Fura-2 AM (3 μM, 30 min) were treated with GPN (200 μM) or DMSO. Calcium release from lysosomes was measured indirectly by assessing the cytoplasmic calcium levels (n = 3). (f) HFE145 cells infected with the H. pylori SS1 strain (MOI 100) were treated with or without 1,25D3 (200 nM, 72 h). MCOLN3 protein levels were analyzed and quantified. (g,h) HFE145 cells transfected with control or MCOLN3-specific siRNA were infected with the H. pylori SS1 strain (MOI 100), then treated with or without 1,25D3 (200 nM, 72 h). (g) Intracellular H. pylori DNA levels were measured by real-time PCR. (h) Cells were stained to visualize H. pylori (red). Thirty visual fields from each group were randomly selected to count bacteria number. Scale bar: 40 µm. (i) HFE145 cells transfected with control or MCOLN3-specific siRNA were loaded with Fura-2 AM (3 μM, 30 min), and then treated with GPN (200 μM). Calcium release from lysosomes was measured indirectly by assessing the cytoplasmic calcium levels (n = 3). All the quantitative data are presented as means ± S.E.M. from 3 independent experiments. **P < 0.01; ***P < 0.001.
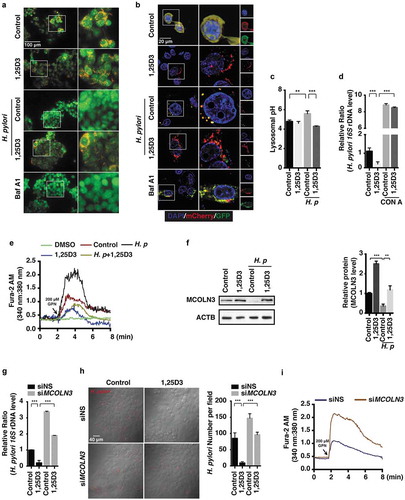
Ca2+ release from endosomes is associated with lysosomal acidification. It is thought that Ca2+ homeostasis is essential for acidification to occur in endosomes, as H+ uptake into endosomes via a vacuolar proton pump should be balanced by Ca2+ outflow through Ca2+ channels in early and late endosomes [Citation28]. To examine whether restored acidification in the lysosomal lumen by VD3 is due to an enhanced Ca2+ release from lysosomes, cells were loaded with Fura-2 AM, then treated with Gly-Phe-β-naphthylamide (GPN, hydrolyzed by CTSC leading to a loss of lysosome membrane integrity) or DMSO (the solvent of GPN, acting as a negative control). We observed a remarkably increased Ca2+ release in H. pylori-infected HFE145 cells as compared to cells without infection (), indicating an abnormal Ca2+ accumulation in lysosomes after H. pylori infection. On the contrary, cells treated with 1,25D3 regardless of the presence of H. pylori infection showed a reduced Ca2+ outflow (). To rule out a contribution from ER-related Ca2+ storage, cells infected with or without H. pylori were exposed to thapsigargin (TG, an inhibitor of the sarco/endoplasmic reticulum Ca2+-ATPase [SERCA] for depleting the endoplasmic reticulum [ER] Ca2+ store) [Citation29], and no difference in Ca2+ release from the ER was found between control and H. pylori-infected cells (Figure S3(a)). Thus, these findings support the notion that H. pylori infection led to a perturbation of Ca2+ release from lysosomes, resulting in a disrupted lysosomal acidification, whereas these effects were reversed by 1,25D3 treatment.
Next, we sought to identify the associated Ca2+ channels, which are responsible for the functional acidic environment in the lysosomal lumen. MCOLNs (mucolipins), a subfamily of transient receptor potential channels, are predicted to encode Ca2+ channels that predominantly function in endolysosomal vesicles [Citation30]. Emerging evidence revealed that loss-of-function mutations of MCOLN members causes severe lysosomal storage diseases [Citation31], pointing out a prominent role of MCOLNs in lysosomal trafficking and biogenesis. We first focus on MCOLN1/TRPML1 (mucolipin 1), a membrane protein [Citation32]. However, we did not find any difference in MCOLN1 mRNA and protein levels with or without H. pylori infection (Figure S3(b,c)). Then, we sought to examine whether MCOLN3/TRPML3 (mucolipin 3) is implicated. Western blot analysis showed a downregulated MCOLN3 protein level in H. pylori-infected HFE145 cells, whereas cells treated with 1,25D3 showed a reinforced MCOLN3 protein level (). Notably, cells treated with 1,25D3 in the presence of H. pylori reversed the downregulated MCOLN3 protein expression as compared to H. pylori infection alone (), suggesting that 1,25D3 treatment normalized the MCOLN3 protein level. Additionally, we observed a weakened inhibitory effect on MCOLN3 protein level after cells were infected with the cytotoxin-associated gene A (CagA) knockout strain of H. pylori (Figure S3(d)), implying that CagA might be involved in the downregulation of MCOLN3 during H. pylori infection. To further assess the implication of MCOLN3 in 1,25D3-induced antibacterial action, we selectively reduced such protein by specific siRNA (Figure S3(e)). Knockdown of MCOLN3 strongly prevented the clearance action of 1,25D3 in H. pylori-infected HFE145 cells ()), whereas cells expressing MCOLN3 showed an enhanced H. pylori elimination function (Figure S3(f)). Moreover, we observed lysosomal Ca2+ accumulation after knockdown of MCOLN3 expression (), proving that such a channel is necessary for Ca2+ release from lysosomes. Additionally, cells exposed to ML-SA1 (an agonist of the MCOLN1 channel) after treatment with 1,25D3 revealed a depleted lysosomal Ca2+ accumulation (Figure S3(g)), confirming that 1,25D3 accelerated Ca2+ outflow from lysosomes.
Overall, these findings collectively indicate a critical role of the MCOLN3 channel in the process of lysosomal acidification and its involvement in the prevention of H. pylori infection, whereas 1,25D3 preserves the function of such a Ca2+ channel to recover the innate antimicrobial action of gastric epithelial cells.
PDIA3, not VDR, was necessary for the VD3-induced anti-H. pylori effect
VDR (vitamin D receptor) is a well-known receptor mediating most of the biological functions of VD3 [Citation33]. Considering the significant role of VDR in the pharmacological actions of VD3, we determined whether H. pylori clearance induced by VD3 is mediated by such a receptor. In this connection, we selectively reduced VDR mRNA expression by specific siRNA (Figure S4(a)). Surprisingly, there was no difference in H. pylori DNA levels between normal cells and cells with VDR silenced (Figure S4(b)). Likewise, knockdown of VDR mRNA by specific shRNAs (Figure S4(c)) still did not stop H. pylori clearance induced by 1,25D3 (Figure S4(d)), confirming that 1,25D3 induced H. pylori eradication in a VDR-independent manner. We next turned to another non-classical vitamin D receptor identified recently, namely PDIA3 [Citation34]. Unlike VDR that is conservatively activated by vitamin D, PDIA3 was characterized as a stress-responsive protein present in many subcellular locations, including the ER, plasma membrane and nucleus [Citation34]. An unexpected function of PDIA3 is the binding of 1,25D3 to rapidly initiate non-genomic responses [Citation35]. We then determined whether PDIA3 was involved in the antimicrobial action of 1,25D3. Although we did not observe an alteration in PDIA3 protein level in the absence or presence of 1,25D3 treatment (Figure S4(e)), its downstream target, PRKC (protein kinase C) activity [Citation34], was stimulated by 1,25D3 in a time-dependent manner (Figure S4(f)). Next, we introduced siRNA to selectively suppress PDIA3 expression (Figure S4(g,h)). Interestingly, silencing PDIA3 attenuated the anti-H. pylori action of 1,25D3 (), suggesting that PDIA3 is essential for the antibacterial action of 1,25D3. To further examine the impact of PDIA3 in the antimicrobial function of 1,25D3, we used the CRISPR-Cas9 system to completely delete PDIA3 protein expression (Figure S4(i)), because the silencing efficiency of PDIA3 siRNA was not that desirable (Figure S4(g,h), ~50%). As expected, knockout of PDIA3 strongly prevented the eradication capability of 1,25D3 in HFE145 cells (). Of importance, this preventive effect was more powerful than PDIA3 siRNA. Thus, we can conclude that PDIA3 has a prominent function in the antibacterial activity of 1,25D3.
Figure 6. The PDIA3-MCOLN3 axis was necessary for the VD3-induced anti-H. pylori effect. (a,b) HFE145 cells transfected with control or PDIA3-specific siRNA were infected with the H. pylori SS1 strain (MOI 100), and then treated with or without 1,25D3 (200 nM, 72 h). (a) Intracellular H. pylori DNA levels were measured by real-time PCR. (b) Cells were stained to visualize H. pylori (red). Thirty visual fields from each group were randomly selected to count bacteria number. Scale bar: 40 µm. (c,d) HFE145 cells transduced with PDIA3-targeting lentiCRISPR plasmids were infected with the H. pylori SS1 strain (MOI 100), and then treated with or without 1,25D3 (200 nM, 72 h). (c) Intracellular H. pylori DNA level was measured by real-time PCR. (d) Cells were stained to visualize H. pylori (red). Thirty visual fields from each group were randomly selected to count bacteria number. Scale bar: 40 µm. (e) HFE145 cells transduced with PDIA3-targeting lentiCRISPR plasmids were treated with or without 1,25D3 (200 nM, 72 h). Cell lysates were analyzed for PDIA3 and MCOLN3 protein levels. MCOLN3 proteins were quantified. (f) HFE145 cells transduced with PDIA3-targeting lentiCRISPR plasmids were loaded with Fura-2 AM (3 μM, 30 min), and then treated with GPN (200 μM). Calcium release from lysosomes was measured indirectly by assessing the cytoplasmic calcium levels (n = 3). (g–j) HFE145 cells were transfected with control, PDIA3- or MCOLN3-specific siRNA or transduced with PDIA3-targeting lentiCRISPR plasmids. (g) Lysosomal pH values were measured ratiometrically using LysoSensor Yellow/Blue DND-160. (h,i) Lysosome fractions were enriched to determine the activities of ACP2 (h) and NAGLU (i). (j) Whole-cell lysates were collected to examine PDIA3, MCOLN3, LC3B, SQSTM1 and CTSD protein levels by western blots, LC3B-II:LC3B-I ratio, SQSTM1 and CTSD proteins were quantified. All the quantitative data are presented as means ± S.E.M. from 3 independent experiments. *P < 0.05; **P < 0.01; ***P < 0.001.
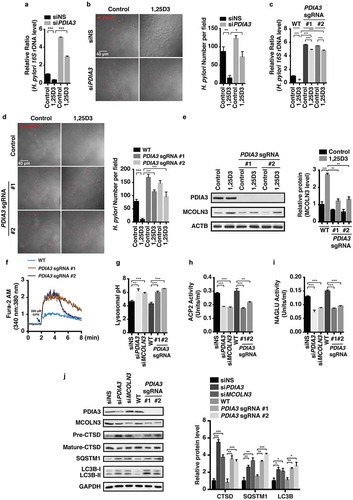
Considering that most cellular responses modulated by VD3 through the PDIA3 receptor are linked to Ca2+ uptake in mammalian cells [Citation35], we next sought to examine whether the MCOLN3 channel is regulated by PDIA3. Interestingly, CRISPR-Cas9-based knockout of PDIA3 protein expression led to a declined MCOLN3 protein level after cells were treated with or without 1,25D3 (), indicating that the MCOLN3 channel is modulated by PDIA3 in HFE145 cells. Furthermore, we observed an enhanced Ca2+ outflow from lysosomes after genetic ablation of PDIA3 (). An elevated lysosomal pH (), reduced ACP2 () and NAGLU activities () were also observed after cells were silenced with PDIA3 or MCOLN3 siRNA or genetic depletion of PDIA3. In line with these findings, a concordant downregulation of mature CTSD, and upregulation of SQSTM1 and LC3B-II protein expression was observed in cells after knocking down PDIA3 and MCOLN3 or knocking out PDIA3 (), indicating that a repressed protein level of PDIA3 and MCOLN3 could result in an impaired autolysosomal degradation function. To further confirm whether blocking MCOLN3 activity can perturb the autolysosomal degradation function, cells silenced with MCOLN3 siRNA were incubated with Baf A1. As revealed in Figure S4(j), knockdown of MCOLN3 induced LC3B-II and SQSTM1 protein accumulation, which was nullified in the presence of Baf A1, verifying that the MCOLN3 channel was critical for maintenance of autolysosomal degradation function. Taken together, these findings demonstrate that 1,25D3 restored the impaired autolysosomal degradation function by H. pylori via the PDIA3-MCOLN3 axis-dependent Ca2+ pathway in gastric epithelial cells ().
Figure 7. Nuclear translocation of the PDIA3-STAT3 protein complex modulated MCOLN3 expression. (a) HFE145 cells were analyzed for protein levels as indicated by immunoprecipitation (IP) or western blots. Ten percent of the lysate used for the IP was loaded as input (n = 3). (b,c) HFE145 cells were incubated with 1,25D3 (200 nM) for 12 h. (b) Protein levels of PDIA3 and STAT3 in the cytosolic and nuclear extracts were determined and quantified. ACTB and LMNB1 were used as loading controls for the cytosolic and nuclear fractions, respectively. (c) STAT3 binding to the MCOLN3 promoter was analyzed by ChIP-PCR. Normal IgG was used as an internal control. (d) HFE145 cells transfected with control or STAT3-specific siRNA were incubated with 1,25D3 (200 nM, 48 h). Cell lysates were examined for STAT3 and MCOLN3 protein levels. MCOLN3 proteins were quantified. All the quantitative data are presented as means ± S.E.M. from 3 independent experiments. *P < 0.05; **P < 0.01; ***P < 0.001.
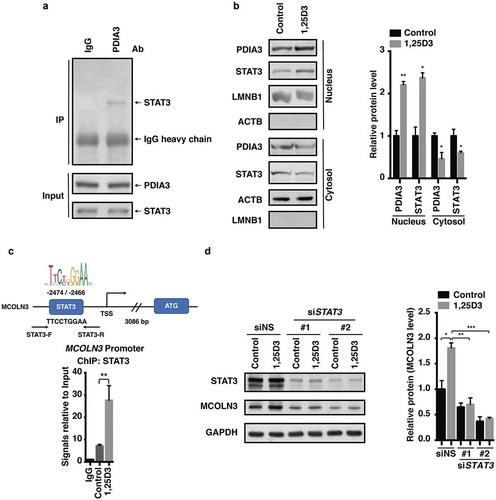
Figure 8. Antibiotic-resistant H. pylori strains were efficiently cleared by 1,25D3 at a physiological concentration. (a–i) HFE145 cells were infected with the H. pylori SS1, 10996 and 10945 strains (MOI 100) and treated with 1,25D3 (200 nM, 72 h). (a,d,g) Intracellular H. pylori DNA levels were measured by real-time PCR, detecting H. pylori-specific 16S ribosomal DNA. GAPDH was used as the internal control. (b,e,h) Cells were stained to visualize H. pylori (red). Thirty visual fields from each group were randomly selected to count bacteria number. Scale bar: 20 µm. (c,f,i) Cells were permeabilized with 0.5% saponin for 15 min at room temperature, and then plated on blood agar plates with serial dilution, and cultured for 1 week to count colony number. All the quantitative data are presented as means ± S.E.M. from 3 individual experiments. **P < 0.01; ***P < 0.001.
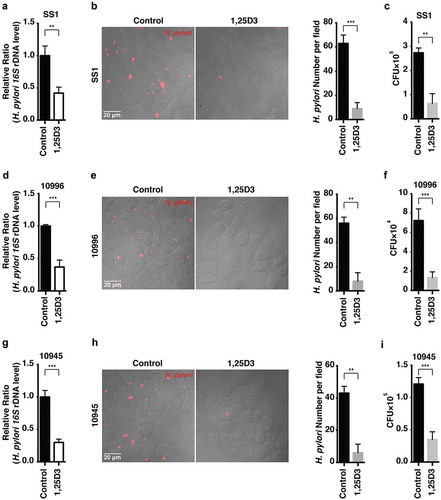
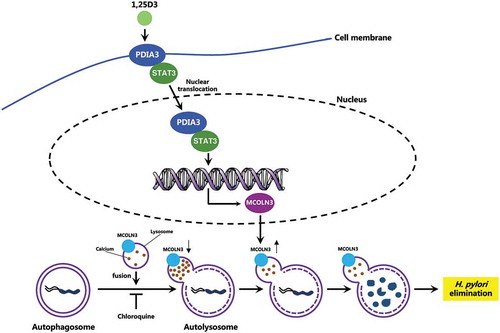
Figure 9. Schematic diagram depicting the proposed mechanism by which VD3 exerts anti-H. pylori effects. Autophagosomes enclosing H. pylori fuse with lysosomes to form autolysosomes. H. pylori infection leads to a downregulated MCOLN3 protein level, resulting in an abnormal Ca2+ accumulation in lysosomes, and impaired lysosomal acidification. VD3 treatment activates the membrane receptor PDIA3, and drives the PDIA3-STAT3 complex to redistribute into the nucleus, causing an upregulated MCOLN3 protein expression, thereby recovering the Ca2+ release from lysosomes and subsequent lysosomal acidification. As a consequence, H. pylori is eliminated by the restored autolysosomal pathway.
Nuclear translocation of the PDIA3-STAT3 protein complex modulated MCOLN3 expression
We next investigated how MCOLN3 is modulated by the PDIA3 receptor. STAT3 is a transcriptional factor that relays a signal from activated cytokine and growth factor receptors in the plasma membrane to the nucleus, where it regulates gene transcription [Citation36]. To determine whether STAT3 is involved in the 1,25D3-evoked MCOLN3 protein expression, we first demonstrated that PDIA3 could bind STAT3 directly in HFE145 cells (). Importantly, cells exposed to 1,25D3 showed nuclear translocation of PDIA3 and STAT3 proteins (). Next, using a chromatin immunoprecipitation-polymerase chain reaction (ChIP-PCR) assay, we found that STAT3 could directly bind to the MCOLN3 promoter after cells were treated with 1,25D3 (), suggesting that MCOLN3 was transcriptionally regulated by STAT3 in 1,25D3-treated HFE145 cells. The functional role of STAT3 was further validated as knockdown of STAT3 with siRNA abolished the upregulation of MCOLN3 by 1,25D3 (). Therefore, our findings demonstrated that 1,25D3 drove the redistribution of the PDIA3-STAT3 protein complex into the nucleus, leading to an upregulation of MCOLN3 protein expression in a promoter-specific manner in HFE145 cells ().
Antibiotic-resistant H. pylori strains were efficiently cleared by 1,25D3 at a physiological concentration
To further determine whether the antimicrobial effects of 1,25D3 occurred at physiological level in HFE145 cells, cells with H. pylori infection were exposed to a physiological concentration (200 pM) of 1,25D3 [Citation37], and subjected to real-time PCR analysis to measure the intracellular H. pylori DNA level after treatment. Notably, 1,25D3 at this concentration showed a similar anti-H. pylori effect as compared to cells treated with 200 nM (), ~42% survival versus ~28% survival, respectively after treatment with 200 pM and 200 nM 1,25D3, respectively), which were further evidenced by the immunostaining () and quantitative culture ().
Antibiotic resistance in H. pylori becomes increasingly common nowadays, leading to a progressively reduced efficacy of the recommended triple therapy [Citation38]. In order to assess whether 1,25D3 still remains effective to those antibiotic-resistant H. pylori strains, 2 clinical isolates (10996 and 10945) were selected in the current study. Both strains were identified to be resistant to clarithromycin, levofloxacin and tetracycline. HFE145 cells infected with these 2 strains were treated with 1,25D3 at 200 pM and then examined for its antibacterial activity. Results from real-time PCR, immunostaining and quantitative culture all showed promising antimicrobial activities by 1,25D3 at this physiological concentration (). These data collectively indicated that the active form of VD3 plays an important role in the innate defensive response against bacterial infection by H. pylori in both normal and drug-resistant strains in gastric epithelial cells.
Discussion
H. pylori is one of the most common human pathogenic bacteria. About one fifth of the world population colonized with this pathogen manifests severe gastric disorders, including gastritis and gastric malignancy [Citation1]. The inappropriate use of antibiotics causes an increased antibiotic resistance, making it worse in drug treatment. H. pylori was previously regarded as an extracellular microbe, whereas its facultative intracellular nature is becoming increasingly acknowledged by researchers, as growing evidence indicates an invasion into epithelial cells and phagocytes occurs during H. pylori colonization [Citation3–Citation5,Citation22]. Yet, it still remains to be elucidated regarding how H. pylori survives within cells. In this study, we verified an occurrence of intracellular H. pylori in human normal gastric epithelial HFE145 cells, and, more important, in human stomachs. Moreover, we observed that the pathogens were sequestered and survived in non-digestive autophagosomes. It is generally accepted that the aroused autophagic responses are triggered by H. pylori virulence factor VacA [Citation11,Citation12]. However, in the present study, we chose the H. pylori SS1 strain, in order to establish a bacterial infection mouse model, although this strain was reported to express a non-functional VacA protein (s2/m2 type) [Citation39]. Thus, our findings imply a possible contribution of other factors expressed by H. pylori on the altered autophagic responses. Indeed, we observed a weakened inhibitory effect on autophagosome maturation using another H. pylori strain TN2GF4 (VacA s1/m1 type) after depletion of CagA expression (data not shown), suggesting that CagA is also involved in induction of autophagosome formation. However, it remains to be further investigated as to the detailed mechanisms of CagA and other cytotoxins in stimulating autophagosome formation and at the same time impairing autolysosome maturation.
Our present study also demonstrated that the loss-of-function autolysosome is due to an impaired lysosomal acidification caused by H. pylori infection. Furthermore, we showed the involvement of H. pylori virulence factor CagA in inhibition of the Ca2+ channel MCOLN3 protein. Consistently, a previous research revealed an increased pH at the late endosomal pathway in cells depleted of MCOLN3 [Citation40]. Thus, the current results might explain the inefficiency in H. pylori clearance after treatment with some membrane-impermeable antibiotics. The survival of bacteria in disarmed autophagosomes might be a significant reason for H. pylori to persist and recur in host stomachs.
The antimicrobial activities of VD3 have aroused increasing attention nowadays. An impressive antimicrobial spectrum of VD3 against HIV, Mycobacterium tuberculosis and Staphylococcus aureus was reported [Citation41]. It is suggested that the antimicrobial action induced by VD3 is derived from the aroused innate immune response, which plays a prominent role in defending against pathogen invasion [Citation42]. Researchers further revealed that the antimicrobial action is mainly mediated via the production of antimicrobial peptides such as CAMP (cathelicidin antimicrobial peptide) and DEFB4A/β-defensin 2 [Citation43]. In the present study, we failed to prove that CAMP is responsible for the anti-H. pylori actions induced by VD3 in HFE145 cells and in mouse stomachs. Early evidence showed that CAMP is a direct target gene of VDR [Citation44], whereas we detected a relatively low VDR expression in gastric epithelial cells and mouse stomach tissues as compared to human immunocytes and cancer cells in response to VD3 treatment [Citation45]. This may partially explain why CAMP is not implicated in VD3-induced H. pylori elimination in HFE145 cells. In contrast to the inductive role in innate immune response, accumulating studies showed a suppressive function of VD3 on the adaptive immune response, including disruption of T-cell proliferation as well as the development of immunoglobulin (Ig)-secreting B cells [Citation42,Citation46,Citation47], suggesting that it is unlikely for VD3 to mediate its antibacterial activities through the adaptive immune response.
In the current study, we proved that the antimicrobial effect is mediated through the PDIA3 receptor but not VDR, as evidenced by the PDIA3 knockdown and knockout model in HFE145 cells. PDIA3 was initially identified as a chaperone of the endoplasmic reticulum [Citation48]. Now, it is accepted that PDIA3 also acts as a membrane receptor for 1,25D3 to initiate membrane-related cascade reactions, including Ca2+ and phosphate uptake [Citation34,Citation35]. Unlike VDR uniquely bound to 1,25D3, recent research showed that PDIA3 can also be stimulated by an Alzheimer disease-related chemical [Citation49], suggesting the implication of PDIA3 in Alzheimer therapy. We further observed that 1,25D3 initiated nuclear translocation of the PDIA3-STAT3 complex, and the subsequent transcriptional upregulation of the MCOLN3 channel plays a pivotal role in VD3-induced antimicrobial effect (). The MCOLN3 channel is predominantly expressed on late endosomal and lysosomal membranes (>75%) [Citation30]. Ca2+ release from endolysosomes via the MCOLN3 channel is necessary for lysosomal acidification and maturation [Citation30,Citation31]. Mutations in MCOLN3 lead to severe lysosomal storage diseases [Citation50]. Our results showed a modulatory role of the PDIA3-STAT3 complex in MCOLN3 expression. A previous study indicated that mitochondrial Ca2+ uptake could be also regulated by PDIA3 through MCU (mitochondrial calcium uniporter) [Citation51], suggesting a comprehensive function of PDIA3 in modulating cellular Ca2+ signaling. Moreover, we observed that an upregulation of the MCOLN3 channel induced by VD3 is required for Ca2+ release from lysosomes, and then consequently normalized lysosomal acidification. A highly acidic environment (pH < 5.0) in its lumen is extremely important for the lysosome to execute its digestive action and to export the recycled cargos. The hydrolytic enzymes within lysosomes are also activated in an acidic pH condition [Citation50]. In this research, a recovered lysosomal acidic environment, which was impaired by H. pylori infection, was observed in VD3-treated cells, resulting from the enhanced Ca2+ release from lysosomes. The repaired digestive environment drives bacteria to degradation through an autolysosomal pathway. The current observations strongly substantiate the restored autolysosomal degradation function in VD3-treated cells and in mouse models. These include: (a) reduced SQSTM1 and LC3B-II protein levels; (b) increased CTSD activities; (c) enhanced uptake of LysoTracker Red into lysosomes; and (d) recovered ACP2 and NAGLU activities in lysosomes.
Vitamin D deficiency is now recognized to be linked to many severe health outcomes. Researchers are realizing an epidemic of vitamin D deficiency exists in many parts of the world [Citation52]. Although reasons for the prevalence of vitamin D deficiency worldwide still remain controversial, it is highly likely that the widespread deficiency contributes to a serious public health issue by increasing the risk for several adverse disorders. Our studies uncovered a promising antimicrobial effect of VD3 against H. pylori at either a pharmacological or a physiological concentration, and further against 2 antibiotic-resistant strains, indicating that VD3 has a great potential to be a therapeutic supplement in antibiotic-resistant H. pylori treatment. However, it still remains to be investigated whether vitamin D deficiency is associated with the incapability of our innate immune system to eliminate H. pylori and whether dietary supplement would favor pathogen clearance in humans.
In summary, our study identifies a pathogenic mechanism on how H. pylori can survive by hiding inside the autophagosomes in cells, and a novel signaling pathway of VD3 through the activation of the PDIA3-STAT3-MCOLN3-Ca2+ axis to reactivate the lysosomal acidification and degradation function of autolysosomes (), which is the key signal pathway for the antibacterial action of VD3 both in cells and in animals, and perhaps further in humans. Further elucidation of these mechanisms of action would provide new therapeutic strategies and targets and thereby new therapeutic agents for H. pylori treatment in the future.
Materials and methods
Reagents, antibodies and commercial kits
Primary antibodies we used were anti-LC3B (Novus Biologicals, NB100-2220), anti-LC3B (Cell Signaling Technology, 3868S), anti-SQSTM1 (BD Biosciences, 610832), anti-CTSD (Santa Cruz Biotechnology, SC-6487), anti-MCOLN3 (Sigma-Aldrich, M7570), anti-H. pylori (Abcam, ab7788), anti-PDIA3 (Abcam, ab13506), anti-ACTB (Cell Signaling Technology, 4967S), anti-ATG5 (Cell Signaling Technology, 12994S), anti-BECN1 (Cell Signaling Technology, 3495S), anti-LAMP1 (Cell Signaling Technology, 9091S), anti-STAT3 (Cell Signaling Technology, 9139S), anti-MCOLN1 (Novus Biologicals, NB110-82375), anti-GAPDH (Santa Cruz Biotechnology, SC-365062), anti-LMNB1 (Santa Cruz Biotechnology, SC-374015). Secondary antibodies used included anti-mouse conjugated to horseradish peroxidase (Sigma-Aldrich, A2304) and anti-rabbit conjugated to horseradish peroxidase (GE Healthcare, NA9340) for western blot; anti-rabbit conjugated to Alexa Fluor 568 (A11011), anti-mouse conjugated to Alexa Fluor 568 (A11031), and anti-mouse conjugated to Alexa Fluor 488 (A21202) were from Life Technology for confocal microscopy.
Pharmacological agents: 1,25D3 (D1530), Vitamin D3 (C9756), bafilomycin A1 (B1793), chloroquine (C6628), PMA (P8319), ML-SA1 (SML0627) and concanamycin A (C9705) were purchased from Sigma-Aldrich. Gly-Phe-β-naphthylamide (GPN, 21438-66-4) and thapsigargin (67526-95-8) were from Cayman Chemical. Lysosomal isolation kit (LYSISO1), acid phosphatase assay kit (CS0740) and β-N-acetylglucosaminidase assay kit (CS0780) were purchased from Sigma-Aldrich. Cathepsin D activity assay kit (ab65302) was from Abcam. LysoSensor™ Yellow/Blue DND-160 (L7545), Fura-2-AM (F1221), LysoTracker Red DND-99 (L7528) and acridine orange (A3568) were purchased from Invitrogen.
Bacterial and cell culture
The H. pylori strain SS1 (Sydney strain 1), TN2GF4 wild type and CagA knockout strains, and the antibiotic-resistant strains 10996 and 10945 were obtained from the Department of Microbiology, the Chinese University of Hong Kong. H. pylori was initially grown on horse blood agar plates (Columbia Blood Agar Base with DENT Selective Supplements; Oxoid, SR0147) in an anaerobic jar with a microaerophilic environment for 5 days at 37°C. Human gastric epithelial cell line HFE145 was a kind gift from Prof. Hassan Ashktorab (Howard University, Washington, D.C., USA) and Dr. Duane T. Smoot (Meharry Medical College, TN, USA), GES-1 was from Dr. Wang Hong Ying (Chinese Academy of Medical Sciences, Beijing, China). HFE145 and GES-1 cells were cultured in Dulbecco’s modified Eagle’s medium (Gibco™, Thermo Fisher, 12800-017) supplemented with 10% fetal bovine serum (FBS; Gibco™, Thermo Fisher, 26140079) at 37°C in 5% CO2. THP-1 Cells (ATCC, TIB-202) were cultured in RPMI-1640 (Gibco™, Thermo Fisher, 23400021) supplemented with 10% FBS at 37°C in 5% CO2.
Clinical specimens
Twelve H. pylori-positive and 7H. pylori-negative gastric tissues were collected from patients who underwent gastric biopsies at the Prince of Wales Hospital (Hong Kong, China). The diagnoses were based on clinical and histological laboratory examination. All patients gave written informed consent on the use of clinical specimens for research purposes. This study was approved by the Joint CUHK-NTEC Clinical Research Ethics Committee. More detailed information is shown in Table S1.
Intracellular H. pylori quantification
HFE145 cells were infected with H. pylori with a multiplicity of infection (MOI) of 1:100 for 3 h, then exposed to gentamycin (100 μg/ml; Sigma-Aldrich, 345814-M) for 1 h to kill the extracellular bacteria. Cells were washed with phosphate-buffered saline (PBS; 137 mM NaCl, 2.7 mM KCl, 10 mM Na2HPO4, 1.8 mM KH2PO4) buffer 3 times, then incubated in fresh medium and treated with 1,25D3 (200 nM) for another 72 h.
Three approaches were applied to quantify intracellular H. pylori levels, including PCR, immunofluorescence staining and colony forming unit (CFU) assay. DNA from cells and mouse gastric tissues was extracted using the Wizard Genomic extraction kit (Promega, A1120) according to the manufacturer’s instruction. The relative density of H. pylori was quantified by semi-quantitative PCR, detecting H. pylori-specific 16S ribosomal DNA (rDNA) as previously described using specific primers [Citation15,Citation17,Citation18]. HP5 (5ʹ-TTT GTT AGA GAA GAT AAT GAC GGT ATC TAA C-3ʹ) and HP6 (5ʹ-CAT AGG ATT TCA CAC CTG ACT GAC TAT C- 3ʹ). The amount of mouse/human Gapdh/GAPDH DNA in the same samples were measured for normalization. The relative density of H. pylori was expressed as the ratio of expression H. pylori-specific 16S rDNA to Gapdh/GAPDH DNA. The primers for detection of mouse Gapdh DNA were as follows: forward: 5ʹ-GCA GTG GCA AAG TGG AGA TT-3ʹ, reverse: 5ʹ-TCT CCA TGG TGG TGA AGA CA-3ʹ. The primers for detection of human GAPDH DNA were as follows: forward: 5ʹ-GAC TTC AAC AGC GAC ACC C-3ʹ, reverse: 5ʹ- AGA AGA TGA AAA GAG TTG TCA GGG C-3ʹ. The results were analyzed using the comparative threshold cycle (CT) method as previously described [Citation15,Citation17,Citation18].
In order to quantify intracellular H. pylori by immunofluorescence staining assay, cells were fixed with 4% paraformaldehyde in 100 mM phosphate buffer, pH 7.4, then washed 2 times with PBS. Intracellular bacteria were subsequently stained by permeabilization of the fixed monolayer using 1% saponin (Sigma-Aldrich, 47036) in distilled water, followed by staining with anti-H. pylori antibody and Alexa Fluor 568 anti-goat were used as secondary antibody. In addition, 4ʹ, 6-diamidino-2-phenylindole (DAPI; Vector Laboratories, H-1200) was used to stain cell nuclei. Sections were evaluated with a laser confocal microscope (Olympus FV1000). At least 30 fields from each group were randomly selected to count bacteria number.
As for the CFU assay, cells were permeabilized with 0.5% saponin for 15 min at room temperature, then plated on blood agar plates with serial dilution to determine the viable bacteria. Colonies were grown and counted after 7 days’ culture.
Isolation of lysosomal fractions
For each group, 2 × 10⁸ cells were harvested and trypsinized. Lysosome isolation was performed according to the manufacturer’s description (Lysosome Isolation Kit; Sigma-Aldrich, LYSISO1). Briefly, cells were centrifuged at 600 × g for 5 min, resuspended in a 2.7 packed cell volume of 1 × extraction buffer, and homogenized in a glass Dounce homogenizer by 20 strokes. The nuclei were removed by centrifugation at 1,000 × g for 10 min. The post-nuclear supernatant was centrifuged at 20,000 × g for 20 min, and the resulting pellet, containing the crude lysosomal fraction, was resuspended in a minimal volume of 1 × extraction buffer (0.4 ml per 108 cells). A step gradient medium solution, including 27%, 22.5%, 19%, 16%, 12% and 8% was prepared according to the manufacturer’s recommendations, with 27% Optiprep Density Gradient Medium Solution at the bottom and 8% Optiprep Density Gradient Medium solution at the top of the tube. We isolated enriched lysosomes from the crude lysosomal fraction by density gradient centrifugation at 150,000 × g for 4 h on an OptiPrep (Sigma-Aldrich, LYSISO1) density gradient. Altogether, 0.5 ml fractions were collected starting from the top of the gradient. Each fraction was tested for protein concentration, ACP2 and NAGLU activity.
ACP2 and NAGLU activity measurement
Lysosomal fraction was isolated as described above. ACP2 (CS0740) and NAGLU (CS0780) activities were determined by following the manufacturer’s instructions. Briefly, pre-warmed (37°C) substrate solution and reaction components were mixed in a 96-well plate, and the NAGLU activity was determined by the addition of 90 μl of assay buffer (0.09 M citrate buffer, pH 4.8, 1 mM 4-nitophenyl N-acetyl-β-D-glucosaminide) to 10 μl of cell lysates. The ACP2 activity was determined by the addition of 50 μl of assay buffer (0.09 M citrate buffer, pH 4.8, 1 mM 4-nitrophenyl phosphate) to 50 μl of cell lysates. For both assays, the reaction mixture was incubated at 37°C for 10 min and stopped by addition of 200 μl of stop solution (0.5 N NaOH). The absorbance was measured at 405 nm. ACP2 and NAGLU activity was measured in triplicate.
Lysosomal pH measurement
Measurement of lysosomal pH was determined using dextran conjugates LysoSensor Yellow/Blue DND-160 (Invitrogen, L7545) [Citation26]. In brief, cells were trypsinized, harvested (1 × 10⁶ cells/ml), and loaded with 1 mg/ml LysoSensor-dextran for 1 h at 37°C with 5% CO2. The cells were then washed 3 times and aliquoted into a black 96-well microplate and pH calibration was performed according to the protocol established by Wolfe et al [Citation26]. In brief, cells were treated with 10 mM monensin (Sigma-Aldrich, M5273) and 10 mM nigericin (Sigma-Aldrich, N7143) in 2-(N-morpholino) ethanesulfonic acid (MES) buffer (5 mM NaCl, 115 mM KCl, 1.3 mM MgSO4, 25 mM MES [Sigma-Aldrich, M3671]), with the pH adjusted to a range from 3.5–7.0. The samples were read in a Wallac Victor 2 fluorimeter (Perkin Elmer, Norwalk, CT, USA) with excitation at 355 nm. The ratio of emission at 440/535 nm was then calculated for each sample. The pH values were determined from the linear standard curve generated via the pH calibration samples.
Calcium assays
Fura-2 AM (3 μM; Invitrogen, F1221) was applied to determine cytosolic Ca2+ signals. Cells grown on glass coverslips were loaded with Fura-2 AM for 30 min at room temperature. After being washed 3 times with HBSS (140 mM NaCl, 5 mM KCl, 1 mM CaCl2, 0.4 mM MgSO4 · 7H2O, 0.5 mM MgCl2 · 6H2O, 0.3 mM Na2HPO4, 0.4 mM KH2PO4, 6 mM glucose, 4 mM NaHCO3), the entire coverslips were transferred to a closed perfusion chamber mounted on the stage of an inverted microscope (Nikon, Nikon TE300). Cells with or without GPN, thapsigargin or ML-SA1 treatment were perfused with Ca2+-free solution containing 117 mM NaCl, 24.8 mM NaHCO3, 4.7 mM KCl, 1.2 mM MgCl2, 1.2 mM KH2PO4, 11.1 mM glucose. The cells were viewed with a 40 × extra-long working distance objective (Nikon CFI Plan Fluor ELWD, 0.6 numerical aperture) and the Fura-2 fluorescence ratios recorded (PTI Ratio-Master fluorescence system; Photon Technology International, Edison) from an optical field containing 30–40 cells in the center of the epithelium. Fura-2 AM ratios were used to represent changes in [Ca2+] using Felix software (Photon Technology International) [Citation53].
Transmission electron microscopy
Transmission electron microscopy assays were performed as previously described [Citation54]. Briefly, cells or human biopsies were fixed for 1 h at 4°C in 1.6% glutaraldehyde in 0.1 mol/L phosphate buffer, pH 7.2, then washed and fixed again in aqueous 2% osmium tetroxide, dehydrated in ethanol, embedded in Epon (Serva, 21045.02), and processed for electron microscopy with a Zeiss EM 902 transmission electron microscope at 80 kV. Ultra-thin sections were cut and stained with uranyl acetate and lead citrate.
Chromatin immunoprecipitation
HFE145 cells were plated in 150-cm plates and grown overnight to about 70% confluence. Cells were incubated with 1,25D3 (200 nM) for 12 h. Chromatin immunoprecipitations were performed with the SimpleChIP Enzymatic Chromatin IP kit (Cell Signaling Technology, 9003) following the manufacturer’s instruction. Immunoprecipitation reactions were performed by using antibodies against STAT3 (Cell Signaling Technology, 9139), and rabbit IgG (Cell Signaling Technology, 2729). Immunoprecipitated DNA samples were then analyzed by qPCR. The primers for the segment of DNA analyzed for STAT3 binding were as follows: forward primer, 5-CAG GAA ACG CTG ACA TCA AA-3; reverse primer, 5-GCA CTC CTC TCT TGC TTT CC-3. Values are represented as the mean from three independent experiments with standard deviations as indicated.
Immunofluorescence
For immunofluorescence staining of human and mouse stomach sections and human gastric epithelial cells, slides were incubated with primary antibody followed by a secondary fluorescent antibody and then DAPI to stain cell nuclei. Sections were evaluated using laser scanning confocal microscopy (Olympus FV1000). The colocalization coefficient, measuring the fractions of LC3-positive signals that were also positive for H. pylori in human biopsies, were performed on randomly selected images of H. pylori-positive areas (n ≥ 30) using the ‘Colocalization Finder’ plugin for ImageJ [Citation15].
CRISPR-Cas9-mediated knock-out of PDIA3
Disruption of the PDIA3 gene in HFE145 cells was achieved using the CRISPR-Cas9 system. Briefly, 2 optimized guide RNAs targeting to the genomic locus of PDIA3 (gRNA #1 and gRNA #2) were designed with the ATUM gRNA Design Online Tool. These guide DNAs were synthesized and inserted into the lentiCRISPRv2 vector (Addgene, 52961; deposited by Feng Zhang). The ligated plasmids were transformed and amplified using a high pure plasmid isolation kit (Roche Molecular System Inc., 11754777001) following the manufacturer’s guides. Purified plasmids were sequenced to confirm the successful ligation. Then, plasmids were transfected into HFE145 cells using jetPRIME (Polyplus-transfection, 114–15). At 72 h post-transfection, cells were selected with 2 μg/ml puromycin for 7 days. The puromycin-resistant cells were re-plated in 96-well plates at a density suitable for single-colony isolation of the knockout cells clones. Clonal cell lines were picked from plates, and split into 2 replicates, with one plate for genotyping PCR and western blotting, the other for cell expansion. The gRNAs for PDIA3 knockout were designed as follows: gRNA #1, forward primer, 5-CAC CGG ACC AGC TTC AGT GCC TCT C-3; reverse primer, 5-AAA CGA GAG GCA CTG AAG CTG GTC C-3; gRNA #2, forward primer, 5-CAC CGG TAG TTA TCC CTC AAG TTG C-3; reverse primer, 5-AAA CGC AAC TTG AGG GAT AAC TAC C-3.
Murine H. pylori infection model and colony-forming assay
H. pylori were grown in brain heart infusion (BHI; Oxoid, CM1135) broth supplemented with 15% FBS for 20–30 h at 37°C under microaerobic conditions and saturated humidity, with shaking at 200 rpm. C57BL/6 male mice were orally gavaged with 108 CFUs of H. pylori SS1 or sterile BHI broth (as a control) using gastric intubation on alternate days for a total of 3 doses at 8 weeks of age. After infection for 1 month, mice were orally administrated with vitamin D3 (1000 IU/kg, intragavage.) or distilled water (as a control) every other day for another 1 week, 1 month, or 2 months. Animals were killed under anesthesia. Stomachs were opened along the inner curvature and divided into several parts. H. pylori infection levels within mouse gastric tissues were quantified by colony-forming assay as previously described [Citation15,Citation17,Citation18]. Briefly, half of the stomach was placed in BHI and homogenized in cell strainer (Corning Falcon, 352360). Ten-fold serial dilutions were prepared in BHI broth and aliquots spread out on H. pylori-selective agar plates (Columbia blood agar base with DENT supplement). After 7 days of culture as above, colonies were counted and the number of CFUs was calculated per mg of stomach. Colonies were confirmed to be H. pylori by the oxidase, catalase and urease test.
Western blots
Tissues or cells were lysed in radioimmunoprecipitation assay buffer containing 0.5% cholic acid (Sigma-Aldrich, C1129), 0.1% sodium dodecyl sulfate (Sigma-Aldrich, L3771), 2 mM ethylenediaminetetraacetic acid, 1% Triton X-100 (Sigma-Aldrich, T8787), 10% glycerol (Sigma-Aldrich, G5516), 1.0 mM phenylmethylsulfonyl fluoride (Sigma-Aldrich, 78830), 1 µg/mL aprotinin (Sigma-Aldrich, 10236624001). After sonication for 30 s on ice and centrifuging for 20 min at 13,000 g at 4°C, the supernatant was collected, and protein concentration was determined by protein assay kit (Bio-Rad, 5000122), using bovine serum albumin (BSA; Bio-Rad, 5000122) as the standard. Protein samples (20 µg) were resolved by SDS-PAGE. Proteins were blotted onto nitrocellulose membranes (Bio-Rad, 1620177). Non-specific binding was blocked in 5% blocking buffer (5% non-fat dry milk, 150 mmol/L Tris-HCl, pH 7.4, 50 mmol/L NaCl, 0.05% Tween 20 [Sigma-Aldrich, P9416]) for 1 h, and membranes were incubated overnight at 4°C with the indicated with primary antibody at a 1:1000 dilution. The membranes were then incubated for 1 h with horseradish peroxidase-coupled secondary antibody at room temperature. Chemiluminescent signals were then developed with LumiGLO reagent (Cell Signaling Technology, 7003S) and exposed on X-ray film (Fuji Photo Film Co., Ltd.).
Statistical analysis
All data were expressed as the mean ± standard error of mean (S.E.M.). Differences between 2 groups were compared by the Mann-Whitney U test or Student’s t test. Multiple group comparisons were made by the Kruskal-Wallis test or one-way analysis of variance (ANOVA) followed by the Tukey’s t-test. P values less than 0.05 were considered statistically significant.
Supplemental Material
Download Zip (11.1 MB)Acknowledgments
We thank Dr. KO Wing Hung for using his microscopy image system to perform the calcium assays. We also thank Prof. Hassan Ashktorab (Howard University, Washington, USA) & Dr. Duane T. Smoot (Meharry Medical College, Tennessee, USA) for kindly providing the human gastric epithelial cell line HFE145. We also thank Dr. Terje Johansen (Molecular Cancer Research Group, Institute of Medical Biology, University of Tromsø) for mCherry-GFP-LC3 plasmid.
Disclosure statement
No potential conflict of interest was reported by the authors.
Supplementary material
Supplementary material for this article can be accessed here
Additional information
Funding
Related Research Data
References
- Fukase K, Kato M, Kikuchi S, et al. Effect of eradication of Helicobacter pylori on incidence of metachronous gastric carcinoma after endoscopic resection of early gastric cancer: an open-label, randomised controlled trial. Lancet. 2008 Aug 2;372(9636):392–397. PubMed PMID: 18675689.
- Thung I, Aramin H, Vavinskaya V, et al. Review article: the global emergence of Helicobacter pylori antibiotic resistance. Aliment Pharmacol Ther. 2016 Feb;43(4):514–533. PubMed PMID: 26694080; PubMed Central PMCID: PMCPMC5064663.
- Allen LA, Schlesinger LS, Kang B. Virulent strains of Helicobacter pylori demonstrate delayed phagocytosis and stimulate homotypic phagosome fusion in macrophages. J Exp Med. 2000 Jan 3;191(1):115–128. PubMed PMID: 10620610; PubMed Central PMCID: PMCPMC2195807.
- Deen NS, Huang SJ, Gong L, et al. The impact of autophagic processes on the intracellular fate of Helicobacter pylori: more tricks from an enigmatic pathogen? Autophagy. 2013 May;9(5):639–652. PubMed PMID: 23396129; PubMed Central PMCID: PMCPMC3669176.
- Chu YT, Wang YH, Wu JJ, et al. Invasion and multiplication of Helicobacter pylori in gastric epithelial cells and implications for antibiotic resistance. Infect Immun. 2010 Oct;78(10):4157–4165. PubMed PMID: 20696835; PubMed Central PMCID: PMCPMC2950335.
- Wang YH, Gorvel JP, Chu YT, et al. Helicobacter pylori impairs murine dendritic cell responses to infection. PLoS One. 2010 May 27;5(5):e10844. PubMed PMID: 20523725; PubMed Central PMCID: PMCPMC2877707.
- Klionsky DJ, Abdelmohsen K, Abe A, et al. Guidelines for the use and interpretation of assays for monitoring autophagy (3rd edition). Autophagy. 2016;12(1):1–222. PubMed PMID: 26799652; PubMed Central PMCID: PMCPMC4835977.
- He C, Klionsky DJ. Regulation mechanisms and signaling pathways of autophagy. Annu Rev Genet. 2009;43:67–93. PubMed PMID: 19653858; PubMed Central PMCID: PMCPMC2831538.
- Rich KA, Burkett C, Webster P. Cytoplasmic bacteria can be targets for autophagy. Cell Microbiol. 2003 Jul;5(7):455–468. PubMed PMID: 12814436.
- Levine B. Eating oneself and uninvited guests: autophagy-related pathways in cellular defense. Cell. 2005 Jan 28;120(2):159–162. PubMed PMID: 15680321.
- Terebiznik MR, Raju D, Vazquez CL, et al. Effect of Helicobacter pylori’s vacuolating cytotoxin on the autophagy pathway in gastric epithelial cells. Autophagy. 2009 Apr;5(3):370–379. PubMed PMID: 19164948.
- Raju D, Hussey S, Ang M, et al. Vacuolating cytotoxin and variants in Atg16L1 that disrupt autophagy promote Helicobacter pylori infection in humans. Gastroenterology. 2012 May;142(5):1160–1171. PubMed PMID: 22333951; PubMed Central PMCID: PMCPMC3336037.
- Campbell GR, Spector SA. Vitamin D inhibits human immunodeficiency virus type 1 and Mycobacterium tuberculosis infection in macrophages through the induction of autophagy. PLoS Pathog. 2012;85:e1002689. PubMed PMID: 22589721; PubMed Central PMCID: PMCPMC3349755.
- Lee A, O’Rourke J, De Ungria MC, et al. A standardized mouse model of Helicobacter pylori infection: introducing the Sydney strain. Gastroenterology. 1997 Apr;112(4):1386–1397. PubMed PMID: 9098027.
- Zhang L, Hu W, Cho CH, et al. Reduced lysosomal clearance of autophagosomes promotes survival and colonization of Helicobacter pylori. J Pathol. 2018 Apr;244(4):432–444. PubMed PMID: 29327342.
- Yuk JM, Shin DM, Lee HM, et al. Vitamin D3 induces autophagy in human monocytes/macrophages via cathelicidin. Cell Host Microbe. 2009 Sep 17;6(3):231–243. PubMed PMID: 19748465.
- Zhang L, Yu J, Wong CC, et al. Cathelicidin protects against Helicobacter pylori colonization and the associated gastritis in mice. Gene Ther. 2013 Jul;20(7):751–760. PubMed PMID: 23254369.
- Zhang L, Wu WK, Gallo RL, et al. Critical role of antimicrobial peptide cathelicidin for controlling helicobacter pylori survival and infection. J Immunol. 2016 Feb 15;196(4):1799–1809. PubMed PMID: 26800870.
- Yoshii SR, Mizushima N. Monitoring and measuring autophagy. Int J Mol Sci. 2017 Aug 28;18(9):1865. PubMed PMID: 28846632; PubMed Central PMCID: PMCPMC5618514.
- Stoka V, Turk V, Turk B. Lysosomal cathepsins and their regulation in aging and neurodegeneration. Ageing Res Rev. 2016 Dec;32:22–37. PubMed PMID: 27125852.
- Kaji T, Ishihara S, Ashizawa N, et al. Adherence of Helicobacter pylori to gastric epithelial cells and mucosal inflammation. J Lab Clin Med. 2002 Apr;139(4):244–250. PubMed PMID: 12024112.
- Ozbek A, Ozbek E, Dursun H, et al. Can Helicobacter pylori invade human gastric mucosa?: an in vivo study using electron microscopy, immunohistochemical methods, and real-time polymerase chain reaction. J Clin Gastroenterol. 2010 Jul;44(6):416–422. PubMed PMID: 19904218.
- Liu Y, Hidaka E, Kaneko Y, et al. Ultrastructure of Helicobacter pylori in human gastric mucosa and H. pylori-infected human gastric mucosa using transmission electron microscopy and the high-pressure freezing-freeze substitution technique. J Gastroenterol. 2006 Jun;41(6):569–574. PubMed PMID: 16868805.
- Mindell JA. Lysosomal acidification mechanisms. Annu Rev Physiol. 2012;74:69–86. PubMed PMID: 22335796.
- Hundeshagen P, Hamacher-Brady A, Eils R, et al. Concurrent detection of autolysosome formation and lysosomal degradation by flow cytometry in a high-content screen for inducers of autophagy. BMC Biol. 2011 Jun 2;9:38. PubMed PMID: 21635740; PubMed Central PMCID: PMCPMC3121655.
- Wolfe DM, Lee JH, Kumar A, et al. Autophagy failure in Alzheimer’s disease and the role of defective lysosomal acidification. Eur J Neurosci. 2013 Jun;37(12):1949–1961. PubMed PMID: 23773064; PubMed Central PMCID: PMCPMC3694736.
- Huss M, Ingenhorst G, Konig S, et al. Concanamycin A, the specific inhibitor of V-ATPases, binds to the V(o) subunit c. J Biol Chem. 2002 Oct 25;277(43):40544–40548. PubMed PMID: 12186879.
- Gerasimenko JV, Tepikin AV, Petersen OH, et al. Calcium uptake via endocytosis with rapid release from acidifying endosomes. Curr Biol. 1998 Dec 3;8(24):1335–1338. PubMed PMID: 9843688.
- Lloyd-Evans E, Morgan AJ, He X, et al. Niemann-Pick disease type C1 is a sphingosine storage disease that causes deregulation of lysosomal calcium. Nat Med. 2008 Nov;14(11):1247–1255. PubMed PMID: 18953351.
- Zeevi DA, Frumkin A, Bach G. TRPML and lysosomal function. Biochim Biophys Acta. 2007 Aug;1772(8):851–858. PubMed PMID: 17306511.
- Di Palma F, Belyantseva IA, Kim HJ, et al. Mutations in Mcoln3 associated with deafness and pigmentation defects in varitint-waddler (Va) mice. Proc Natl Acad Sci U S A. 2002 Nov 12;99(23):14994–14999. PubMed PMID: 12403827; PubMed Central PMCID: PMCPMC137533.
- Medina DL, Ballabio A. Lysosomal calcium regulates autophagy. Autophagy. 2015;116:970–971. PubMed PMID: 26000950; PubMed Central PMCID: PMCPMC4502748.
- Pike JW. Vitamin D3 receptors: structure and function in transcription. Annu Rev Nutr. 1991;11:189–216. PubMed PMID: 1654066.
- Chen J, Olivares-Navarrete R, Wang Y, et al. Protein-disulfide isomerase-associated 3 (Pdia3) mediates the membrane response to 1,25-dihydroxyvitamin D3 in osteoblasts. J Biol Chem. 2010 Nov 19;285(47):37041–37050. PubMed PMID: 20843786; PubMed Central PMCID: PMCPMC2978632.
- Nemere I, Garbi N, Hammerling GJ, et al. Intestinal cell calcium uptake and the targeted knockout of the 1,25D3-MARRS (membrane-associated, rapid response steroid-binding) receptor/PDIA3/Erp57. J Biol Chem. 2010 Oct 8;285(41):31859–31866. PubMed PMID: 20682787; PubMed Central PMCID: PMCPMC2951257.
- Levy DE, Lee CK. What does Stat3 do? J Clin Invest. 2002 May;109(9):1143–1148. PubMed PMID: 11994402; PubMed Central PMCID: PMCPMC150972.
- Biancuzzo RM, Clarke N, Reitz RE, et al. Serum concentrations of 1,25-dihydroxyvitamin D2 and 1,25-dihydroxyvitamin D3 in response to vitamin D2 and vitamin D3 supplementation. J Clin Endocrinol Metab. 2013 Mar;98(3):973–979. PubMed PMID: 23386645; PubMed Central PMCID: PMCPMC3590486.
- Nishizawa T, Suzuki H. Mechanisms of Helicobacter pylori antibiotic resistance and molecular testing. Front Mol Biosci. 2014;1:19. PubMed PMID: 25988160; PubMed Central PMCID: PMCPMC4428472.
- Tsugawa H, Suzuki H, Saya H, et al. Reactive oxygen species-induced autophagic degradation of Helicobacter pylori CagA is specifically suppressed in cancer stem-like cells. Cell Host Microbe. 2012 Dec 13;12(6):764–777. PubMed PMID: 23245321.
- Lelouvier B, Puertollano R. Mucolipin-3 regulates luminal calcium, acidification, and membrane fusion in the endosomal pathway. J Biol Chem. 2011 Mar 18;286(11):9826–9832. PubMed PMID: 21245134; PubMed Central PMCID: PMCPMC3058973.
- Hewison M. Antibacterial effects of vitamin D. Nat Rev Endocrinol. 2011 Jun;7(6):337–345. PubMed PMID: 21263449.
- Wei R, Christakos S. Mechanisms underlying the regulation of innate and adaptive immunity by vitamin d. Nutrients. 2015 Sep 24;7(10):8251–8260. PubMed PMID: 26404359; PubMed Central PMCID: PMCPMC4632412.
- Youssef DA, Miller CW, El-Abbassi AM, et al. Antimicrobial implications of vitamin D. Dermatoendocrinol. 2011 Oct;3(4):220–229. PubMed PMID: 22259647; PubMed Central PMCID: PMCPMC3256336.
- Gombart AF, Borregaard N, Koeffler HP. Human cathelicidin antimicrobial peptide (CAMP) gene is a direct target of the vitamin D receptor and is strongly up-regulated in myeloid cells by 1,25-dihydroxyvitamin D3. FASEB J. 2005 Jul;19(9):1067–1077. PubMed PMID: 15985530.
- Li M, Li L, Zhang L, et al. 1,25-Dihydroxyvitamin D3 suppresses gastric cancer cell growth through VDR- and mutant p53-mediated induction of p21. Life Sci. 2017 Jun 15;179:88–97. PubMed PMID: 28465245.
- Cantorna MT. Mechanisms underlying the effect of vitamin D on the immune system. Proc Nutr Soc. 2010 Aug;69(3):286–289. PubMed PMID: 20515520; PubMed Central PMCID: PMCPMC3138329.
- Chun RF, Liu PT, Modlin RL, et al. Impact of vitamin D on immune function: lessons learned from genome-wide analysis. Front Physiol. 2014;5:151. PubMed PMID: 24795646; PubMed Central PMCID: PMCPMC4000998.
- Turano C, Gaucci E, Grillo C, et al. ERp57/GRP58: a protein with multiple functions. Cell Mol Biol Lett. 2011 Dec;16(4):539–563. PubMed PMID: 21837552.
- Tohda C, Urano T, Umezaki M, et al. Diosgenin is an exogenous activator of 1,25D(3)-MARRS/Pdia3/ERp57 and improves Alzheimer’s disease pathologies in 5XFAD mice. Sci Rep. 2012;2:535. PubMed PMID: 22837815; PubMed Central PMCID: PMCPMC3405293.
- Xu H, Ren D. Lysosomal physiology. Annu Rev Physiol. 2015;77:57–80. PubMed PMID: 25668017; PubMed Central PMCID: PMCPMC4524569.
- He J, Shi W, Guo Y, et al. ERp57 modulates mitochondrial calcium uptake through the MCU. FEBS Lett. 2014 Jun 5;588(12):2087–2094. PubMed PMID: 24815697.
- Palacios C, Gonzalez L. Is vitamin D deficiency a major global public health problem? J Steroid Biochem Mol Biol. 2014 Oct;144 Pt A:138–145. PubMed PMID: 24239505; PubMed Central PMCID: PMCPMC4018438.
- Leung FP, Yao X, Lau CW, et al. Raloxifene relaxes rat intrarenal arteries by inhibiting Ca2+ influx. Am J Physiol Renal Physiol. 2005 Jul;289(1):F137–44. PubMed PMID: 15713909.
- Hu W, Chen SS, Zhang JL, et al. Dihydroartemisinin induces autophagy by suppressing NF-kappaB activation. Cancer Lett. 2014 Feb 28;343(2):239–248. PubMed PMID: 24099910.