
Abstract
To better understand how flooding and tree fall structure forests in the Amazon, I sampled vegetation plots within three blackwater forests (least flooded, medium flooded, highest flooded) and their tree fall gaps in the Peruvian Amazon. I found (1) increased flooding decreased family richness in the closed-canopy forests but increased it in their gaps, with no trends for no. of unique species, (2) flooding decreased stem size everywhere as did the number of stems as size increased especially for larger stems, (3) Green's index showed clumping only for least-flooded forests with the closed-canopy forest showing more than its tree fall gap, and (4) both flooding and tree fall gap creation decreased canopy coverage perhaps as an additive effect. Further among the stem size classes, only the smallest stems were significantly affected by openness and by type of forest, with a significant interaction term where flooding significantly decreased the number of these smaller stems in all forests and their gaps, except those with the highest level of flooding. Also tree fall gaps had significantly more, smaller stems than their forests in the two most-flooded forests, but not in the least-flooded forest. I conclude that flooding is a greater stressor and influence on the structure of these forests than tree fall, and so, in these forests, gradients and disturbances overlap in their traditional roles.
Introduction
Plants respond to both abiotic and biotic factors in the environment which are often organized along gradients (Walter Citation1973; Whittaker Citation1975) and after disturbances (Gleason Citation1926; Pickett & White Citation1985). Common gradients include precipitation, elevation, and temperature. Disturbances range from the very severe (e.g. landslides [Myster Citation1997]) to the less severe (conversion to agriculture [Myster Citation2007b], tree fall [Everham et al. Citation1996]) where biomass lost may be their currency (Tilman Citation1988; Myster Citation2003). Humans have been part of the vast forest–river system of the Amazon basin for many thousands of years, and there is some paleoecological data of their land use. This influence could have significant for much of the Holocene, for example, in occupation of lakeside sites and the cultivation of maize (Weng et al. Citation2002). The vegetation mosaic of any landscape is, therefore, largely determined by gradients and historical disturbances (Turner & Dale Citation1991; Myster Citation2001), and, consequently, examination of an ecosystem's gradients and disturbances – and the responses of their plants to them – is critical to understanding its structure, function, and dynamics.
In the Amazon basin, flooding forms major gradients – varying in frequency, duration, depth, and local spatial variation – which explain much of plant distribution, composition, association, and abundance (Junk Citation1989; Lamotte Citation1990). Whereas the unflooded Amazonian rainforest may resemble rainforests in other areas in the Neotropics (Lopez & Kursar Citation1999; Myster & Santacruz Citation2005; Myster Citation2012a), flooded forests have a unique biology and ecology (Kalliola et al. Citation1991). For example, common plant adaptations to flooding include (1) seed structures, so that seeds can escape predation from both terrestrial mammals and fish in order to germinate where fish may also disperse seeds, (2) seedling strategies of growing fast in order to have their leaves above the next ‘high tide’ or being able to endure extended submersion, and (3) special root structures, such as aerenchyma tissue, to facilitate gas exchange under water needed in part because of reduction in oxygen solubility in water under high temperatures (Junk Citation1989; Lopez & Kursar Citation1999; Parolin et al. Citation2004). The most common forest disturbance in the vast areas of the Western Amazon that have not been logged or converted to agriculture (Myster Citation2007b) is natural tree fall (Everham et al. Citation1996; Myster Citation2009), and the resulting gap dynamics in flooded forests should also have unusual aspects (Lamotte Citation1990).
Therefore, in order to better understand how Amazonian rainforests are structured, and to collect data urgently needed in the Neotropics for sound, sustainable management efforts, I used data from forest and gap plots in each of these three forest types found in northeastern Peru: blackwater forest that floods 1–2 months per year (called dry here for ease of presentation), blackwater forest that is under water 3–5 months per year (called wet), and blackwater forest which is under water for at least 6 months out of the year (called very wet). I used those data to test the interactive effects of blackwater forest type (dry, wet, very wet) × forest openness (closed-canopy, tree fall gap) on floristics (family richness, no. of unique species) and physical structure (mean stem size, stem size distribution, dispersion, canopy coverage). Two previous analyses of this data-set (Myster Citation2007a, Citation2010) focused on species richness, genera richness, average height, maximum height, basal area, stem density, above-ground biomass, turnover, and Fisher's alpha.
Materials and methods
Study site
The study site is the Area de Conservacion Regional Comunal de Tamshiyacu-Tahuayo (ACRCTT: www.perujungle.com; Gottdenker & Bodmer Citation1998; Myster Citation2007a, Citation2009, Citation2010) located in Loreto Province, 80 miles southeast of Iquitos, Peru (~2°S, 75°W) with a mean elevation of 106 m. The reserve is part of one of the largest (270,654 ha) protected area in the Amazon, containing wet lowland tropical rainforest (Lugo & Lowe Citation1995; Myster & Santacruz Citation2005; Myster Citation2012a) of high diversity (Daly & Prance Citation1989; Daly & Mitchell Citation2000). It is comprised of low, seasonally inundated river basins of the upper Amazon and named for the Tahuayo and Tamshiyacu rivers which form boundaries to the north and west. The substrate of these forests is composed of alluvial and fluvial Holocene sediments from the eastern slopes of the Andes. Annual precipitation ranges from 2.4 to 3.0 m per year, and the average temperature is relatively steady at 26°C.
This rainforest is divided into distinct communities defined by their flooding regime (Wittmann et al. Citation2004) where the rainy season is between November and April (Kalliola et al. Citation1991). These include blackwater forest which floods 1–3 months per year, blackwater forest which floods 4–6 months of the year, and blackwater forest which floods at least 6 months of the year. Maximum level of flooding was not measured in this study but is correlated with flooding duration (Randall W. Myster, pers. obs.). Blackwater is a local forest runoff containing tannins leached from litter, making the water acidic and low in nutrients (Myster Citation2009). Common trees in these forests include those of genera Chorisia, Eschweilera, Hura, Spondias, and Virola, and species such as Calycophyllum spruceanum, Ceiba samauma, Inga spp., Cedrela odorata, Copaifera reticulata, Phytelephas macrocarpa with understory palms such as Guazuma rosea, and Piptadenia pteroclada (Prance Citation1979; Daly & Prance Citation1989; Puhakka et al. Citation1992; Myster Citation2007a).
Blackwater flooded forest plots
Within each of these three forest types, five areas of similar topography were selected in May 1999. These areas were primary, unlogged blackwater forest and had fresh, average-sized (100–300 m2: Brokaw Citation1982) gaps within them. Information gathered at the reserve from past scientific research and from local people working at the reserve was used to find these forest types and their young gaps (<3 years old). In each forested area, and also in the center of an average-sized gap found in the area, a 5 m × 5 m (25 m2) plot was established as suggested for gaps of this size (Thompson et al. Citation1999). This was replicated five times within each forest type. Each of these 30 plots (3 forest types [dry, wet, very wet] × 2 forest openness types [closed-canopy, tree fall gap] × 5 replicates) was sampled during May 1999, 2000, 2001, and 2002. This included identifying each tree (the complete species list is in Myster Citation2007a) that was at least 1 cm diameter at breast height (dbh), measuring that dbh, and estimating its height using a tangent height gauge for tall trees. The dbh measurement was taken at the nearest, lowest point where the stem was cylindrical, and for buttressed trees it was taken above the buttresses.
Trees were identified to species, or to genus in a few cases, using Gentry (Citation1993), Vasquez-Martinez (Citation1997), and Ruokolainen and Tuomisto (Citation1998) as taxonomic sources. We also consulted the Universidad Nacional de la Amazonia Peruana (UNAP) herbarium and these two websites: the Missouri Botanical Garden (www.mobot.org) and for specific surveys done in the Peruvian Amazon (www.iiap.org.pe). Finally, in a few instances when plants could not be identified to species, common morphospecies were collected and deposited in the UNAP herbarium. These data are housed in the archives of the Long-Term Ecological Research (LTER) site in Puerto Rico (LTERDBAS #150) and may be accessed through their website (luq.lternet.edu).
Data analysis
The 2002 data were used in an analysis of variance (ANOVA; split-plot design) using the means testing procedure Ryan-Einot-Gabriel-Welsh (SAS Citation1985). There were two main effects: forest type (dry vs. wet vs. very wet with two degrees of freedom) × openness (closed-canopy forest vs. tree fall gap with one degree of freedom). I also investigated the interaction term (with two degrees of freedom) where significant interaction terms are graphed, because they are the most meaningful (SAS Citation1985). Finally, because of the multiple ANOVAs, the sequential Bonferroni test was employed (Rice Citation1989) but did not suggest that any significant results were unreliable.
I then pooled the data by combining the replicates together to generate two floristic parameters (family richness, no. of unique species) and four physical structures (mean stem size, stem size distribution classes, dispersion, canopy closure). The stem dispersion pattern was computed by comparing plot data to Poisson and negative binomial distributions using chi-square analysis and then generating Green's index (Ludwig & Reynolds Citation1988; Myster & Pickett Citation1992) which is based on the variance to mean ratio where 0 indicates a random distribution and 1 indicates maximum clumping. Canopy closure is expressed as a percentage of total plot coverage, using the formula in Buchholz et al. (Citation2004).
Results
The family richness for the dry forest (closed-canopy = 18, tree fall gap = 8) was summed over all five plots. The family richness for the wet forest (closed-canopy = 13, tree fall gap = 16) was summed over all five plots. The family richness for the very wet forest (closed-canopy = 9, tree fall gap = 11) was summed over all five plots.
The unique species for the dry forest, closed-canopy were Lonchocarpus sp., Lecythis sp., Quararibea bracteolosa, Ormosia sp., Miconia grandifolia, Potalia amara, Lonchocarpus guilleminianus, C. reticulata, Ficus sp., Bixa orellana, Maytenus sp., Trophis racemosa, Simarouba sp., Duguetia quitarensis, and Protium sp. for a total of 15, also summed over all five plots. The unique species for the dry forest, tree fall gap were Lepidocarium sp., Cajanus cajan, Clibadium sp., Pourouma bicolor, Bauhinia sp., Virola cuspidata, Lanza caspi, and Licania britteniana for a total of 8, also summed over all five plots. The unique species for the wet forest, closed-canopy was only Aniba riparia, also summed over all five plots. The unique species for the wet forest, tree fall gap were Abuta grandifolia, Gnetum sp., Palicourea sp., and Coccoloba sp. for a total of 4, also summed over all five plots. The unique species for the very wet forest, closed-canopy were Astrocaryum murumuru, Theobroma subincanum, Annona sp., Psidium sp., Oenocarpus mapora, and Chionanthus sp. for a total of 6, also summed over all five plots. Finally, the unique species for the very wet forest, tree fall gap were Alchornea sp., Erythroxylum sp., Anaxagorea sp., Heliconia sp., and Persea sp. for a total of 5, also summed over all five plots.
The number of stems in stem size class 2 for the dry forest was 20 for closed-canopy and 15 for tree fall gap, summed over all five plots. The number of stems in stem size class 2 for the wet forest was 22 for closed-canopy and 14 for tree fall gap, summed over all five plots. The number of stems in stem size 2 for the very wet forest was 13 for closed-canopy and 8 for tree fall gap, summed over all five plots. The number of stems in stem size class 3 for the dry forest was 8 for closed-canopy and 6 for tree fall gap, summed over all five plots. The number of stems in stem size class 3 for the wet forest was 12 for closed-canopy and 11for tree fall gap, summed over all five plots. The number of stems in stem size 3 for the very wet forest was 11 for closed-canopy and 7 for tree fall gap, summed over all five plots.
The number of stems in stem size class 4 for the dry forest was 15 for closed-canopy and 3 for tree fall gap, summed over all five plots. The number of stems in stem size class 4 for the wet forest was 6 for closed-canopy and 3 for tree fall gap, summed over all five plots. The number of stems in stem size 4 for the very wet forest was 5 for closed-canopy and 1 for tree fall gap, summed over all five plots. Green's index for the dry forest was 0.75 for closed-canopy and 0.91 for tree fall gap; both of these forests were significantly nonrandom (χ2: 19.332 and 18.666 both >12.592, df = 8, p < 0.001) and clumped (χ2: 16.447 and 15.281 both >12.592, df = 8, p < 0.01). Green's index for the wet forest was 0.42 for closed-canopy and 0.52 for tree fall gap. Green's index for the very wet forest was 0.26 for closed-canopy and 0.33 for tree fall gap.
There was not a significant difference (1) among forest types when closed-canopy forest and tree fall gap data were pooled within dry forest, within wet forest and within very wet forest, (2) between closed-canopy forests (dry, wet, and very wet forest data pooled) and tree fall gaps (dry, wet, and very wet forest data pooled), or (3) in the interaction between these two main effects, on family richness (). There were significant differences, however, among forest types when closed-canopy forest and tree fall gap data were pooled within dry forest, within wet forest, and within very wet forest among forest types for no. of unique species, stem size class 1, Green's index and % canopy closure, between closed-canopy forests (dry, wet, and very wet forest data pooled) and tree fall gaps (dry, wet, and very wet forest data pooled) for stem size class 1 and % canopy coverage, and in the interaction between these two main effects, on mean stem size, stem size class 1 and % canopy coverage ().
Table 1. F statistic and significant p-value summary table for all main and interactive effects, operating on all floristic and physical structure parameters.
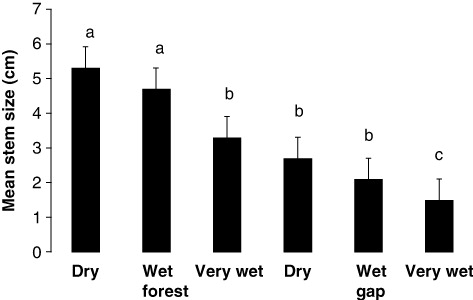
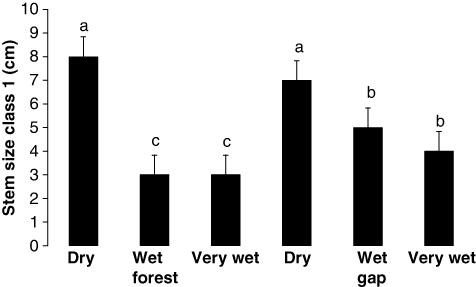
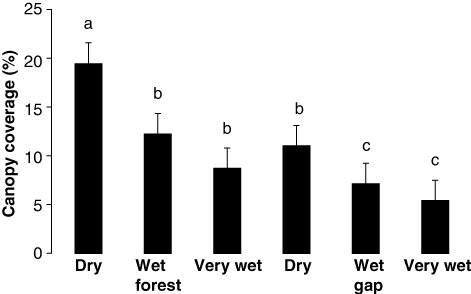
For the significant interaction terms, means testing showed that mean stem size decreased significantly as flooding increased and when gaps were formed (). In particular, the dry forest and wet forest were similar, the very wet forest was similar to the dry and wet gaps, and the very gap was dissimilar (). Means testing also showed that number of stems in the smallest stem class decreased significantly as flooding increased and when gaps were formed (). In particular, the dry forest and its gap were similar, the wet gap and the very wet gap were similar, and the wet forest and very wet forest were similar (). Finally, means testing showed that % canopy coverage decreased significantly as flooding increased and when gaps were formed (). In particular, the dry forest was dissimilar, the wet forest was similar to the very wet forest and the dry gap, and the wet and very wet gaps were similar ().
Discussion
Increased flooding decreased family richness in the closed-canopy forests but increased it in their gaps, with no trends for no. of unique species. Flooding decreased stem size everywhere as did the number of stems as size increased especially for larger stems. Green's index showed clumping only for the least-flooded forests with the closed-canopy forest showing less than its tree fall gap perhaps because flooding removed the smaller stems. Small stems may have been lost because of the force of the flow of water and/or because they are more easily submerged. Finally, both flooding and tree fall gap creation decreased canopy coverage perhaps as an additive effect.
The tree stem size distributions compared well with other Western Amazon flooded forests (see references in Myster Citation2009). In addition, the least-flooded forest had similar stem densities compared to unflooded forests elsewhere in the Amazon (Ferreira & Prance Citation1998; Pitman et al. Citation1999; Thompson et al. Citation1999). Several structural parameters conformed to the flooding gradient, which is decreasing in complexity as flooding increased, which may be due in part to root burial by sedimentation and oxygen deficiency in flooded forests (Junk Citation1989; Lopez & Kursar Citation1999). Other parameters agreed with the more traditional view of tree fall destroying forest structure (Brokaw Citation1982) which then recovers that structure over time through a development sequence of ground coverage, organized vertical growth, surface arrangement at multiple levels, and crown differentiation. The fact that flooding and tree fall naturally occur together in these forests was captured in the sampling design which allowed an examination of how these forces work in concert. It would seem that flooding acts as a disturbance in these forests (Salo & Kalliola Citation1990) by removing plant biomass as gaps do (Myster Citation2001; Myster Citation2003).
In general, results show that flooding was a greater stressor on the forest than tree fall, with gap effects greatly diminishing as flooding increased. This may be because while tree fall can remove one or a few large trees, flooding destroys many (smaller) stems which can add up to removing move biomass and canopy coverage, increasing its effect. The loss of tree stem density with flooding (Baslev et al. Citation1987) might best be explained either by the loss of tree stems due to the action of moving water or by the physical damage due to the weight of debris (also seen in temperate forests: Myster & McCarthy Citation1989). Similarly loss of stems in gaps may be due to the weight of a falling tree, for example, its lianas pulling other trees down as well. The dry conformed to nonflooded forest expectations in having nonrandom, uniform stem dispersion patterns (Picard et al. Citation2009). Clumping in their gaps was also expected, but it was less (a smaller Green's index value) than that found in larger forest openings recovering from agriculture (Myster & Pickett Citation1992) which contain perches for birds to land and disperse seeds. Such clumping may result from dispersal and/or from adaptations helping seeds and seedlings to survive after dispersal (Howe Citation1989).
Previous analyses of this same data-set showed other structural effects of gap formation on canopy average height, canopy maximum height, basal area, density, above-ground biomass, turnover, and alpha diversity (leading to fewer but larger trees in forest plots compared to gap plots: Myster Citation2010). Those analysis showed structural effects of and forest type on species richness, genera richness, density, turnover, and alpha diversity (leading to fewer trees, genera, and species as flooding increased: Myster Citation2010) as well. Finally compositional effects were also seen where common species existing between the wet forest and its gaps and between gaps found in the wet and very wet forest, tree richness being maximum in the dry forest and minimum in very wet gaps, and dominance-diversity curves having more dominance by single species in the dry forest and their gaps (Myster Citation2007a). Finally, in an on-site 1 ha wet blackwater forest plot (Myster Citation2013; Myster Citationin press, Randall W. Myster, unpub. data): (1) stems conformed to a reverse J size pattern, (2) total stems when compared to other similar forest samplings with a slightly larger average dbh, (3) trees were clumped at a higher degree than a 1 ha várzea plot (Myster Citation2013; Randall W. Myster, unpub. data) with 12% canopy closure, and (4) extensive flooding reduced basal area, size of stems, stem densities, and above-ground biomass.
Conclusion
Future long-term sampling in these plots may reveal that the dynamics of these forests, as for all plant communities, is defined by their plant–plant replacement process (Myster Citation2007b, Citation2012b). Results suggest managers concern themselves more with flooding than tree fall as a dominant structuring agent in these forests. Flooding tends to eliminate both vertical and horizontal heterogeneity which affects availability of commonly logged tree species as well as wildlife populations. Thus, flooding may reduce the ‘mosaic’ structure (Myster & Malahy Citation2012) caused by tree fall. Future modeling of these forest communities and their stand development should incorporate data on the effects of these two structuring forces, flooding and tree fall. Consequently in Amazonian forests gradients (here flooding) and disturbances (here tree fall gap formation) may overlap in their traditional roles by presenting plants with similar cues under different circumstances and may also have additive effects on forest structure.
Acknowledgements
I thank P. Beaver and J.T. Huanaquiri for their help. I also thank R. Montufar, H. Baslev, H. Bruelheide, J. Podani, T. Fahey, and P. Beaver for comments on an earlier version of the article.
Disclosure statement
No potential conflict of interest was reported by the authors.
Additional information
Funding
References
- Baslev H, Luteyn J, Ollgaard B, Holm-Nielsen LD. 1987. Composition and structure of adjacent unflooded and floodplain forest in Amazonian Ecuador. Opera Botanica. 92:37–57.
- Brokaw NVL. 1982. The definition of treefall gap and its effect on measures of forest dynamics. Biotropica. 11:158–160. 10.2307/2387750
- Buchholz T, Tennigkeit T, Weinreich A. 2004. Maesopsis eminii – a challenging timber tree species in Uganda – a production model for commercial forestry and smallholders. Proceedings of the international union of forestry research organizations (IUFRO) conference on the economics and management of high productivity plantations, Lugo, Spain, 15p.
- Daly DG, Mitchell JD. 2000. Lowland vegetation of tropical South America. In: Lentz DL, editor. Imperfect balance: landscape transformation in the Pre-Columbian Americas. New York, NY: Columbia University Press; p. 391–453.
- Daly DG, Prance GT. 1989. Brazillian Amazon. In: Camppbell DG, Hammond H, editors. Floristic inventory of tropical countries. New York (NY): New York Botanical Garden; p. 401–426.
- Everham III EM, Myster RW, VanDeGenachte E. 1996. Effects of light, moisture, temperature, and litter on the regeneration of five tree species in the tropical montane wet forest of Puerto Rico. Am J Bot. 83:1063–1068. 10.2307/2445996
- Ferreira LV, Prance GT. 1998. Species richness and floristic composition in four hectares in the Jau National Park in upland forests in Central Amazonia. Biol Cons. 7:1349–1364. 10.1023/A:1008899900654
- Gentry A. 1993. A field guide to woody plants of northwest South America (Colombia, Ecuador, Peru). Washington (DC): Conservation International.
- Gleason HA. 1926. The individualistic concept of the plant association. Bull Torrey Bot Club. 53:1–20. 10.2307/2479932
- Gottdenker N, Bodmer RE. 1998. Reproduction and productivity of white – lipped and collared peccaries in the Peruvian Amazon. J Zool Lond. 245:423–430. 10.1111/j.1469-7998.1998.tb00116.x
- Howe HF. 1989. Scatter- and clump-dispersal and seedling demography: hypothesis and implications. Oecologia. 79:417–426. 10.1007/BF00384323
- Junk WJ. 1989. Flood tolerance and tree distribution in central Amazonian floodplains. In: Holm-Nielsen LB, Nielsen IC, Balslev H, editors. Tropical forests: botanical dynamics, speciation and diversity. New York (NY): Academic Press; p. 47–64.
- Kalliola RS, Jukka M, Puhakka M, Rajasilta M. 1991. New site formation and colonizing vegetation in primary succession on the western Amazon floodplains. J Ecol. 79:877–901. 10.2307/2261087
- Lamotte S. 1990. Fluvial dynamics and succession in the Lower Ucayali River basin, Peruvian Amazonia. For Ecol Manag. 33:141–156. 10.1016/0378-1127(90)90189-I
- Lopez OR, Kursar TA. 1999. Flood tolerance of four tropical tree species. Tree Physiol. 19:925–932. 10.1093/treephys/19.14.925
- Ludwig JA, Reynolds JF. 1988. Statistical ecology. New York (NY): Wiley.
- Lugo AE, Lowe C. 1995. Tropical Forests: management and ecology. Berlin: Springer-Verlag.
- Myster RW. 1997. Seed predation, disease and germination on landslides in Neotropical lower montane wet forest. J Veg Sci. 8:55–64. 10.2307/3237242
- Myster RW. 2001. Mechanisms of plant response to gradients and after disturbances. Bot Rev. 67:441–452. 10.1007/BF02857892
- Myster RW. 2003. Using biomass to model disturbance. Comm Ecol. 4:101–105. 10.1556/ComEc.4.2003.1.14
- Myster RW. 2007a. Interactive effects of flooding and forest gap formation on tree composition and abundance in the Peruvian Amazon. Folia Geobotanica. 42:1–9. 10.1007/BF02835099
- Myster RW. 2007b. Introduction. In: Myster RW, editor. Post-agricultural succession in the Neotropics. Berlin: Springer-Verlag; p. 3–21.
- Myster RW. 2009. Plant communities in Western Amazonia. Bot Rev. 75:271–291. 10.1007/s12229-009-9032-1
- Myster RW. 2010. Flooding gradient and treefall gap interactive effects on plant community structure, richness, and alpha diversity in the Peruvian Amazon. Ecotropica. 16:43–49.
- Myster RW. 2012a. Spatial and temporal heterogeneity of light and soil water along a terra firma transect in the Ecuadorian Amazon. Can J For Res. 42:1–4. 10.1139/x11-168
- Myster RW. 2012b. Plants replacing plants: the future of community modeling and research. Bot Rev. 78:2–9. 10.1007/s12229-011-9091-y
- Myster RW. 2013. The effects of flooding on forest floristics and physical structure in the Amazon: results from two permanent plots. For Res. 2:112.10.4172/2168-9776.1000112
- Myster, RW. in press. Comparing and contrasting eight different flooded and non-flooded forests in the Peruivan Amazon: seed rain. N Z J For Sci.
- Myster RW, Malahy M. 2012. Testing aggregation hypotheses among Neotropical trees and shrubs: results from a 50-ha plot over 20 years of sampling. Rev Biol Trop. 60:1015–1023.
- Myster RW, McCarthy BC. 1989. Effects of herbivory and competition on survival of Carya tomentosa (Juglandaceae) seedlings. Oikos. 56:145–148. 10.2307/3565329
- Myster RW, Pickett STA. 1992. Effects of palatability and dispersal mode on spatial patterns of trees in oldfields. Bull Torrey Bot Club. 119:145–151. 10.2307/2997027
- Myster RW, Santacruz PG. 2005. Una comparación de campo de insectos de suelo-morar de Amazonas: Tierra firme y bosques de tierras inundadas vs. espacios abiertos en el Parque Nacional Yasuní, Ecuador [A comparison of field soil-dwelling insects Amazon: mainland and floodplain forests vs. in the open spaces Yasuni National Park, Ecuador]. Revista de la Pontivica Univeridad Católica der Ecuador. 76:111–124.
- Parolin P, DeSimone O, Hasse K, Waldhoff D, Rottenberger S, Kuhn U, Kesselmeier J, Kleiss B, Schmidt W. 2004. Central Amazonian floodplain forests: tree adaptations in a pulsing system. Bot Rev. 70:357–380. 10.1663/0006-8101(2004)070[0357:CAFFTA]2.0.CO;2
- Picard N, Bar-Hen F, Mortier A, Chadoeuf A. 2009. Understanding the dynamics of an undisturbed tropical rain forest from the spatial pattern of trees. J Ecol. 97:97–108. 10.1111/j.1365-2745.2008.01445.x
- Pickett STA, White PS. 1985. The ecology of natural disturbance and patch dynamics. Orlando, FL: Academic Press.
- Pitman NCA, Terborgh J, Silman MR, Percy NV. 1999. Tree species distributions in an upper Amazonian forest. Ecology. 80:2651–2661. 10.1890/0012-9658(1999)080[2651:TSDIAU]2.0.CO;2
- Prance GT. 1979. Notes on the vegetation of Amazonia III. The terminology of Amazonian forest types subject to inundation. Brittonia. 31:26–38. 10.2307/2806669
- Puhakka ME, Kalliola R, Rajasita M, Salo J. 1992. River types, site evolution and successional vegetation patterns in Peruvian Amazonia. J Biogeogr. 19:651–665. 10.2307/2845707
- Rice WR. 1989. Analyzing tables of statistical tests. Evolution. 43:223–225. 10.2307/2409177
- Ruokolainen H, Tuomisto H. 1998. Vegetacion natural de la zona de Iquitos [Natural vegetation in the area of Iquitos]. In: Kalliola R, Flores F, editors. Geoecologia y desarrollo amazonico: Estudio integrado en la zona de Iquitos, Peru [Geoecology and Amazonian development: integrated near Iquitos Studio, Peru]. Turku: S. Ann. Univ. Turkuensis, Ser. A II; p. 253–365.
- Salo JS, Kalliola RJ. 1990. River dynamics and natural forest regeneration in the Peruvian Amazon. In: Gentry AH, editor. Four Neotropical rainforests. New Haven (CT): Yale University Press; p. 245–256.
- SAS. 1985. User's guide: statistics. Version 5 edition. Cary (NC): SAS Institute.
- Thompson J, Protor J, Scott DA, Fraser PJ, Marrs RH, Miller RP, Viana V. 1999. Rain forest on Maraca Island, Roraima Brazil: artificial gaps and plant response to them. For Ecol Manag. 102:305–321. 10.1016/S0378-1127(97)00171-0
- Tilman D. 1988. Plant strategies and the dynamics and structure of plant communities. Princeton (NJ): Princeton University Press.
- Turner MG, Dale VH. 1991. Modeling landscape disturbance. In: Turner MG, Gardner RH, editors. Quantitative methods in landscape ecology: the analysis and interpretation of landscape heterogeneity. Ecological studies 82. Berlin: Springer-Verlag; p. 134–146.
- Vasquez-Martinez R. 1997. Florula de las Reservas Biologicas de Iquitos, Peru. Monographs in Systematic Botany Volume 63. St. Louis (MO): Missouri Botanical Garden Press.
- Walter H. 1973. Vegetation of the earth and the ecological systems of the geo-biosphere. Berlin: Springer-Verlag.
- Weng C, Bush MB, Athens JS. 2002. Holocene climate change and hydrarch succession in lowland Amazonian Ecuador. Rev Palaeobot Palynol. 120:73–90. 10.1016/S0034-6667(01)00148-8
- Whittaker RH. 1975. Communities and ecosystems. New York (NY): MacMillian.
- Wittmann F, Anhuf D, Junk WJ. 2004. Tree species distribution and community structure of central Amazonian varzea forests by remote-sensing techniques. J Trop Ecol. 18:805–820.