
Abstract
Cinnamoyl-CoA reductase (CCR, EC 1.2.1.44) is an important enzyme responsible for lignin biosynthesis in plants that belongs to the family of oxidoreductases. We analyzed developmental, tissue specific, and stress-mediated expression of the HcCCR1 (HM151381) gene from Hibiscus cannabinus. Gene expression analysis revealed that HcCCR1 was highly upregulated in mature leaves of 16-week-old plants. The maximum downregulation and upregulation of HcCCR1 was caused by cold and MeJA treatment, respectively. Sequence analysis demonstrated that HcCCR1 protein (ADK24219) contains a conserved NWYCYGK catalytic domain, while bioinformatics prediction indicated the presence of a palmitoylation site in the HcCCR1 protein. Phylogenetic analysis showed that HcCCR1 is more closely related to HcCCR2 (AGJ84130) and AtCCR proteins than CCR-like proteins. Comparative sequence analysis showed presence of significant differences between HcCCR1 and HcCCR2, which are homologs of H. cannabinus. Expression analysis demonstrated that the HcCCR1 gene is modulated by different external stresses.
| Abbreviations | ||
| HcCCR | = | Hibiscus cannabinus cinnamoyl-CoA reductase |
| CCR | = | cinnamoyl-CoA reductase |
| pI | = | isoelectric point |
| MeJA | = | methyl jasmonate |
| SA | = | salicylic acid |
| ABA | = | abscisic acid |
| H2O2 | = | hydrogen peroxide |
| TMHMM | = | transmembrane domain prediction by hidden Markov model |
| PAL | = | phenylalanine ammonia-lyase |
| 4CL | = | 4-hydroxycinnamoyl CoA ligsae |
| C3H | = | P-coumarate 3-hydroxylase |
| CCoAOMT | = | caffeoyl CoA O-methyltransferase |
| F5H | = | ferulate 5-hydroxylase |
| CAD | = | cinnamyl alcohol dehydrogenase |
Introduction
Lignin is the second most abundant biopolymer after cellulose and an important constituent of plant secondary cell walls that provides rigidity, hydrophobicity, and mechanical support to plant cells (Boerjan et al. Citation2003; Raes et al. Citation2003). Lignin creates a strong mechanical barrier against pathogen invasion and plays important roles in protecting against wounding and other abiotic stresses (Raes et al. Citation2003; Moura et al. Citation2010). Lignin creates large problems during pulp and biofuel production and hampers forage digestibility by cattle and other ruminants (Baucher et al. Citation2003; Weng et al. Citation2008). There have been many efforts to decrease lignin contents or change its composition by developing genetically modified plants. Lignin is produced by the phenylpropanoid pathway (Mohanta et al. Citation2012; Mohanta, Citation2012), which is very complex and involves role of multiple enzymes. Lignin biosynthesis primarily consists of two major steps, monolignol biosynthesis and cross-linking of the monolignols by peroxidases and laccases (Xu et al. Citation2009). Cinnamoyl-CoA reductase (CCR) is an important enzyme for lignin biosynthesis that catalyzes the first committed step in monolignol biosynthesis (Zhou et al. Citation2010). Hence, it can be a very good target for genetically modified plants with reduced lignin contents. Genes related to lignin biosynthesis belong to diverse multigene families that produce several multifunctional enzymes. This diversity is found from lower plants to higher plants. A recent study showed that CCR is the most expanded gene family (Xu et al. Citation2009), and all CCR can be classified as CCR and CCR-like genes, which are diverse in their function, spatiotemporal expression, and biochemical properties (Raes et al. Citation2003; Barakat et al. Citation2011). The preferences for different substrates of various CCR isoenzymes diversify its functions. Arabidopsis AtCCR1 is involved in developmental lignification, whereas AtCCR2 is associated with stress responses (Raes et al. Citation2003). The AtCCR2 expression level is generally lower in wild type, although its higher expression was observed in ccr1 knockout lines and function of AtCCR1 was partly compensated (Mir Derikvand et al. Citation2008). Transposon insertion in Medicago CCR1 showed highly reduced lignin contents and growth, whereas ccr2 knockouts exhibited no significant changes in growth (Zhou et al. Citation2010). Taken together, these results suggest that only a few CCR homologs function as the actual gene, whereas the others are backups. Hibiscus cannabinus is an annual dicotyledonous plant recognized as a potential source for future biomass production (Dempsey Citation1975). The broad ecological adaptability, high growth rate and quality of fiber (inner core fiber: 75–60%, short fiber, and outer bast fiber: 25–40%, long fiber) of this plant makes it an inexpensive raw material for biomass production (Ghosh et al. Citation2012). Here, we attempted to characterize tissue specific and stress-mediated expression of HcCCR1 (HM151381) gene.
Materials and methods
Plant materials, treatments, and RNA isolation
Hibiscus cannabinus L. C-9 plants were cultivated in a growth room (16-h light/8-h dark photoperiod, 22°C, and 100 µmol m–2 s–1 light intensity) for 4 weeks, after that they were transplanted and grown under greenhouse conditions with natural sunlight for up to 20 weeks. Various tissue samples (roots, petioles, leaves, and flowers) were collected from 16-week-old kenaf plants. Leaves were categorized as follows: (1) young leaf (YL, <2 cm long); (2) immature leaf (IL, 3–5 cm long); and (3) mature leaf (ML, >9 cm long). Similarly, flowers were categorized as follows: (1) young flower (YF, unopened green flower, <2 cm long with green sepal); (2) immature flower (IF, unopened white flower, >3 cm long with green sepal); and (3) mature flower (open white flower). Eight different types of stress were applied to 3-week-old kenaf seedlings. The stresses were; MeJA (100 µM), cold (10°C), H2O2 (10 mM), SA (5 mM), ABA (100 µM), wounding, NaCl (200 mM), and drought. For RNA isolation, a combination of the CTAB method and the Qiagen RNeasy Mini kit protocol was followed. To remove the DNA, isolated RNA was treated with RNase free DNase (Roche). cDNA was synthesized using 2 µg of RNA and Superscript® III First-strand synthesis supermix (Invitrogen) according to the manufacturer's instructions. Detailed descriptions of plant growth, stress treatments and RNA isolation were carried out according to (Ghosh et al. Citation2012).
QRT-PCR analysis
CDS of H. cannabinus HcCCR1 was obtained from NCBI (HM151381) and qRT-PCR analysis was performed as previously described (Bae et al. Citation2008) using the Mx3000P qRT-PCR System (Agilent, Santa Clara, CA, USA) with SYBR Green qRT-PCR master mix (Agilent). Primers specific for the HcCCR1 gene were designed using the Primer 3 software of Biology Workbench (http://workbench.sdsc.edu/). The forward and reverse primers of the HcCCR1 homologs were as follows: forward primer, 5′-AGTATCCCGTCCCTACCAAGTGT-3′; reverse primer, 5′-TAAGATTGAATACGGAGCACTGGC-3′. ACTIN (DQ866836), a housekeeping gene, was used as an internal control using the following primer sequences: forward primer, 5′-ATGGACAAGTCATTACTATTGGAGC-3′; reverse primer, 5′-AGTGATTTCCTTGCTCATACGGT-3′. Normalization and data analysis were performed using the 2–ΔCT method (Schmittgen & Livak Citation2008).
Data analysis
To understand the sequence similarity between HcCCR1 [HM151381(CDS), ADK24219 (protein)] and HcCCR2 [JX524276 (CDS), AGJ84130 (protein)], pairwise sequence alignment was conducted using Biology WorkBench employing the ClustalW programme with default parameters (Subramaniam Citation1998; Larkin et al. Citation2007). The palmitoylation site of the HcCCR1 (ADK24219) and HcCCR2 (AGJ84130) protein was predicted using the CSS-Palm 2.0 software (Ren et al. Citation2008). The transmembrane domain analysis was carried out with the TMHMM server v.2.0 (Kahsay et al. Citation2005). The Protoparam tool was used to predict different parameters of HcCCR1 protein (Wilkins et al. Citation1999). The secondary structures of HcCCR1 and the HcCCR2 proteins were predicted using the Jpred 3 server (Cole et al. Citation2008), while the tertiary structure was modeled using the Phyre2 server (Kelley & Sternberg Citation2009). The two structures were superimposed using BioSuper (http://ablab.ucsd.edu/BioSuper/). Phylogenetic analysis of the HcCCR1 protein with HcCCR2, CCR, and CCR-like protein of Arabidopsis thaliana and switchgrass (Panicum virgatum) was carried out using the MEGA5 software (Tamura et al. Citation2011). Different statistical parameters were used to construct the phylogenetic tree were; statistical method: neighbor-joining, test of phylogeny: bootstrap method, no. of bootstrap replicates: 1000, substitution type: amino acids, model/method: poisson method, rates among sites: uniform and gaps/missing data treatment: complete deletion.
Results
Comparative bioinformatics analysis of HcCCR1 and HcCCR2
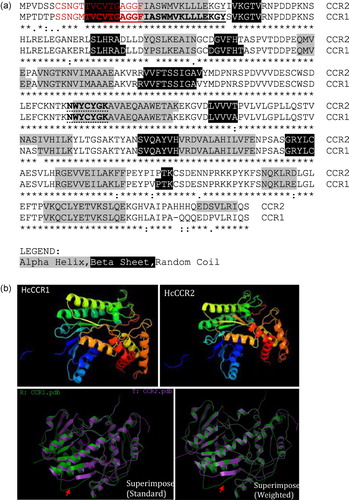
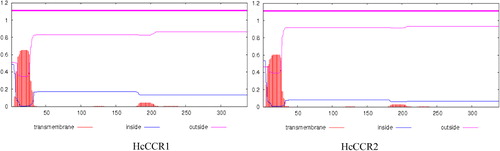
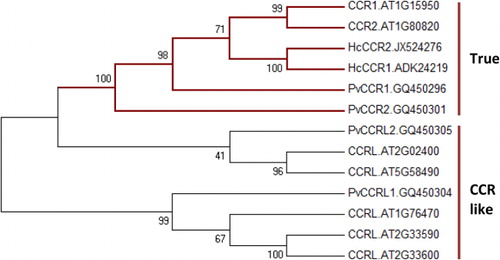
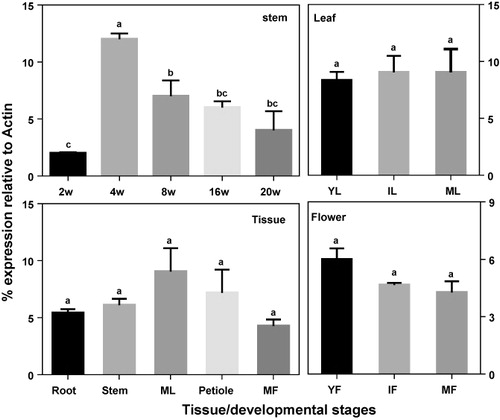
Comparative evaluation of the nucleotide and amino acid sequences of HcCCR1 and HcCCR2 revealed very close similarity (Supplementary table). Specifically, HcCCR1 and HcCCR2 showed 91.1% and 94.1% homology among coding sequences (CDS) and protein levels, respectively. Amino acid substitutions between HcCCR1 and HcCCR2 were observed at the N- and C-terminal ends of their protein sequences. The CDS and protein sequence of HcCCR1 are three nucleotides and one amino acid shorter than HcCCR2. Although their isoelectric points are identical (pI 6.27), their molecular weights differed slightly, being 37.10 and 37.37 kDa for HcCCR1 and HcCCR2, respectively. Pair-wise alignment revealed the presence of a conserved NAD(P) binding domain (VTGAGGFIASWMVKLLLEKGY) and a catalytic (NWYCYGK) domain at the N-terminal region of the HcCCR1 protein (). The Jpred 3 results showed that both had similar secondary structures (). The sequence (TVCVTGAGGFIASWMVKLLLEKGYIVKGTV) produces a sheet-helix-sheet (βαβ) structure (). However, the tertiary structures of HcCCR1 and HcCCR2 differed (). CSS-Palm analysis showed the presence of an N-terminal palmitoylation site (SSNGMTVCVTGAGGF) in HcCCR1 (). HcCCR2 also showed the presence of a N-terminal palmitoylation site (CSNGTTVCVTGAGGF) (). The TMHMM prediction indicated that HcCCR1 and HcCCR2 do not contain any transmembrane domains and may therefore be localized in cytosol (). To confirm whether the two H. cannabinus homologs were true CCR or CCR-like, a phylogenetic tree was constructed using Arabidopsis CCR (AT1G15950, AT1G80820) and CCR-like protein sequences (AT1G76470, AT2G02400, AT2G33590, AT2G33600) along with the deduced protein sequence of switchgrass (Panicum virgatum) CCR (GQ450296,GQ450301) and CCR-like (GQ450304,GQ450305) () (Raes et al. Citation2003; Escamilla-Treviño et al. Citation2010). Our results showed that CCR and CCR-like proteins were distinctly separated. Both H. cannabinus CCR were closely related to Arabidopsis CCR when compared to monocot (switchgrass) CCR. In the phylogenetic tree, CCR-like proteins fell in a distant group relative to true CCR.
Tissue specific expression of HcCCR1
Investigation of the expression pattern of HcCCR1 in various tissues of 16-week-old kenaf plants revealed the highest and lowest level of expression in mature leaf and mature flower tissue, respectively, while intermediate levels were observed in root and stem tissue (). We also investigated developmental stage specific expression patterns in leaf, stem, and flower tissues. No significant difference was observed in expression among young, immature and mature leaf tissues. The expression of HcCCR1 was slightly higher in young flowers than immature and mature flowers, and its expression in stem tissues varied greatly according to the age. Initially (two weeks old), the expression of HcCCR1 was lower, after which it was upregulated in 4-week-old stems. The expression was then downregulated gradually for up to 20 weeks. Overall, HcCCR1 expression was ubiquitous, similar to that of HcCCR2 (Ghosh et al. Citation2014). However, a significant difference was observed between the expression of HcCCR1 and HcCCR2. The higher expression of HcCCR1 was observed in mature leaf while lower level of expression was observed in mature flowers. Conversely, the highest level of HcCCR2 expression was observed in mature flowers, whereas the lowest was in stems and petioles (Ghosh et al. Citation2014). Different levels of expression between HcCCR1 and HcCCR2 were observed during stem development as well. Specifically, HcCCR2 showed a steady level of expression in 2- and 4-week-old stem, after which it was downregulated. Conversely, HcCCR1 showed lower expression in 2-week-old stems, was sharply upregulated at 4 weeks, and was then gradually downregulated.
Stress-mediated expression of HcCCR1
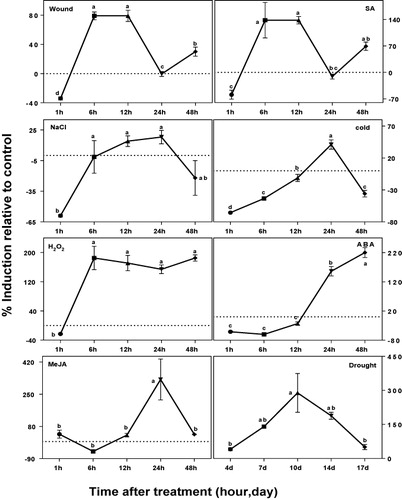
We analyzed the stress-mediated expression of HcCCR1 (). Wound and SA treated plants showed similar HcCCR1 expression patterns. In both cases, HcCCR1 was downregulated at 1 h, then upregulated at 6, 12, and 48 h. NaCl treatment also showed initial downregulation at 1 h, after which it was gradually upregulated to 24 h, and then downregulated at 48 h. Cold treatment downregulated the expression of HcCCR1 at 1, 6, 12, and 48 h, although it was upregulated at 24 h. Conversely, in H2O2 treated samples, expression of HcCCR1 was upregulated at all time points except 1 h. The ABA treated samples exhibited early downregulation (1, 6, and 12 h), followed by strong upregulation at 24 and 48 h. In MeJA treated samples, HcCCR1 was highly upregulated at 24 h, while drought treated samples showed continuous upregulation at all time points. Downregulation of HcCCR1 was observed at early time points, especially at 1 h, in response to all treatments except drought. The greatest downregulation of HcCCR1 was observed at 1 h in cold treated sample. Based on the highest upregulation time, the treatments could be classified into two categories: early (1, 6, and 12 h) and late (24 and 48 h) response. Wound and SA falls in the first category, while cold, ABA, NaCl, and MeJA showed late response. H2O2 and drought treated samples showed upregulation in almost all time points. Among all treatments, maximum upregulation of HcCCR1 was occurred by MeJA at 24 h. HcCCR1 expression also showed differences at many points relative to HcCCR2 (Ghosh et al. Citation2014). Previous experiments showed that, expression of HcCCR2 was unaffected after 1 h of stress treatments, whereas HcCCR1 was downregulated by many treatments. In wound, SA, NaCl, and H2O2 treated samples; HcCCR1 was downregulated at 1 h, whereas HcCCR2 expression was remained unaffected. In cold treated samples, HcCCR2 was highly downregulated in all time points. However, HcCCR1 was strongly upregulated at 24 h. Differences also existed in NaCl treated samples at 48 h, with HcCCR2 and HcCCR1 being highly up and downregulated, respectively. In wound treated samples, HcCCR2 showed high upregulation at 24 h, while HcCCR1 remained unchanged. In H2O2 treated samples, significant upregulation of HcCCR2 was only observed at 12 and 24 h, whereas HcCCR1 was highly upregulated at all time points except at 1 h. Both of these homologs showed similar expression patterns in drought and MeJA treatments. Both homologs were also highly upregulated at 24 h and 10 days after MeJA and drought treatment, respectively. Conversely, ABA treated samples showed similar expression patterns at early time points (1, 6, and 12 h), while HcCCR1 was highly upregulated at 24 and 48 h.
Discussion
Our analysis suggests that both H. cannabinus CCR homologs are closely related at the sequence level (Supplementary table). However, tertiary structure prediction revealed slight differences in their structural features. Bioinformatics prediction showed the absence of transmembrane domain in the HcCCR1 and HcCCR2 protein. A previous study showed that the HcCCR protein is localized to the cytoplasm and does not contain any localization signal sequences (Kawasaki et al. Citation2006). Kawasaki et al. (Citation2006) also reported that OsRac1 (Rac/Rop Family of small GTPases) protein interacts with OsCCR1 in the vicinity of plasma membrane and that OsRac1 is localized to plasma membrane (Kawasaki et al. Citation2006). It is very unlikely that interaction with a membrane bound OsRac1 protein would occur without localization. Therefore, they also predicted possible movement of OsCCR1 to the plasma membrane under certain circumstances, such as defense response and interaction with OsRac1, or activation of OsRac1 may affect the localization of OsCCR1 (Kawasaki et al. Citation2006). Accordingly, the presence of a transmembrane signal sequence is important in this event. Although HcCCR1 and HcCCR2 are cytosolic, upon activation of a signaling event they can undergo positional changes and interact with their partner in close vicinity to plasma membrane. Further in depth investigations are required to understand this event in detail. Moreover, co-translational modification of protein is required to carry out some specific functions such as protein trafficking, aggregation, and affinity for membrane attachment (Adamson et al. Citation1992; Löfke et al. Citation2013). These co-translational modifications may be either palmitoylation or myristoylation (Linder & Deschenes Citation2007; Wright et al. Citation2010; Moriya et al. Citation2013). Sequence analysis revealed the presence of N-terminal palmitoylation sites in HcCCR1 (SSNGMTVCVTGAGGF) and HcCCR2 (CSNGTTVCVTGAGGF) protein. Protein palmitoylation occurs at the Cys amino acid in the N-terminal region of proteins (Linder & Deschenes Citation2007; Charollais & Van Der Goot Citation2009). In HcCCR1 and HcCCR2, the Cys amino acid is present at the 14th position in the N-terminal region. N-terminal protein myristoylation is prerequisite for protein palmitoylation (Martín & Busconi Citation2001), and protein myristoylation occurs at the Gly amino acid in the N-terminal region. In HcCCR1 and HcCCR2, Gly amino acid is present at the 10th position in the N-terminal region. The presence of a myristoylation and palmitoylation site reflects the fact that both HcCCR homologs possess signal sequences and can be targeted to the plasma membrane under certain circumstances. The subcellular interaction of OsRac1 and OsCCR1 in the plasma membrane vicinity is closely correlated with the results of the present study (Kawasaki et al. Citation2006).
The results of our experiment suggest that, although both H. cannabinus CCR homologs are closely related at the sequence level and only slightly different at the structural level, they have significant differences in expression. The presence of slightly different sequences and structural features may lead to differential function, which might be due to the different mode of action and biochemical properties. The motif (TVCVTGAGGFIASWMVKLLLEKGYIVKGTV) has a sheet-helix-sheet structure (), common to the βαβ-dinucleotide binding fold of NAD (H) and NADP(H)-dependent reductases and dehydrogenases (Larsen Citation2004; Hu et al. Citation2011). HcCCR1 and HcCCR2 have identical NADPH-binding motifs and catalytic domains, but showed differential expression patterns. The TaCCR1 and TaCCR2 also share nearly identical motifs for NADPH-binding and reaction active sites, but showed significant differences in substrate specificity and tissue specific expression (Ma Citation2007). These findings indicate that HcCCR1 and HcCCR2 are two different genes. Previous experiments also showed the diverse role of this gene family within same plant. Multiple homologs of CCR genes can be present in the same plant, even though only a few are involved in developmental lignification, while the rest are backups (Barakat et al. Citation2011). This diverse gene family can be classified as CCR and CCR-like genes, which differ in function and biochemical properties (Raes et al. Citation2003; Barakat et al. Citation2011). For example, Arabidopsis has only two real CCR genes (Zhou et al. Citation2010): AtCCR1, which is involved in developmental lignification, and AtCCR2, which is associated with stress and elicitor response (Raes et al. Citation2003). The ccr1 knockout mutants displayed altered developmental program, dwarf phenotype and reduced lignin contents in Arabidopsis (Mir Derikvand et al. Citation2008). AtCCR1 and AtCCR2 showed differential expression in Arabidopsis upon infection with Xanthomonas campestris, although AtCCR2 showed higher response than AtCCR1 (Lauvergeat et al. Citation2001). The CCR enzymes can use various cinnamoyl-CoA esters as substrates (like ρ-coumaroyl-CoA, caffeoyl-CoA, feruloyl-CoA, 5-hydroxyferuloyl-CoA, and sinapoyl-CoA), each of which can be converted to corresponding cinnamaldehydes. Nevertheless, substrate specificity is highly variable between species, and even within the same species (Barakat et al. Citation2011). For example, Medicago CCR1 shows preference for feruloyl-CoA, whereas CCR2 prefers caffeoyl and 4-coumaroyl CoAs (Zhou et al. Citation2010). Variable substrate preferences were observed in Arabidopsis, wheat and tomato plants as well (Lauvergeat et al. Citation2001; van der Rest et al. Citation2006; Barakat et al. Citation2011). The differences in substrate specificity can lead to different modes of action during cellular events. Similar to biochemical properties, the expression of CCR homologs is highly variable within tissues. For example, wheat ZmCCR1 was ubiquitous, whereas ZmCCR2 was only detected in roots (Pichon et al. Citation1998). Moreover, LeCCR1 was highly expressed in a wide range of organs in tomato plants, whereas LeCCR2 was only expressed in roots and stems (van der Rest et al. Citation2006). Differential expression between CCR homologs was also reported in poplar, aspen, and switchgrass (Li et al. Citation2005; Escamilla-Treviño et al. Citation2010; Barakat et al. Citation2011). The differences in expression patterns between two kenaf homologs indicate their spatiotemporal nature. The CCR homologs also showed variable expression in response to various stresses. Strong upregulation of HcCCR1 at early time points might be the direct effect of wound, SA, and H2O2 stresses, whereas changes in late time points in response to other stresses occurred due to the downstream process of an intricate cellular signaling network. When compared to HcCCR1, HcCCR2 had a slower response for all stresses as it was primarily upregulated at later time points (Ghosh et al. Citation2014). Stress-mediated differential expression among CCR homologs was previously reported. For example, water deficit treatment induced the expression of both homologs in maize, though the response of ZmCCR2 was much higher than that of ZmCCR1 (Fan et al. Citation2006). In Norway spruce, expression of PaCCR2 was more widespread than that of PaCCR1, and its expression was significantly upregulated after treatment with Heterobasidion annosum (Koutaniemi et al. Citation2007).
Phylogenetic diversity and functional differences are common among many lignin biosynthesis genes. In Arabidopsis, there are multiple homologs for PAL, 4CL, C3H, CCoAOMT, F5H, and CAD genes, and their expression pattern, biochemical properties, roles in plant development and stress responses also varied greatly. Different substrate specificity is probably assigned for different spatiotemporal expression of varying isoenzymes in plants (Raes et al. Citation2003), and it has been postulated that these variable expression patterns among homologs are caused by the presence of different cis-regulatory sites in various combinations in their promoters (Raes et al. Citation2003). In addition to well conserved AC-elements, which confer vascular expression of phenylpropanoid genes, other cis-regulatory elements are also present in the promoter (Raes et al. Citation2003). These include A-box, H-box, G-box, and AT-rich sequences, which impart diversity to homologs (Raes et al. Citation2003). In summary, HcCCR1 is a very close homolog of HcCCR2, but they have significantly different expression patterns. Further investigation is required to determine their substrate specificity and promoter elements, which will help to elucidate their modes of action.
Supplemental data
Supplemental data for this article can be accessed at 10.1080/17429145.2015.1050611.
Supplementary_material.docx
Download MS Word (44.2 KB)Acknowledgments
RG carried out the experiments and drafted the manuscript, BC carried out the experiments, JK analyzed the data, MJ revised the manuscript, TKM analyzed the results and drafted the manuscript, and HB conceived the idea and revised the manuscript. All authors read and approved the final manuscript.
Disclosure statement
The authors have no conflicts of interest to declare.
Funding
This work was conducted with the support of the Cooperative Research Program for Agriculture Science & Technology Development (PJ010497) of the Rural Development Administration, Republic of Korea.
References
- Adamson P, Marshall CJ, Hall A, Tilbrook PA. 1992. Post-translational modifications of p21rho proteins. J Biol Chem. 267:20033–20038.
- Bae H, Kim S-H, Kim MS, Sicher RC, Lary D, Strem MD, Natarajan S, Bailey BA. 2008. The drought response of Theobroma cacao (cacao) and the regulation of genes involved in polyamine biosynthesis by drought and other stresses. Plant Physiol Biochem. 46:174–188.
- Barakat A, Yassin NBM, Park JS, Choi A, Herr J, Carlson JE. 2011. Comparative and phylogenomic analyses of cinnamoyl-CoA reductase and cinnamoyl-CoA-reductase-like gene family in land plants. Plant Sci 181:249–257. doi:10.1016/j.plantsci.2011.05.012
- Baucher M, Halpin C, Petit-Conil M, Boerjan W. 2003. Lignin: genetic engineering and impact on pulping. Crit Rev Biochem Mol Biol. 38:305–350. doi:10.1080/10409230391036757
- Boerjan W, Ralph J, Baucher M. 2003. Lignin biosynthesis. Annu Rev Plant Biol. 54:519–546. doi:10.1146/annurev.arplant.54.031902.134938
- Charollais J, Van Der Goot FG. 2009. Palmitoylation of membrane proteins (Review). Mol Membr Biol. 26:55–66. doi:10.1080/09687680802620369
- Cole C, Barber JD, Barton GJ. 2008. The Jpred 3 secondary structure prediction server. Nucleic Acids Res. 36:W197–W201. doi:10.1093/nar/gkn238
- Dempsey J. 1975. Fiber crops. Gainesville, FL: Univ Press Gainesville. p. 203–302.
- Escamilla-Treviño LL, Shen H, Uppalapati SR, Ray T, Tang Y, Hernandez T, Yin Y, Xu Y, Dixon RA. 2010. Switchgrass (Panicum virgatum) possesses a divergent family of cinnamoyl CoA reductases with distinct biochemical properties. New Phytol. 185:143–155.
- Fan L, Linker R, Gepstein S, Tanimoto E, Yamamoto R, Neumann PM. 2006. Progressive inhibition by water deficit of cell wall extensibility and growth along the elongation zone of maize roots is related to increased lignin metabolism and progressive stelar accumulation of wall phenolics. Plant Physiol. 140:603–612.
- Ghosh R, Choi B, Cho B-K, Lim H-S, Park S-U, Bae H-J, Natarajan S, Bae H. 2014. Characterization of developmental- and stress-mediated expression of cinnamoyl-CoA reductase in kenaf (Hibiscus cannabinus L.). Sci World J. 2014:601845.
- Ghosh R, Choi BS, Jeong M, Bae DW, Shin SC, Park SU, Lim H, Kim J, Bae H. 2012. Comparative transcriptional analysis of caffeoyl-coenzyme A 3- O -methyltransferase from Hibiscus cannabinus L., during developmental stages in various tissues and stress regulation. Plant Omics. 5:184–193.
- Hu Y, Di P, Chen J, Xiao Y, Zhang L, Chen W. 2011. Isolation and characterization of a gene encoding cinnamoyl-CoA reductase from Isatis indigotica Fort. Mol Biol Rep. 38:2075–2083. doi:10.1007/s11033-010-0080-8
- Kahsay RY, Gao G, Liao L. 2005. An improved hidden Markov model for transmembrane protein detection and topology prediction and its applications to complete genomes. Bioinformatics. 21:1853–1858.
- Kawasaki T, Koita H, Nakatsubo T, Hasegawa K, Wakabayashi K, Takahashi H, Umemura K, Umezawa T, Shimamoto K. 2006. Cinnamoyl-CoA reductase, a key enzyme in lignin biosynthesis, is an effector of small GTPase Rac in defense signaling in rice. Proc Natl Acad Sci USA. 103:230–235. doi:10.1073/pnas.0509970102
- Kelley LA, Sternberg MJE. 2009. Protein structure prediction on the Web: a case study using the Phyre server. Nat Protoc. 4:363–371. doi:10.1038/nprot.2009.2
- Koutaniemi S, Warinowski T, könen A Kär, Alatalo E, Fossdal CG, Saranpää P, Laakso T, Fagerstedt KV, Simola LK, Paulin L, et al. 2007. Expression profiling of the lignin biosynthetic pathway in Norway spruce using EST sequencing and real-time RT-PCR. Plant Mol Biol. 65:311–328. doi:10.1007/s11103-007-9220-5
- Larkin MA, Blackshields G, Brown NP, Chenna R, McGettigan PA, McWilliam H, Valentin F, Wallace IM, Wilm a, Lopez R, et al. 2007. Clustal W and Clustal X version 2.0. Bioinformatics. 23:2947–2948. doi:10.1093/bioinformatics/btm404
- Larsen K. 2004. Cloning and characterization of a ryegrass (Lolium perenne) gene encoding cinnamoyl-CoA reductase (CCR). Plant Sci. 166:569–581. doi:10.1016/j.plantsci.2003.09.026
- Lauvergeat V, Lacomme C, Lacombe E, Lasserre E, Roby D, Grima-Pettenati J. 2001. Two cinnamoyl-CoA reductase (CCR) genes from Arabidopsis thaliana are differentially expressed during development and in response to infection with pathogenic bacteria. Phytochemistry. 57:1187–1195. doi:10.1016/S0031-9422(01)00053-X
- Li L, Cheng X, Lu S, Nakatsubo T, Umezawa T, Chiang VL. 2005. Clarification of cinnamoyl co-enzyme A reductase catalysis in monolignol biosynthesis of Aspen. Plant Cell Physiol. 46:1073–1082.
- Linder ME, Deschenes RJ. 2007. Palmitoylation: policing protein stability and traffic. Nat Rev Mol Cell Biol. 8:74–84. doi:10.1038/nrm2084
- Löfke C, Luschnig C, Kleine-Vehn J. 2013. Posttranslational modification and trafficking of PIN auxin efflux carriers. Mech Dev. 130:82–94.
- Ma Q-H. 2007. Characterization of a cinnamoyl-CoA reductase that is associated with stem development in wheat. J Exp Bot. 58:2011–2021.
- Martín ML, Busconi L. 2001. A rice membrane-bound calcium-dependent protein kinase is activated in response to low temperature. Plant Physiol. 125:1442–1449.
- Mir Derikvand M, Sierra JB, Ruel K, Pollet B, Do C-T, Thévenin J, Buffard D, Jouanin L, Lapierre C.2008. Redirection of the phenylpropanoid pathway to feruloyl malate in Arabidopsis mutants deficient for cinnamoyl-CoA reductase 1. Planta. 227:943–956. doi:10.1007/s00425-007-0669-x
- Mohanta TK. 2012. Advances in Ginkg biloba research: genomics and metabolomics perpectives. African J Biotech. 11:15936–15944.
- Mohanta TK, Occhipinti A, Zebelo SA, Foti M, Fliegmann J, Bossi S, Massimo EM, Bertea CM. (2012). Ginkgo biloba responds to herbivory by activating early signaling and direct defenses. PLoS One. 7:e32822.
- Moriya K, Nagatoshi K, Noriyasu Y, Okamura T, Takamitsu E, Suzuki T, Utsumi T. 2013. Protein N-myristoylation plays a critical role in the endoplasmic reticulum morphological change induced by overexpression of protein Lunapark, an integral membrane protein of the endoplasmic reticulum. PLoS One. 8:e78235.
- Moura JCMS, Bonine CAV, de Oliveira Fernandes Viana J, Dornelas MC, Mazzafera P. 2010. Abiotic and biotic stresses and changes in the lignin content and composition in plants. J Integr Plant Biol. 52:360–376.
- Pichon M, Courbou I, Beckert M, Boudet AM, Grima-Pettenati J.1998. Cloning and characterization of two maize cDNAs encoding cinnamoyl-CoA reductase (CCR) and differential expression of the corresponding genes. Plant Mol Biol. 38:671–676. doi:10.1023/A:1006060101866
- Raes J, Rohde A, Christensen JH, Van de Peer Y, Boerjan W. 2003. Genome-wide characterization of the lignification toolbox in Arabidopsis. Plant Physiol. 133:1051–1071. doi:10.1104/pp.103.026484
- Ren J, Wen L, Gao X, Jin C, Xue Y, Yao X. 2008. CSS-Palm 2.0: an updated software for palmitoylation sites prediction. Protein Eng Des Sel. 21:639–644.
- Schmittgen TD, Livak KJ. 2008. Analyzing real-time PCR data by the comparative CT method. Nat Protoc. 3:1101–1108. doi:10.1038/nprot.2008.73
- Subramaniam S. 1998. The biology workbench—a seamless database. Proteins. 32:1–2. doi:10.1002/(SICI)1097-0134(19980701)32:1<1::AID-PROT1>3.0.CO;2-Q
- Tamura K, Peterson D, Peterson N, Stecher G, Nei M, Kumar S. 2011. MEGA5: molecular evolutionary genetics analysis using maximum likelihood, evolutionary distance, and maximum parsimony methods. Mol Biol Evol. 28:2731–2739. doi:10.1093/molbev/msr121
- Van der Rest B, Danoun S, Boudet A-M, Rochange SF. 2006. Down-regulation of cinnamoyl-CoA reductase in tomato (Solanum lycopersicum L.) induces dramatic changes in soluble phenolic pools. J Exp Bot. 57:1399–1411. doi:10.1093/jxb/erj120
- Weng J-K, Li X, Bonawitz ND, Chapple C. 2008. Emerging strategies of lignin engineering and degradation for cellulosic biofuel production. Curr Opin Biotechnol. 19:166–172.
- Wilkins MR, Gasteiger E, Bairoch A, Sanchez JC, Williams KL, Appel RD, Hochstrasser DF. 1999. Protein identification and analysis tools in the ExPASy server. Methods Mol Biol. 112:531–552.
- Wright MH, Heal WP, Mann DJ, Tate EW. 2010. Protein myristoylation in health and disease. J Chem Biol. 3:19–35. doi:10.1007/s12154-009-0032-8
- Xu Z, Zhang D, Hu J, Zhou X, Ye X, Reichel KL, Stewart NR, Syrenne RD, Yang X, Gao P, et al. 2009. Comparative genome analysis of lignin biosynthesis gene families across the plant kingdom. BMC Bioinformatics. 10(Suppl. II):S3.
- Zhou R, Jackson L, Shadle G, Nakashima J, Temple S, Chen F, Dixon RA. 2010. Distinct cinnamoyl CoA reductases involved in parallel routes to lignin in Medicago truncatula. Proc Natl Acad Sci USA. 107:17803–17808. doi:10.1073/pnas.0912942107