
 ?Mathematical formulae have been encoded as MathML and are displayed in this HTML version using MathJax in order to improve their display. Uncheck the box to turn MathJax off. This feature requires Javascript. Click on a formula to zoom.
ABSTRACT
The agronomic and physiological traits, drought tolerance indexes, principal component analysis and Ward`s method were applied to assess the differences among 20 wheat genotypes in response to drought. Statistically significant correlation was observed for measured traits. Drought susceptibility index (DSI), stress tolerance index (STI) and stress index (SI) were most useful to identify genotypes differing in their response to drought. Utility of the indexes was confirmed by physiological markers of drought tolerance i.e. membrane injury and leaf water status. Variation of the genotypes in biomass and grain yield during drought stress was also verified by clustering methods. Finally, integration of physiological and statistical methods presented in this work, allows to both, indicate that tolerance to drought in wheat has a common genetic background, and select the most diverse genotypes. Based on the results, we recommend a tool for breeders, useful to select the genotypes resistant and sensitive to drought.
Introduction
It has been shown that the plant responses to environmental stresses depend on the plant species, genotype, and age, level and duration of stress factors, climate and soil conditions. On the other hand, plant susceptibility to the stress is determined by the genetic factors encoding morphological, phenological, physiological, biochemical and molecular traits. The plants have also developed different active mechanisms, which inhibit or alleviate the harmful effects of stresses (Levitt Citation1980; Boyer Citation1982; Asharaf Citation2010; King Citation2011).
Among various environmental stresses, soil drought is the most common environmental phenomenon affecting a plant growth, development, and a main factor limiting a grain yield. It has been shown that 20–25% of the global wheat growing area is exposed to drought and the grain yield reduction ranges from 10% to 76% depending on a plant growth stage and a stress severity. Differences in a tolerance to drought within particular genotypes and plant species were proved in many studies, including wheat (Winter et al. Citation1988; Reynolds et al. Citation1998; Paknejad et al. Citation2007), maize (Martinielio and Lorenzoni Citation1985; Lorens et al. Citation1987; Grzesiak Citation1990; Grzesiak et al. Citation2012), rape seed (Richards Citation1978), oat (Larsson and Górny Citation1988; Marcińska et al. Citation2017), coconut (Gomez et al. Citation2008) and triticale (Royo et al. Citation2000; Grzesiak et al. Citation2012, Citation2017).
The aim of different breeding programs, including wheat, is to apply selection tests to improve quantity, quality and stability of yield under soil drought and furthermore to develop new drought-adapted genotypes. Methods of screening for drought tolerance within a large number of genotypes should be easy, rapid and inexpensive (Hanson and Nelson Citation1985; Palta Citation1990, Evans et al. Citation1991). In field conditions, proper testing can be performed, providing a number of methodological problems is solved in order to control the water content in the soil, i.e. controlled irrigation and/or reduction of a rainfall inflow. The relations between the plant yield obtained under drought and under optimal soil moistening were preferred among the indicators of drought tolerance in a field. Such markers, however, are not accurate enough or they are too simplified to show important relations between the crop developmental processes and soil-water-plant status. In contrast, some suitable quantitative formulas describing the relations in natural conditions were presented in studies by Fischer and Maurer (Citation1978), Hanson and Nelson (Citation1985), Winter et al. (Citation1988), Stanley (Citation1990) and in FAO reports by Doorenbos and Pruit (Citation1977), Doorenbos and Kassam (Citation1986). It was found that Drought Susceptibility Index (DSI), Stress Tolerance Index (STI), and Geometric Mean Productivity index (GMP) are efficient for identification of genotypes with good performance to both, non-stress (control) and stress (drought) conditions (Khalili et al. Citation2004, Golbashy et al. Citation2010). Furthermore, Moghaddam and Hadi-Zadeh (Citation2002) found that stress tolerance index (STI) was also useful in selection of maize genotypes significantly differing in a response under stress and non-stress conditions. In laboratory conditions, the testing method should be characterized by a significant correlation with drought resistance observed in a field (Sullivan and Ross Citation1979; Bouslama and Schapauch Citation1984; Hanson and Nelson Citation1985; Blum Citation1988, Citation1996; Kpoghomou et al. Citation1990; Chaves et al. Citation2002; Grzesiak et al. Citation2012). The important laboratory protocols for screening of drought tolerance in crop plants include e.g. seed germination in osmotic medium (mannitol, PEG), growth or survival of young seedlings subjected to water stress and high temperature stress (Sullivan and Ross Citation1979; Blum and Ebercon Citation1981; Martinielio and Lorenzoni Citation1985; Clarke and McCaig Citation1982; Blum Citation2005), control of membrane injury, leaf water status, leaf temperature and leaf gas exchange (Farquhar et al. Citation1993; Passioura et al. Citation1993; Dubey Citation1997). Other traits that may seem promising as screening tests are various parameters of chlorophyll a fluorescence (Reynolds et al. Citation1998; Hura et al. Citation2007) and association between dark respiration and heat dissipation under drought (Gerik and Eastin Citation1985, Reynolds et al. Citation1998). The numerous publications also pointed out, that root system structure (morphology and anatomy) and water status in a continuum of soil-root-leaf can determine plant survival during drought stress (Yamauchi Citation1993, Masle Citation2002), but in this case plant responses can be modified by intensity of other physiological processes, such as leaf gas exchange, stress-induced membrane injury and symbiosis between the roots and mycorrhizal fungi (Kono et al. Citation1987, Masle Citation2002, Ogawa et al. Citation2014, Grzesiak et al. Citation2017).
A large set of data from screening tests requires a correct statistical analysis to formulate the conclusions concerning tolerant and sensitive genotypes. According to Finlay and Wilkinson (Citation1963), regression analysis was a useful tool in identification of three different adaptation mechanisms to drought conditions in barley genotypes grown at various locations in Australia. The first group of genotypes produced a high yield in conditions of optimal water supply, but showed a drastic reduction in yield under drought. The second group of genotypes had a lower yield in the control conditions, however, the yield reduction during drought was not as significant as in the first group. The third group of genotypes had stable yield under both, control and drought conditions, thus plants have not use favorable water supply conditions to increase the yield. Some other selection tools based on mathematical relationship between stress and non-stress conditions have classified plants in accordance to their responses to four groups: (i) genotypes with good performance in stress and non-stress condition, (ii) genotypes with good performance only in non-stress condition or (iii) genotypes with good performance in only stress condition and (iv) genotypes with weak performance in stress and non-stress conditions (Golbashy et al. Citation2010, Grzesiak et al. Citation2012).
The objective of this study was to evaluate the correlation between selected physiological traits and various drought tolerance indexes for 20 wheat cultivars grown in drought conditions. Measurements of different physiological plant responses to drought allowed to recognize the mechanisms, which abolish or reduce the harmful effects of water deficit in the soil or plant tissues. The purpose of our study was also to demonstrate that on the basis of physiological traits it is possible to select wheat genotypes, which exhibit different tolerance to drought stress as well as determine which tests are most useful for selection of drought-resistant genotypes.
Materials and methods
Plant materials
Experiments were carried out on 20 wheat genotypes: 14 commercial cultivars and 6 breeding forms obtained from DANKO Plant Breeders Ltd; and Smolice Plant Breeders Ltd. IHAR ().
Table 1. Dry matter (DM) and grain yield (GY) of 20 wheat genotypes grown under control (C) and drought stress (D) and ANOVA analyze of variance.
Experimental conditions
The experiment was carried out in a horticulture tent under natural conditions from March 31st to August 16th, 2017. Plants were grown in plastic pots (21 cm high, 13 cm diameter) filled with a mixture of universal potting soil (Holas, Poland) and quartz-sand (Chemoform AG, Germany < 0.1 cm) in proportion 1:2 (v/v). Air-dried soil substrate was sieved through a 0.25 cm mesh. A compaction of soil substrate in pots was 1.3 g cm−3. Field soil water capacity (FWC) for soil mixture was determined according to Kopecky methods. Air-dried soil samples (100 cm3) were placed inside metal cylinders, with a 1 mm hole at the bottom. Cylinders with the samples had been soaked 30 min in a container filled with water. After 8 h, maximal soil water content in the samples was 0.43 (g cm−3) and after next 48 h it decreased to 0.21 (g cm−3). Following Hillel and van Bavel (Citation1976), the values measured after 48 h were assumed to be 100% of soil field water capacity (FWC). For each pot six pre-germinated grains were planted in soil at the depth of 3–4 cm.
Meteorological data (air temperature, relative humidity) was measured continuously by sensors located in the experimental tent. The weather data collected by the data logger were used to establish daily maximum and minimum temperature, relative humidity and the index of Growth Degree-Days (GDD). The concept of GDD assumes that plant growth is related directly to the average daily temperature. The degree-days for each day are summed up, or accumulated throughout the growing season. If the mean daily temperature is equal to or less than the base temperature (for wheat, the base temperature is equal to −5°C) the degree-day value was equals 0 (Edey Citation1977).
where n is the successive days of vegetation with mean daily temperature (tmin + tmax)/2.
Drought stress
Soil drought conditions were achieved by limited watering of the pots, i.e. soil water content was set at the level of 30–35% FWC. Drought treatment (D) had been applied during 5-week period from 28th to 63rd day of plant growth. After this period, soil water content was restored to the level of 65–70% FWC. The control content of soil water (C) was maintained continuously, from sowing to harvest, at the level of 65–70% FWC.
Drought tolerance indexes were calculated on the basis of DM or GY using the following equations (Fischer and Maurer Citation1978; Golbashy et al. Citation2010, Grzesiak et al. Citation2012).
Drought Susceptibility Index (DSI)
Stress Tolerance Index (STI)
Mean Productivity Index (MPRO)
Harmonic Mean Index (MHAR)
Tolerance Index (TI)
Geometric Mean Productivity Index (GMP)
Stress Index (SI)
where C, D – dry matter of aboveground part of the plant (DM) or grain yield (GY) in control (C) and drought (D) treatment, respectively. xC, xD – average values for all examined genotypes of dry mater of aboveground part of the plant (DM) or grain yield (GY) in control (C) and drought (D) treatment, respectively.
Relative trait changes (RTC) was calculated as (C-D)/C
Measurements
Physiological traits: Dry matter of above-ground part of the plants was analyzed directly after drought treatment, whereas plant height (H), number of tillers (NoT), number of leaves on main tiller (NoLMT), number of leaves on adventitious tillers (NoLAT), total leaf number (NoLT), grain yield (GY), number of grains (NoG), and weight of 1000 grains (W-1000) were determinate after plant harvesting. Plants were dried at 65°C for 72 h. For each genotype and treatment data were collected for 9 plants grown in 3 pots.
Leaf greening (SPAD) was measured directly after drought treatment on well-developed leaf using SPAD CL-01 meter (Hansatech, Norfolk, UK).
Leaf water status was determined as a relative water content (RWC), relative turgidity (RT), and water deficit (WD). According to the protocol published by Weatherley (Citation1950) and Barrs (Citation1986) leaf fragments about 5 cm long were collected between 11:00 pm and 1:00 am from most recent fully expanded leaf. Each analysis was performed in 5 biological replicates. Parameters were calculated as it follows:
where fW – fresh weight, dw – dry weight and tw – fully turgid weight measured after 24 h leaf floated in water at 4°C and ambient light.
Relative loss of intracellular electrolytes from leaf tissues (LI-leakage index) was measured with the conductivity meter OK-102/1 (Radelkis, Hungary). Leaf fragments about 7 cm long were taken between 11:00 pm and 1:00 am on most recent fully expanded leaf and incubated in test tubes filled with 30 cm3 redistilled water. After 24 h, initial conductance was measured. Final conductance was measured after autoclaving tubes with leaves at 110o C for 15 min and cooling them to room temperature. There were 5 replicates for each treatments. LI was calculated according to the formula described by Sullivan and Ross (Citation1979) and Blum and Ebercon (Citation1981).
where C and D refer to the conductivity of control (C) and drought (D) treatment, respectively, and subscript 1 and 2 refer to initial and final conductance, respectively.
Statistical analysis
To determine statistical significance of obtained data, ANOVA analysis of variance was performed with STATISTICA 12.0 software (Statsoft, Tulsa, OK, USA). Means were compared using Duncan’s multiple range test at 0.05 level of probability. Provided F-values were significant, linear correlation coefficients together with the probability levels of sensitivity to drought stress indexes were calculated. Principal component analysis (PCA) was applied to assign the ranks to genotypes and to classify which of them were more susceptible or resistant to drought stress. PCA utilizes orthogonal transformation to convert a set of possibly correlated variables into a set of linearly uncorrelated variables called principal components. This transformation is defined in such a way that the first principal component has the largest possible variance. PCA is sensitive to the relative scaling of the original variables. Ward's cluster analysis (WCA) was also applied as a criterion in hierarchical cluster analysis. The nearest-neighbor chain algorithm was used to find the same clustering in time proportional to the size of the input distance matrix and space linear in the number of points being clustered.
Results
Climatic parameters
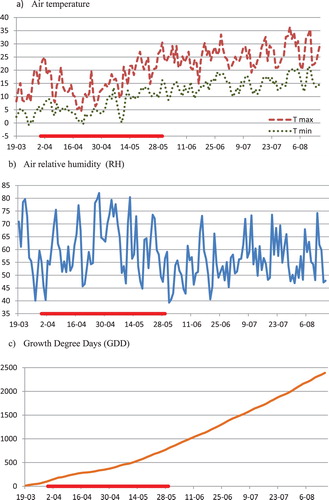
The changes of daily maximum and minimum air temperature, relative humidity (RH) and the values of growth degree days (GDD) are shown in . During the experiment period, the average monthly air temperature values were 8.2°C, 14.0°C, 16.8°C, 18.8°C and 18.1°C, respectively, from April to August 2017. Changes in average monthly air temperature in the period from April to May were similar, and from June to August were higher, in comparison to the long-term norm for the Krakow area (www.weatheronline.pl). The value of the GDD index in the 2017 growing season reached the value of around 2400 and was close to the optimal value for early and moderate – early spring wheat cultivars (McMaster et al. Citation2003).
Figure 1. Changes of daily maximum and minimum air temperature (a), air relative humidity RH (b) and growth degree days GDD (c). Red line on x-axis marks the period of drought.
Morphological and physiological traits
The measured traits for control (C) and drought (D) treatment as well as relative trait change (RTC) are shown in and . In control conditions, the highest values of coefficient of variation (CV > 20%) were observed for dry matter (DM), grain yield (GY), number of tillers (NoT), and number of grains (NoG). Furthermore, values of CV after D for traits DM, NoT, NoLAT, SPAD, GY, NoG and W-1000 were higher than for C ( and ). Results presented as the RTC show statistically significant correlation for DM, GY and NoT, while for the other traits the correlation coefficients were statistically insignificant (). Based on both, RTC for DM and RTC for GY (), distribution of the genotypes have a higher resolution than for only one parameter, due to a range of RTC values for DM was lower (0.13–0.63), while range of RTC values for GY was higher (0.32–0.98). Therefore, the genotypes could be divided into four groups. In the first group, RTC was lower than 0.30 for the genotypes: Tdoz 1508, SMJ 2115, Struna. In the second group, RTC ranged from 0.30–0.50 for genotypes: SMJ 2115, Tdoz 1508, Tonika, Struna, Sharki, Cornetto, Harenda, Ostka smolicka, Tdoz 1384. In the third group, RTC ranged from 0.50 to 0.70 for genotypes: SMJ 1314, Tdoz 1384, Ostka smolicka, Kandela, Tybalt, Tdoz 1403, Mandaryna, Arabella, Jarlanka, SMJ 3016, Harenda, Sharki, Cornetto, Goplana, Telimena, Sirocco. In the fourth group RTC was higher than 0.70 for genotypes Goplana, Tonika, Sirocco, Tdoz 1403, Telimena. Moreover, an interesting interaction between yield of the plants grown under C and D conditions was observed. Telimena, Sirocco, Goplana, Tdoz 1403, and Tonika represent genotypes accumulating the highest dry mass under C conditions, but at the same time, the greatest reduction of dry mass after D was observed. In contrast, SMJ 2115 had significantly lower mean dry mass under C, but at the same time the effect of the drought was minor.
Table 2. Mean values, range of mean, LSD0,05, and coefficient of variation (CV) for the physiological traits of wheat genotypes grown in control (C) and drought (D) conditions.
Table 3. Relative change of measured traits (RTC), mean values, LSD0.05, coefficient of variation (CV) and correlation coefficient for traits of 20 wheat genotypes.
Drought tolerance indexes
On the basis of DM and GY, different drought tolerance indexes were calculated to identify the drought resistant and sensitive genotypes (). Relatively high variability of the coefficient of variation was observed for presented indexes. ANOVA analysis showed also the statistically significant differences between genotypes (G), whereas a significant variability for the treatments (T) and the interactions G x T was not found in the case of all indexes. In , correlation coefficients between different drought tolerance indexes are presented. In most cases, the correlation coefficients proved that indexes provided the suitable criteria for the selection of genotypes. The correlation coefficient between drought tolerance indexes calculated on the basis of DM and GY was statistically significant (r = 0.460) and indicate a similar pattern of variation between indexes calculated for DM (directly after drought) and those calculated for GY (after plant harvesting). Based on DM under the control treatment (), the genotypes were divided into two groups. The group A with high yielding (A > from the genotypic mean value) included Tdoz 1403, Tonika, Sirocco, Telimena, SMJ 1314, Goplana, Mandaryna, Arabella, and SMJ 3016; while the group B with low yielding (B < from the mean genotypic value) included Struna, Tdoz 1508, Kandela, Ostka smolicka, Harenda, Jarlanka, Tybalt, Cornetto, Sharki, SMJ 2115 and Tdoz 1384. Within the group A, drought caused the highest decrease in DM for Sirocco, Telimena and Goplana (40%), and for Tdoz 1403, Arabela, Mandaryna, SMJ 3016 (up to 45%), while the lowest decrease of DM was recorded for Tonica (61%) and SMJ 1304 (53%). In the group B, the highest decrease of DM, up to about 45%, was recorded in Tybalt, Kandela and Jarlanka, and to about 55% in Ostka smolicka, Tdoz 1384, Sharki, Corletto and Harenda. In this group the lowest decrease of DM was recorded in Tdoz 1508 (87%), SMJ 2115 and Struna (75%).
Table 4. Drought tolerance indexes calculated for dry biomass of above-ground plant part (DM) and grain yield (GY) of 20 wheat genotypes grown in control (C) and drought (D) conditions and analyze of variance ANOVA.
Table 5. Linear correlation coefficient between different drought tolerance indexes of wheat genotypes (df = 18).
On the basis of the value of drought tolerance indexes (), it was also possible to ranked genotypes according to their degree of susceptibility to drought within the groups with high (A) or low (B) yielding. DSI, TI and SI indicated Sirocco, Telimena, Arabela as a drought sensitive genotypes in the group A, and Harenda, Jarlanka and Tybalt in the group B; while Tonika and SMJ 1304 as the resistant genotypes in group A, and Tdoz 1508, SMJ 2115, Struna in the group B. The division into resistant and sensitive genotypes based on the STI, MPRO MHAR and GMP indicated Tonica, Todz 1403, Sirocco as drought-resistant genotypes in the group A, and Todz 1508, Struna in the group B, however, only Tdoz 1384, Jarlanka, Tybalt, Sharki and Cornetto from the group B were classified as drought sensitive genotypes.
Principal component analysis (PCA) and Ward’s cluster analysis (WCA)
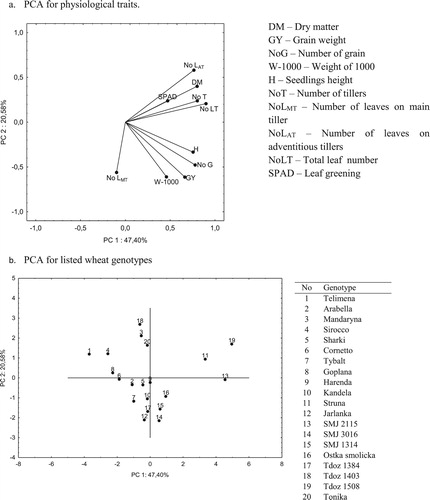
PCA analysis was used to identify resistant and sensitive genotypes among drought-stress treated plants. The orthogonal transformation was defined in such a way that the first principal component has the largest variance. According to physiological traits in the PCA analysis ((a,b)), the first factor (PC1) explains 47,4% of the total variance of variables, and the second factor (PC2) about 20,6%. In total, both PCs explain 68,0% of the total variance of all analyzed variables. The biplot analysis showed the correlation between stress index (SI) calculated for all of the examined traits ((a)). The sharp angle means a positive correlation between the measured parameters, the obtuse angle – negative, while the right angle means no correlation between the parameters. Positive correlation was recorded among of dry matter (DM) with all traits except NLMT and W-1000 and among grain yield (GY) with all traits except NLAT. Furthermore, PCA analysis allowed to group wheat genotypes according to their phenotypic similarities ((b)). Group I (the highest PC1 and PC2) includes: Struna and Tdoz 1508; group II (the highest PC1 and the lowest PC2) Ostka smolicka, SMJ 2115, SMJ 3016 and SMJ 1314; group III (the lowest PC1 and PC2) Arabella, Sharki, Cornetto, Tybalt, Harenda, Kandela, Tdoz 1384, and Jarlanka; and group IV (the lowest PC1 and the highest PC2) consisted genotype Telimena, Sirocco, Goplana, Mandaryna, Tdoz 1403, and Tonika.
Figure 2. Principal component analysis (PCA) for physiological traits (a) and genotypes (b) based on stress indexes calculated for physiological traits.
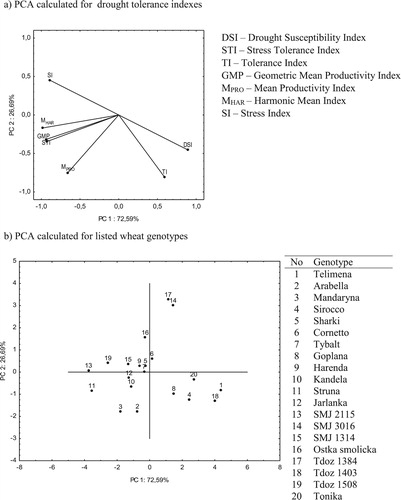
The PCA was also carried out for seven different drought tolerance indexes calculated for DM ((a,b)). The first factor of PCA analysis explains about 72.6% of the total variance of variables, and the second factor about 26.7%. In total, both main axes explain 99.0% of the total variance of all analyzed variables. Positive correlation was observed among the drought susceptibility index (DSI) only with TI, stress tolerance index (STI) with GMP, MPRO, MHAR and SI, tolerance index (TI) only with MPRO, geometric mean productivity (GMP) with MPRO and MHAR, mean productivity index (MPRO) with MHAR and SI and harmonic mean index (MHAR) with SI ((a)). According to PCA analysis wheat genotypes were classified into 4 groups ((b)). Group I (the highest PC1 and PC2) consisted genotypes Cornetto, SMJ 3016, Tdoz 1314, group II (the highest PC1 and the lowest PC2) consisted Telimena, Sirocco, Goplana, Tdoz 1403, Tonika; group III (the lowest PC1 and PC2) consisted Arabella, Mandaryna, Kandela, Struna, Jarlanka; and group IV (the lowest PC1 and the highest PC2) consisted SMJ 2115, Sharki, Tybelt, Harenda, SMJ 1314, Ostka smolicka and Tdoz 1508.
Figure 3. Principal component analysis (PCA) of drought tolerance indexes for (a) dry biomass (DM) and (b) genotypes.
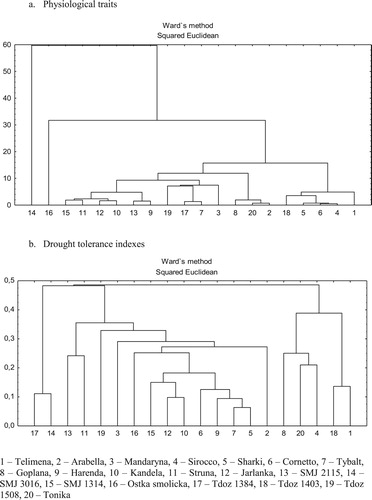
The WCA was performed based on SI calculated for physiological traits ((a)) and seven drought tolerance indexes ((b)). The wheat genotypes were clustered and presented in a dendrogram, and the distance between two clusters indicates the similarity of the genotypes. The genotypes classified as drought-sensitive i.e. Telimena, Sirocco, Sharki, Tdoz 1403 were located close to each other on the dendrogram. Similar trend was observed for drought-resistant genotypes, i.e. Struna, SMJ 2115 and Tdoz 1508 ((a)). However, the WCA for seven drought tolerance indexes indicates the possibility of dividing genotypes into two groups ((b)). The first group includes the genotypes classified as drought-sensitive i.e. Telimena, Sirocco, Goplana, Tdoz 1403 and Tonica. They had the highest DSI among genotypes. The second group, including Struna, SMJ 2115 and Tdoz 1508 genotypes, located close to each other on dendrogram, were characterized by lower DSI and small difference in DM ().
Figure 4. Dendrogram of 20 wheat genotypes resulting from cluster analysis (Ward’s methods) of stress index (SI) calculated for physiological traits (a) and drought tolerance indexes (b).
Leakage index (LI) and leaf water status (RWC, RT, WD)
For selected drought sensitive (Telimena, Sirocco, Goplana) and resistant (Struna, SMJ 2115, Tdoz 1508) genotypes we carried out measurements of membrane injury and 3 different parameters of leaf water status (, ). In group of drought sensitive genotypes, values of initial leakage were higher about 4 times after drought stress as compared to control conditions, whereas in a group of drought-resistant genotypes the values increased about 3 times. Changes in final leakage between drought sensitive and resistant genotypes were slight. As a consequence, values of membrane injury (LI) in the group of drought sensitive genotypes were about 2 times higher than for the group of drought-resistant genotypes. For the same genotypes, differences between sensitive and resistant ones in RWC were slight. Under control condition, RWC of sensitive genotypes was 72% and drought-resistant genotypes about 77%. Drought decreased RWC about 10% in the group sensitive genotypes and about 12% in the group of drought-resistant genotypes. Similarly, RT in seedlings grown in control conditions was about 79% and 82%, in the group drought sensitive and resistant genotypes, respectively. In the group of drought sensitive genotypes, decrease of RT in drought stressed seedlings was about 23%, whereas in the group of drought-resistant genotypes about 16%. These changes in RT significantly influenced leaf water deficit (WD). In the group of drought sensitive genotypes, WD was higher than in drought-resistant genotypes, for both control and drought treatment. Statistical significant correlation was found between LI and each following parameter DM, GY, DSI and also between RWC and RT, WD.
Figure 5. The photographs of 11-week-old wheat plants grown in control (C) or drought (D) conditions. Telimena, Sirocco and Goplana were selected as drought-sensitive genotypes and Struna, SMJ 2115 and Tdoz 1508 as drought-resistant genotypes.
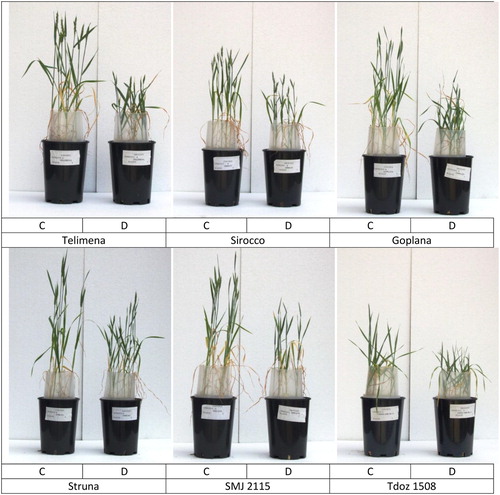
Table 6. Membrane injury (LI), leaf water status (RWC, RT, WD) and linear correlation coefficient for 6 wheat genotypes. Mean values (n = 5) ± SE (df = 4).
Discussion
Global climate change has a negative impact on world ecosystems and the global economy (Hanson and Nelson Citation1985; McKersie and Leshem Citation1994; Ashraf Citation2010). Since 2000, there has been observed a decrease in yield of crops, including rice, wheat, and maize. Following climate changes, scientists and breeders are continually improving genotypes of crop plants in terms of plant tolerance for drought by both, traditional selection methods and genetic engineering (Hanson and Nelson Citation1985; Blum Citation1996; Ehlers and Goss Citation2003; Jackson and Ram Citation2003; Fleury et al. Citation2010). The current research concerning plant tolerance to drought focuses mainly on traits and mechanisms that can be modified. Despite trends in science, improved agronomy practices, and developed methodology, the progress in the research related to the drought stress is slower than expected, and scientific assumptions fail in the natural environment. The tolerance of plants to drought stress is a complex feature, and finding suitably dedicated phenotypes by their exposure to stress in natural conditions, or their treatment to simultaneously or sequentially occurring stress in laboratory conditions is very difficult. The next and perhaps the most important reason of the lack of success is the fact that the genotype itself is not the only factor determining the survival in suboptimal conditions (Palta Citation1990; Mittler Citation2006; Wang et al. Citation2003).
In many research, mathematic formulas and statistical methods (drought tolerance indexes, correlation between biomass or grain yield and physiological traits, biplot analysis) were used to identify the genotypes responding to drought stress condition (Drikvand et al. Citation2012; Marcińska et al. Citation2017). The available formulas related to the drought stress were published in reports: Fischer and Maurer (Citation1978); Golbashy et al. (Citation2010); Doorenbos and Pruit (Citation1977), Doorenbos and Kassam (Citation1986) Grzesiak et al. (Citation2012). Similarly, in many studies on drought tolerance in cereals, rankings of resistant/sensitive genotypes were created for wheat (Ahmadizadeh et al. Citation2002; Talebi et al. Citation2009; Geravandi et al. Citation2011), maize (Golbashy et al. Citation2010, Khayatnezhad et al. Citation2011; Grzesiak et al. Citation2012), triticale (Grzesiak et al. Citation2012), and oat (Akcura and Ceri Citation2011; Hisir et al. Citation2012; Rabiei et al. Citation2012). On the other hand, the effectiveness of different physiological tests has not been definitely confirmed during the evaluation of drought tolerance degree (Hanson and Nelson Citation1985; Bandurska and Stroiński Citation2003).
The wheat genotypes used in our experiments show a relatively wide range of drought tolerance. In this study, differences and interactions between the physiological traits and drought tolerance indexes were found in spring wheat genotypes grown under non-stress vs drought stress conditions ( and ). We have shown the existence of genetic variation of a drought sensitivity degree and the possibility of selection of favorable genotypes. Using our tests and analyses, it seems to be possible to distinguish groups of wheat genotypes with a low, moderate and high susceptibility to drought. We found the genotypes that produced stably high yield of biomass (DM) and grain (GY) in both, drought and control conditions, semi-stable genotypes producing lower DM and GY, and highly sensitive genotypes with the lowest DM and GY. The stable genotypes had lower DSI, when compared to semi-stable or sensitive ones. Similarly to other authors’ results, our data confirm the observations that DSI, STI and SI are useful in order to select suitable genotypes under control and drought conditions. Furthermore, index of geometric mean productivity (GMP) enable selection of the genotypes with high yield in both treatments. Statistical analysis PCA and WCA confirmed strong correlation between DSI, the number and dry weight of grain, and production of different yield components. Last but not least, the analysis allowed to select the groups of genotypes differing in resistance/sensitivity to drought stress. These findings were consistent with earlier studies (Golabadi et al. Citation2006; Mohammadi et al. Citation2010) conducted on wheat and mung bean (Zabet et al. Citation2003), as well as triticale and maize genotypes (Grzesiak et al. Citation2012).
Moreover, different plant traits can be used for a genotype screening, and to determine genotypic tolerance to stress. Biomass, grain yield, plant height, number of tillers, area and number of leaves, and leaf greening were used for this purpose in our experiments, and they were proved as a highly correlated. For example, the decrease of plant height and leaf area was related to reduction of yield.
Dehydration of plants tissues impairs various physiological processes, especially the changes in leaf water potential and photosynthesis. Decrease in leaf water content initially induces a stomatal closure, resulting in a decrease in the supply of CO2 to the mesophyll cells and subsequently in a decrease in the rate of photosynthesis (Williams et al. Citation1999; Lawlor and Cornic Citation2002). Other mechanisms induced under prolonged or severe drought can include changes in chlorophyll synthesis, functional and structural changes in chloroplasts, disturbance in accumulation and distribution of assimilation products (Berkowitz et al. Citation1983; Cornic and Masacci Citation1996; Muller and Whitsitt Citation1996; Medrano et al. Citation2002; Flexas and Medrano Citation2002). However, there is a controversy, whether drought limits photosynthesis due to leaf water status, stomatal closure, metabolic impairment, or injuries to photosynthetic apparatus. Studies of different author, show also that the biomass accumulation and changes in yield traits were associated with an increase in efficiency of PS II (Lichtenthaler and Babani Citation2004; Lichtenthaler et al. Citation2005; Hura et al. Citation2007; Liang et al. Citation2010, Rapacz et al. Citation2010). According to Souza et al. (Citation2004), photosystem PSII is relatively resistant to water deficit, and the photochemical reaction are inhibited only in the prolonged drought. Some authors indicate that the stabilization of the PSII complex depends on an increase in concentration of osmotically active substances. The osmotic adjustment of cells was shown to maintain photosynthesis during drought (Shangguan and Shao Citation1999). Drought causes reduction in the amount of chlorophyll and the disruption of thylakoid membranes (Wright et al. Citation2009; Zhang et al. Citation2011). In response to drought, plants exhibit uncontrolled generation of reactive oxygen species (ROS) in cells and disturbances in the electron transport in the respiratory chain and in the light phase of photosynthesis (Starck Citation2005). ROS can also influence membrane lipid photoinhibition. In this work, the results of the number of tillers (NoT) and leaves (NoLMT, NoLAT, NoLT) indicate that within the wheat genotypes there are different strategies to counteract the harmful effects of drought. In optimal conditions, the plants maintain the most favorable relations between the size of the assimilation surface, transpiration and chlorophyll content in order to keep photosynthesis at an optimal level. In drought conditions, plants reduce the number and area of the leaves by inhibiting the growth of the leaf surface and limiting their number, e.g. by leaf drying and falling off. The results presented in indicate a drastic decrease in GY in the drought-sensitive genotypes (Telimena, Sirocco, Goplana), which was accompanied by a relative reduction of about 50% tillers and about 30% leaves. In contrast, in drought-resistant genotypes (Struna, SMJ 2115, Tdoz 1508) yield reduction was significantly lower than in sensitive genotypes, and was accompanied by a relatively higher or similar number of tillers and the number of evolved leaves. In our earlier work, we also found the importance of the ratio of aboveground parts to the roots (Grzesiak et al. Citation2012). In drought-resistant genotypes of maize and triticale subjected to the drought, these relation was similar to the level of control plants, whereas the susceptible genotypes had higher ratio due to reduced mass and number of roots (Grzesiak et al. Citation2012).
Conductometric measurement of membrane injury (LI) was applied as a screening test for the estimation of tolerance to various stresses (Blum and Ebercon Citation1981; Palta Citation1990). The ability to maintain the structure and function of cytoplasmatic membranes under water deficit is one of the most important physiological traits. Differences between sensitive and resistant genotypes might result from the fact that drought-resistant genotypes possess more efficient mechanisms protecting membrane function and structure by stronger binding of molecules to the membrane lipid-protein complex (Smirnoff and Colombe Citation1988; Szechyńska-Hebda et al. Citation2016). Drought causes a loosening of lamellar membranes in chloroplasts, certain amount of grana, and increase in the level of coarse grain matrix (Haupt-Harting and Fock Citation2002; Lawlor and Cornic Citation2002; Tang et al. Citation2002). Both, our results and other authors’ results indicate that measurements of electrolyte leakage from plant tissues are an effective method of assessing the degree of sensitivity to drought stress. In these studies we showed high statistical significant correlations between the degree of sensitivity of various wheat genotypes with the membrane damage (LI). For the genotypes sensitive to drought (Telimena, Sirocco, Goplana) LI values were about two times higher than in the genotypes resistant to drought (Struna, SMJ 2115, Tdoz 1508). This confirms that stress-resistant genotypes can develop more effective mechanisms to protect the structure and function of membranes than stress-sensitive genotypes.
PCA and WCA were a better approach than a linear correlation in the identification of genotypes resistant and sensitive to stress both, in our research, and studies of other authors (Talebi et al. Citation2009; Zhang et al. Citation2011; Parihar et al. Citation2012; Zaheri and Bahraminejad Citation2012; Nouraein et al. Citation2013). According to Iezzoni and Pritts (Citation1991) PCA analysis simplify and reduces a large data set to a small number of unrelated groups of variables, which can be scored along independent, linear axes. Variables strongly associated in the same group may share some underlying biological relationship. The response of the groups of variables to imposed conditions can be quantified using a combination of PCA analysis and univariate statistics. Therefore, PCA analysis has been used successfully to develop novel hypotheses, and to understand the response of complex traits to imposed treatments. Our results shown that the clustering of the genotypes into groups differing in drought tolerance on the basis of PCA was on the whole similar to the results obtained from WCA. The PCA and WCA allowed to separate the groups of similarity and thus indicated that tolerance to drought in spring wheat has a common genetic background.
Conclusion
Our results confirm the existence of a wide range of genotypic variability in response to drought in cereal plants. In wheat, similarly to other crop plants, the physiological origins for this variability have not as yet been fully recognized and explained. It is a widely shared opinion that the breeding of drought-resistant crop plants will not be an easy task. Breeders are interested in improving drought resistance, while maintaining high quantity and quality of yield. Our studies contribute to the understanding of responses of different spring wheat genotypes to drought on basic of the determination of different drought tolerance indexes and physiological traits. Thus, it can be assumed that the tests performed in this work may serve as useful tools in estimating the degree of tolerance to drought stress in wheat. Physiological laboratory methods i.e. membrane injury and leaf water status were simple tools, useful in evaluation of plant responses to drought stress. Together with PCA and WCA this traits can be used as a suitable method for studying the complex resistance mechanisms and to increase yield efficiency in breeding programs. However, the variability of the groups of genotypes determined by both, PCA and WCA should by verified by physiological and molecular experiments in natural growth conditions.
Acknowledgments
We are thankful to for providing wheat genotypes dr Zofia Banaszak, Małgorzata Niewińska and Bogusława Lugowska from DANKO Plant Breeders Ltd; and dr Jarosław Bojarczuk from Smolice Plant Breeders Ltd IHAR.
Disclosure statement
No potential conflict of interest was reported by the authors.
ORCID
Maciej T. Grzesiak http://orcid.org/0000-0003-0743-2095
Magdalena Szechyńska-Hebda http://orcid.org/0000-0002-6041-6521
Additional information
Funding
References
- Ahmadizadeh M, Valizadeh M, Shahbazi H, Nori A. 2002. Behavior of durum wheat genotypes under normal irrigation and drought stress conditions in the greenhouse. Afr J Biotechnol. 11:1912–1923.
- Akcura M, Ceri S. 2011. Evaluation of drought tolerance indices for selection of Turkish oat (Avena sativa L.) landraces under various environmental conditions. Žemdirbystė Agric. 98:157–166.
- Asharaf M. 2010. Inducing drought tolerance in plants: recent advances. Biotech Adv. 28:199–238. doi: 10.1016/j.biotechadv.2009.11.007
- Bandurska H, Stroiński A. 2003. ABA and proline accumulation in leaves and roots of wild (Hordeum spontaneum) and cultivated (Hordeum vulgare Maresi) barley genotypes under water deficit conditions. Acta Physiol Plant. 25:55–61. doi: 10.1007/s11738-003-0036-x
- Barrs HD. 1986. Determination of water deficit in plant tissues. In: Kozlowski TT, editor. Water deficit and plant growth. Vol.1. New York: Academic Press; p. 235–368.
- Berkowitz GA, Chen C, Gibbs M. 1983. Stromal acidification mediates in vivo water stress inhibition of nonstomatal controlled photosynthesis. Plant Physiol. 72:1123–1126. doi: 10.1104/pp.72.4.1123
- Blum A. 1988. Plant breeding for stress environments. Boca Raton (FL): CRC Press.
- Blum A. 1996. Crop response to drought and the interpretation of adaptation. Plant Growth Regul. 20:57–70. doi: 10.1007/BF00024010
- Blum A. 2005. Drought resistance, water use efficiency, and yield potential are they compatible, dissonant, or mutually exclusive? Austr J Agric Res. 56:1159–1168. doi: 10.1071/AR05069
- Blum A, Ebercon A. 1981. Cell membrane stability as a measure of drought and heat tolerance in wheat. Crop Sci. 21:43–47. doi: 10.2135/cropsci1981.0011183X002100010013x
- Bouslama M, Schapauch WT. 1984. Stress tolerance in soybean. I. Evaluation of three screening techniques for heat and drought tolerance. Crop Sci. 24:933–937. doi: 10.2135/cropsci1984.0011183X002400050026x
- Boyer JS. 1982. Plant productivity and environment. Science. 218:443–448. doi: 10.1126/science.218.4571.443
- Chaves MM, Pereira JS, Maroco J, Rodrigues ML, Ricardo CPP, Osorio LM, Carvalho I, Faria T, Pinheiro C. 2002. How plants cope with water stress in the field? Photosynthesis and growth. Ann Bot. 89:907–916. doi: 10.1093/aob/mcf105
- Clarke JM, McCaig TN. 1982. Evaluation of techniques for screening for drought resistance in wheat. Crop Sci. 22:503–506. doi: 10.2135/cropsci1982.0011183X002200030015x
- Cornic G, Massacci A. 1996. Leaf photosynthesis under drought stress. In: Baker N.R., editor. Photosynthesis and the Environment. Dordrecht: Kluwer Academic; p. 347–366.
- Doorenbos J, Kassam AH. 1986. Yield response to water. FAO irrigation and drainage paper. Rome: Food and Agriculture Organization of the United Nations.
- Doorenbos J, Pruit WO. 1977. Guidelines for predicting crop water requirements. FAO irrigation and drainage paper. Rome: Food and Agriculture Organization of the United Nations.
- Drikvand R, Doosty B, Hosseinpour T. 2012. Response of rainfed wheat genotypes to drought stress using drought tolerance indices. J Agric Sci. 4:126–131.
- Dubey R. 1997. Photosynthesis in plants under stressful conditions. In: Pessarakli M, editor. Handbook of photosynthesis. Tuscon/New York: University of Arizona/Marcel Dekker; p. 859–875.
- Edey SN. 1977. Growing degree days and crop production in Canada. Agriculture Canada Publication 1635, Ottawa.
- Ehlers W, Goss M. 2003. Water Dynamics in Plant Production. Wallingford: CABI Publishing.
- Evans RO, Skagss RW, Sneed RE. 1991. Stress day index models to predict corn and soybean relative yield under high water table conditions. Trans ASAE. 5:1997–2005. doi: 10.13031/2013.31829
- Farquhar GD, Wong SC, Evans JR, Hubiek KT. 1993. Photosynthesis and gas exchange. In: Jones HG, Flowers TJ, Jones MB, editor. Plants under stress. New York: Cambridge University Press; p. 47–70.
- Finlay KW, Wilkinson GN. 1963. The analysis of adaptation in a plant-breeding programme. Aust J Agrie Res. 14:742–754. doi: 10.1071/AR9630742
- Fischer RA, Maurer R. 1978. Drought resistance in spring wheat cultivars. I. Grain yield response. Aust J Agric Res. 29:897–907. doi: 10.1071/AR9780897
- Fleury DS, Kuchel H, Langridge P. 2010. Genetic and genomic tools to improve drought tolerance in wheat. J Exp Bot. 61:3211–3222. doi: 10.1093/jxb/erq152
- Flexas J, Medrano H. 2002. Energy dissipation in C3 plants under drought. Funct Plant Biol. 29:1209–1215. doi: 10.1071/FP02015
- Geravandi M, Farshadfar E, Kahrizi D. 2011. Evaluation of some physiological traits as indicators of drought tolerance in bread wheat genotypes. Russ J Plant Physiol. 58:69–75. doi: 10.1134/S1021443711010067
- Gerik TJ, Eastin JD. 1985. Temperature effects on dark respiration among diverse sorghum genotypes. Crop Sci. 25:957–961. doi: 10.2135/cropsci1985.0011183X002500060014x
- Golabadi MA, Arzani SA, Maibodym M. 2006. Assessment of drought tolerance in segregating populations in durum wheat. Afr J Agric Res. 1:162–171.
- Golbashy M, Ebrahimi M, Khorasani SK, Choucan R. 2010. Evaluation of drought tolerance of some corn (Zea mays L.) hybrids in Iran. Afr J Agric Res. 5:2714–2719.
- Gomez F, Oliva MA, Mielke MS, de_Almeida AAF, Leita HG, Aquino LA. 2008. Photosynthetic limitations in leaves of young Brazilian Green Dwarf coconut (Cocos macifera L. ‘‘nana’’ palm under well-watered conditions or recovering from drought stress. Environ Exp Bot. 62:195–204. doi: 10.1016/j.envexpbot.2007.08.006
- Grzesiak S. 1990. Reaction to drought of inbreds and hybrids of maize (Zea mays L.) as evaluated in field and greenhouse experiments. Maydica. 35:303–331.
- Grzesiak MT, Hura K, Jurczyk B, Hura T, Rut G, Szczyrek P, Grzesiak S. 2017. Physiological markers of stress susceptibility in maize and triticale under different soil compaction and/or soil water contents. J Plant Interaction. 12:355–372. DOI: 10.1080/17429145.2017.1370143.
- Grzesiak MT, Marcińska I, Janowiak F, Rzepka A, Hura T. 2012. The relationship between seedling growth and grain yield under drought conditions in maize and triticale genotypes. Acta Physiol Plant. 34:1757–1764. doi: 10.1007/s11738-012-0973-3
- Hanson AD, Nelson ChE. 1985. Water adaptation of crop to drought. In: Carlson PS, editor. The biology of crop productivity. New York: Academic Press; p. 79–149.
- Haupt-Herting S, Fock HP. 2002. Oxygen exchange in relation to carbon assimilation in water-stressed leaves during photosynthesis. Ann Bot. 89:851–859. doi: 10.1093/aob/mcf023
- Hillel D, van Bavel CHM. 1976. Simulation of profile water storage as related to soil hydraulic properties. Soil Sci Soc Am J. 40:807–815. doi: 10.2136/sssaj1976.03615995004000060009x
- Hisir Y, Kara R, Dokuyucu T. 2012. Evaluation of oat (Avena sativa L.) genotypes for grain yield and physiological traits. Žemdirbystė Agric. 99:55–60.
- Hura T, Hura K, Grzesiak MT, Rzepka A. 2007. Effect of long-term drought stress on leaf gas exchange and fluorescence parameters in C3 and C4 plants. Acta Physiol Plant. 29:103–113. doi: 10.1007/s11738-006-0013-2
- Iezzoni AF, Pritts MP. 1991. Applications of principal component analysis to horticultural research. HortScience. 26:334–338. doi: 10.21273/HORTSCI.26.4.334
- Jackson MB, Ram PC. 2003. Physiological and molecular basis of susceptibility and tolerance of rice plants to complete submergence. Annals of Botany. 91:227–241. doi: 10.1093/aob/mcf242
- Khalili M, Kazemi M, Moghaddam A, Shakiba M. 2004. Evaluation of drought tolerance indices at different growth stages of late-maturing corn genotypes. Proceedings of the 8th Iranian Congress of Crop Science and Breeding, Rasht. p. 298.
- Khayatnezhad M, Hasanuzzaman M, Gholamin R. 2011. Assessment of yield and yield components and drought tolerance at end-of season drought condition on corn hybrids (Zea mays L.). Afr J Crop Sci. 5:493–500.
- King J. 2011. Reaching for the sun. How plant work. Part IV Stress, defense, and decline. Cambridge: Cambridge University Press; p. 185–244.
- Kono Y, Yamauchi A, Kawamura AN, Tatsumi J. 1987. Interspecific differences of the capacities of waterlogging and drought tolerance among summer cereals. Jpn J Crop Sci. 56:115–129. doi: 10.1626/jcs.56.115
- Kpoghomou BK, Sapra VT, Beyl CA. 1990. Screening for drought tolerance: soybean germination and its relationship to seedling response. J Agron Crop Sci. 164:153–159. doi: 10.1111/j.1439-037X.1990.tb00801.x
- Larsson S, Górny AG. 1988. Grain yield and drought resistance indices of oat cultivars in field rain shelter and laboratory experiments. J Agron Crop Sci. 161:277–286. doi: 10.1111/j.1439-037X.1988.tb00668.x
- Lawlor DW, Cornic G. 2002. Photosynthetic carbon assimilation and associated metabolism in relation to water deficits in higher plans. Plant Cell Environ. 25:275–294. doi: 10.1046/j.0016-8025.2001.00814.x
- Levitt J. 1980. Response of plants to environmental stresses. New York (NY): Academic Press.
- Liang Y, Zhang K, Zhao L, Liu B, Meng Q. 2010. Identification of chromosome regions conferring dry matter accumulation and photosynthesis in wheat (Triticum aestivum L.). Euphytica. 171:145–156. doi: 10.1007/s10681-009-0024-3
- Lichtenthaler HK, Babani F. 2004. Light adaptation and senescence of the photosynthetic apparatus. Changes in pigment composition, chlorophyll fluorescence parameters and photosynthetic activity. In: Papageorgiou GC, Govindjee G, editor. Chlorophyll a fluorescence, a signature of photosynthesis. Dordrecht: Springer; p. 713–736.
- Lichtenthaler HK, Langsdorf G, Lenk S, Buschmann C. 2005. Chlorophyll fluorescence imaging of photosynthetic activity with the flash-lamp fluorescence imaging system. Photosynthetica. 43:355–369. doi: 10.1007/s11099-005-0060-8
- Lorens GF, Bennett JM, Loggale LB. 1987. Differences in drought resistance between two corn hybrids. I. Water relations and root length density. Agron J. 79:802–807. doi: 10.2134/agronj1987.00021962007900050009x
- Marcińska I, Czyczyło-Mysza I, Skrzypek E, Grzesiak M, Popielarska-Konieczna M, Warchoł M, Grzesiak S. 2017. Application of photochemical parameters and several indices based on phenotypical traits to assess intraspecific variation of oat (Avena sativa L.) tolerance to drought. Acta Physiol Plant. 39:153. doi: 10.1007/s11738-017-2453-2
- Martinielio P, Lorenzoni C. 1985. Response of maize genotypes to drought tolerance tests. Maydica. 30:361–370.
- Masle J. 2002. High soil strength: mechanical forces at play on root morphogenesis and in root: shoot signaling. In: Waisel Y, Eshel A, Kafkafi U, editor. Plant roots the hidden half. New York (NY): Marcel Dekker; p. 807–819.
- McKersie BD, Leshem YY. 1994. Stress and stress cooping in cultivated plants. Dordrecht: Kluwer Academic Publishers.
- McMaster GS, Wilhelm WW, Palic DB, Porter JR, Jamieson PD. 2003. Spring wheat leaf appearance and temperature: extending the paradigm? Ann Bot. 91:697–705. doi: 10.1093/aob/mcg074
- Medrano H, Escalona JM, Bota J, Gulias J, Flexas J. 2002. Regulation of photosynthesis of C3 plants in response to progressive drought: stomatal conductance as a reference parameter. Ann Bot. 89:895–905. doi: 10.1093/aob/mcf079
- Mittler R. 2006. Abiotic stress, the field environment and stress combination. Trends plants science. 11:15–19. doi: 10.1016/j.tplants.2005.11.002
- Moghaddam A, Hadizadeh MH. 2002. Response of corn hybrids and their parental lines to drought using different stress tolerant indices. Iranian J Seed Seedling. 18:256–272.
- Mohammadi R, Armion M, Kahrizi D, Amri A. 2010. Efficiency of screening techniques for evaluating durum wheat genotypes under mild drought conditions. Int J Plant Prod. 4:11–24.
- Muller JE, Whitsitt MS. 1996. Plant cellular response to water deficit. Plant Growth Regul. 20:41–46.
- Nouraein M, Mohammadi SA, Aharizad S, Moghaddam M, Sadeghzadeh B. 2013. Evaluation of drought tolerance indices in wheat recombinant inbred line population. Ann Biol Res. 4:113–122.
- Ogawa S, Valencia MO, Ishitani M, Selvaraj MG. 2014. Root system architecture variation in response to different NH4 concentrations and its association with nitrogen-deficient tolerance traits in rice. Acta Physiol Plant. 36:2361–2372. doi: 10.1007/s11738-014-1609-6
- Paknejad F, Nasri M, Moghadam HRT, Zahedi H, Alahmadi MF. 2007. Effects of drought stress on chlorophyll fluorescence. Acta Physiol Plant. 35:549–565.
- Palta JP. 1990. Stress interactions at the cellular and membrane level. Hort Sci. 25:1337–1381.
- Parihar AK, Godawat SL, Singh D, Parihar CM, Mangi L. 2012. Behavior of quality protein maize (QPM) genotypes under well irrigated and water stress conditions in subtropical climate. Maydica. 57:293–299.
- Passioura JB, Condon AG, Richards RA. 1993. Water deficits, the development of leaf area and crop productivity. In: Smith JAC, Griffiths H, editor. Water deficits plant responses from cell to community. Oxford: BIOS Scientific Publishers; p. 253–264.
- Rabiei E, Khodambashi M, Pirbalouti GA. 2012. The study of the drought tolerance indices of oat (Avena sativa L.). J Food Agric Environ. 10:646–648.
- Rapacz M, Kościelniak J, Jurczyk B, Adamska A, Wójcik M. 2010. Different patterns of physiological and molecular response to drought in seedlings of malt- and feed-type barleys (Hordeum vulgare). J Agron Crop Sci. 196:9–19. doi: 10.1111/j.1439-037X.2009.00389.x
- Reynolds MP, Singh RP, Ibrahim A, Agech OAA, Larque-Saavedra A, Quick JS. 1998. Evaluation physiological traits to complement empirical selection for wheat in warm environments. Euphytica. 100:84–95. doi: 10.1023/A:1018355906553
- Richards RA. 1978. Variation between and within species of rapeseed (Brassica campestris and B. napus) in response to drought stress. III. Physiological and physicochemical characters. Aust J Agric Res. 29:495–501.
- Royo C, Abaza M, Bianco R, del Moral LFG. 2000. Triticale grain growth and morphometry as affected by drought stress, late sowing and simulated drought stress. Aust J Physiol. 27:1051–1059.
- Shangguan ZP, Shao MA. 1999. Physiological mechanism for improving crop water use in arid region. J Hydraul Eng. 10:33–37.
- Smirnoff N, Colombe SV. 1988. Drought influences the activity of enzymes of the chloroplast hydrogen peroxide scavenging system. J Exp Bot. 39:1097–1108. doi: 10.1093/jxb/39.8.1097
- Souza RP, Machado EC, Silva JAB, Lagoa AMMA, Silveira JAG. 2004. Photosynthetic gas exchange, chlorophyll fluorescence and some associated metabolic changes in cowpea (Vigna unguiculata) during water stress and recovery. Environ Exp Bot. 51:45–56. doi: 10.1016/S0098-8472(03)00059-5
- Stanley CD. 1990. Proper use and data interpretation for plant- and soil water status measuring instrumentation: introductory remarks. HortScience. 25:1534. doi: 10.21273/HORTSCI.25.12.1534
- Starck Z. 2005. The reactions of plants to abiotic environmental stress-acclimatization and adaptation. Grassland Sci Pol. 8:173–184 (in Polish).
- Sullivan CHY, Ross WN. 1979. Selecting for drought and heat resistance in grain sorghum. In: Mussel H, Staples R, editor. Stress physiology in crop plant. New York (NY): Wiley; p. 263–281.
- Szechyńska-Hebda M, Czarnocka W, Hebda M, Bernacki MJ, Karpiński S. 2016. PAD4, LSD1 and EDS1 regulate drought tolerance, plant biomass production, and cell wall properties. Plant Cell Rep. 35:527–539. doi: 10.1007/s00299-015-1901-y
- Talebi R, Fayaz F, Naji N. 2009. Effective selection criteria for assessing drought stress tolerance in durum wheat (Triticum durum Desf.). Gen App Plant Physiol. 35:64–74.
- Tang AC, Kawamitsu Y, Kanechi M, Boyer JS. 2002. Photosynthetic oxygen evolution at low water potential in leaf discs lacking an epidermis. Ann Bot. 89:861–870. doi: 10.1093/aob/mcf081
- Wang W, Vinocur B, Altman A. 2003. Plant response to drought, salinity and extreme temperatures: towards genetic engineering for stress tolerance. Planta. 218:1–14. doi: 10.1007/s00425-003-1105-5
- Weatherley PE. 1950. Studies of water relations of the cotton plant. I. The field measurement of water deficit in leaves. New Phytol. 49:81–87. doi: 10.1111/j.1469-8137.1950.tb05146.x
- Williams MH, Rosenqvist E, Buchhave M. 1999. Response of potted miniature roses (Rosaxhybrida) to reduced water availability during production. J Hortic Sci Biotechnol. 74:301–308. doi: 10.1080/14620316.1999.11511113
- Winter SR, Musick JT, Porter KB. 1988. Evaluation of screening techniques for breeding drought resistant winter wheat. Crop Sci. 28:512–516. doi: 10.2135/cropsci1988.0011183X002800030018x
- Wright H, De Longa J, Ladab R, Prangea R. 2009. The relationship between water status and chlorophyll a fluorescence in grapes (Vitis spp.). Postharvest Biol Technol. 51:193–199. doi: 10.1016/j.postharvbio.2008.07.004
- Yamauchi A. 1993. Significance of root system structure in relation to stress tolerance in cereal crop. In: Low-input sustainable crop production system in Asia, Korean Soc. Crop Sci., Korea; p. 347–360.
- Zabet M, Hosseinzadeh AH, Ahmadi A, Khialparast F. 2003. Effect of water stress on different traits and determination of the best water stress index in Mung Bean (Vigna radiate). Iran J Agric Sci. 34:889–898.
- Zaheri A, Bahraminejad S. 2012. Assessment of drought tolerance in oat (Avena sativa L.) genotypes. Ann Biol Res. 3(5):2194–2201.
- Zhang L, Mi X, Shao HB, Ma K. 2011. Strong plant-soil associations in a heterogeneous subtropical broad-leaved forest. Plant Soil. 347:211–220. doi: 10.1007/s11104-011-0839-2