
 ?Mathematical formulae have been encoded as MathML and are displayed in this HTML version using MathJax in order to improve their display. Uncheck the box to turn MathJax off. This feature requires Javascript. Click on a formula to zoom.
ABSTRACT
Eleven bread wheat genotypes grown at Siwa Oasis and Ashmon, Menofeya Governorate, during the winter season of 2016/2017 were examined for their agronomic traits under salinity stress. Owing to the differences in the salinity levels at the two locations, significant differences were noticed among the tested genotypes for all traits. Lines L2 and L4 showed the highest grain yields, whereas L3 showed the lowest. The most suitable parameters for screening stress-tolerance were tolerance indices and high-yielding potentiality. In this investigation, 33 SSR (Simple Sequence Repeat) primers led to the determination of one to three alleles per primer, with an average of 1.36. The use of 31 EST (Expressed Sequence Tag)-SSR markers led to the determination of 38 polymorphic alleles, ranging from one to five, with a mean of 1.23 per locus. A cluster analysis using the SSR and EST-SSR information divided the 11 wheat genotypes into three groups.
Introduction
Bread wheat (Triticum aestivum L.) is one of the most important cereal crops globally. Furthermore, wheat is the largest food source in Egypt despite a 49% gap between wheat consumption and production (Ouda and Zohry Citation2017). One of the challenges in filling the gap between wheat production and consumption in Egypt is the problem of salinization in the Nile Delta. For example, 33% of the agriculture area in Egypt is salinized owing to low precipitation (<25 mm annually), drain water re-use, and the constraints that policymakers put on the cultivation of rice (Bortolini et al. Citation2018).
Wheat response to salinity stress is a multiplex phenomenon which involves changes in several morphological and physiological traits, in addition to affecting several biochemical pathways. Salinity stress inhibits plant growth by increasing water deficits, ion toxicity, ion imbalance, and nutritional and hormonal imbalance (Ashraf and Foolad Citation2013; Acosta-Motos et al. Citation2017; Ismail and Horie Citation2017). Plant responses to counter the salt-induced adverse effect include ion exclusion, accumulation of organic osmolytes, antioxidants production, and changes in mineral and nutrients uptake (Ismail and Horie Citation2017; Rahneshan et al. Citation2018). Therefore, developing salinity stress tolerant genotypes requires a profound understanding of several physiological and morphological mechanisms of plant response to salinity stress to successfully select salinity stress-tolerant genotypes. Phenotypic traits such as growth, water relation, ion homeostasis, photosynthesis, yield components, and senescence have been used to directly select for salinity stress tolerant genotypes (Negrão et al. Citation2017).
Molecular markers offer a contemporary solution to improve the selection efficiency of complicated traits such as salinity stress. The main applications of molecular markers can be classified into two categories: (a) assessment of genetic diversity and (b) identification and characterization of genomic regions controlling the trait of interest (Guichoux et al. Citation2011; Li et al. Citation2012; Postolache et al. Citation2014; Meyer et al. Citation2017; Ishikawa et al. Citation2018). Among the several molecular markers platforms available, such as Single Nucleotide Polymorphism and genotype by sequencing (Cavanagh et al. Citation2013; Ishikawa et al. Citation2018) Microsatellites (simple sequence repeat [SSR]) were used in the this study. The SSR marker platform, which can be developed using genomes (gSSRs) or transcriptomes (EST-SSRs), is a powerful tool for examining population genetic diversity (Meyer et al. Citation2017) and marker-assisted selection (Gadaleta et al. Citation2011). Furthermore, EST-SSR primers have generally been effective as strong molecular genetic tools in a huge number of cereal crop species because of their high level of transferability across species, close association with functional genes, and recognition of variation in coding sequences. Moreover, EST-SSRs were found to be more conservative than SSRs (Li et al. Citation2012; Postolache et al. Citation2014). Even though the EST-SSR markers produced high-quality information, they are less polymorphic than the gSSR markers (Ren et al. Citation2017). Generally, SSR markers (EST-SSR and gSSR) are suitable for parental identification, pedigree analysis, and development of newly improved genotypes as they are independent of environmental conditions and plant development stage. Thus, SSR markers are a useful tool to indirectly select for desirable alleles or traits if a tight linkage relationship is established between the SSR marker and the gene controlling the trait (El Siddig et al. Citation2013).
In this study, two locations, Siwa Oasis (located in the north-west of the western desert of Egypt) and Ashmon (located in northern Egypt) were used to evaluate the impact of soil salinity stress on several aspects of wheat plants under field conditions. Siwa Oasis was selected in this study because of its promising capabilities for agricultural development. However, soils in this Oasis suffer from the problem of soil salinity which resulted in a deleterious effect on wheat productivity. Moreover, the Ashmon location was considered a control location with no soil or water problems. The main objective in using these two locations was to compare the performance of the studied materials grown under normal growth conditions with that grown under saline soil conditions. Two check cultivars and nine recently developed and potentially salinity stress-tolerant lines were evaluated at the Siwa and Ashmon locations. The main aims of this study were to:
characterize the performance of the studied materials under saline and normal growth conditions,
use phenotypic performance, gSSR, and EST-SSR to investigate genetic variability among the studied materials, and
assess the effectiveness of gSSR and EST-SSR in identifying salinity stress-tolerant genotypes.
Materials and methods
Plant materials and field conditions
Eleven wheat genotypes were used in the current study, i.e. two recently released cultivars (‘Giza171’ and ‘Sids12’) and nine elite lines, ‘L1’ to ‘L9’, potentially tolerant to salinity stress. Information about seed sources, selection history, and pedigrees are presented in the supporting information (). The studied materials were planted at two locations; the Experimental Farm of the Desert Research Center located in Siwa Oasis (29°00′12″N 26°00′3″ E) and a Grower farm located in Ashmon (30°18′16″ N 31°2′5″ E) in the last week of November during the 2016/2017 growing season. Siwa is an urban oasis in Egypt, bordering Libya, and 560 km from Cairo; while, Ashmon is located in the middle delta, 42 km from Cairo (northern Egypt). Soil samples were collected (0–30 cm depth) during November directly before planting and analyzed according to Klute et al. (Citation1994). The main soil physical and chemical characteristics are shown in and (supporting information). For each location, a randomized complete block design was used with three replicates. The 11 genotypes were assigned randomly to each plot within each replicate and location. The plot sizes were 3.5 m long and 15 rows wide with 20 cm between rows. Standard agronomic practices of fertilization and irrigation schedules, for each location, were followed.
Table 1. Name, origin, and pedigree and/or selection history of eleven bread wheat genotypes tested.
Table 2. Soil physical analysis of the two experimental sites at Ashmon – Menofya, and Siwa Oasis during 2016/2017 growing season.
Table 3. Chemical analysis of soil saturation extract and irrigation water during 2016/2017 growing seasons.
Phenotypic measurements
The following variables were measured at both locations, i.e. in stressed and non-stressed environmental conditions. Plant height (cm) of five randomly selected plants was measured after physiological maturity in each plot as distance from the soil surface to the tip of the spike, excluding awns. Random samples of 10 plants were collected from each plot directly before harvest. The collected samples were dried at 70°C for 72 h. Then, the number of spikes per plant, seed number per spike, spike length, spikelets number per spike, and grain number per plant were determined on the dry samples. All plants in each plot were cut at 5 cm above the soil surface and left to dry in the middle of the plots. After three days, plants from each plot were threshed separately using a locally made single plot thresher, in which seeds and straw were collected, paged, numbered, and then dried and weighed.
Molecular analysis
Molecular analysis was conducted at the Biotechnology Lab, Department of Plant Production, Food and Agriculture Sciences, King Saud University, Riyadh, Saudi Arabia. DNA was extracted from wheat genotypes using the Wizard Genomic DNA purification Kit (Promega Corporation Biotechnology, Madison, WI, USA). Then, the extracted DNA was treated with RNase and stored in a refrigerator at −20°C. Before conducting the EST-SSR and SSR analysis, DNA was diluted to 25 ng/µL.
Forty-six EST-SSR primers (Peng and Lapitan Citation2005) and 50 SSR primers (Somers et al. Citation2004) were used (supplementary data Table 6a and 6b). The PCR mixture comprised 50 ng of genomic DNA, 1X PCR buffer, 1.5 mM MgCl2, 0.1 mM each dNTP, 0.5 μM each of forward and reverse primers, and 1 U Taq polymerase in a volume of 0.025 cm3. The PCR program for the EST-SSR and SSR analyses involved a primary denaturation at 94°C for 3 min, followed by 35 cycles of denaturation at 94°C for 1 min, annealing at 50, 52, 55, and 60°C (dependent on EST-SSR and SSR primers) for 1 min, and extension at 72°C for 2 min, followed by a final extension at 72°C for 10 min. The amplified PCR products were applied to 3% (m/v) agarose gel containing 0.1 μg cm−3 ethidium in TBE buffer. After electrophoresis, a photograph of the gel was captured using a UV trans-illuminator. The EST-SSR and SSR data were scored on the basis of presence (1) or absence (0) of a given marker, after excluding unreproducible bands.
Statistical analysis
Phenotypic data
Analysis of variance was performed using SAS® v9.2 (2008, SAS Institute Inc., Cary, NC, USA), following the linear model (Federer and King Citation2007):
where, Yijm is the response measured on the ijm plot, µ is the overall mean, Ei is the effect of the ith Environment (two locations), EB(i)j is the jth block nested within the ith environment, Gm is the effect of the mth genotype, EGim is the interaction effect among the ith environment, and Gth genotype, and εijm is the experimental error.
Means were compared using the new LSD test (at P-value < 0.05), according to Gomez and Gomez (Citation1984). Homogeneity of the variance across environments was tested following the Bartlett’s Test (Steel and Torrie Citation1980).
Molecular marker data and genetic variability
A similarity matrix was estimated according to Nei and Li (Citation1979) using molecular marker data as follows:
where, Nij is the number of alleles present in both the ith and jth genotypes, Ni is the number of bands present in the ith genotype, and Nj is the number of alleles present in the jth genotype.
The similarity matrix was then subjected to the rate unweighted pair group method with arithmetic average (UPGMA) grouping algorithm. Principal coordinate analysis (PCoA) was used as an alternative to hierarchical clustering in that the similarity matrix was used to obtain the coordinates. These coordinates were then used to create scatter plots that represent the relationships among genotypes. Both UPGMA and PCoA were conducted using PAST version 1.62 (Hammer et al. Citation2001). Furthermore, to ensure the reliability of the generated dendrogram, 1000 simulations were performed using PAUP* version 4.0.b5 (Swofford Citation2001). Polymorphic information content (PIC) was calculated as follows (Smith et al. Citation1997):
where, pi is the frequency of the ith allele across genotypes.
To identify the informative markers, and study the correlation between genetic diversity and average grain yield for each genotype in the stressed environment, the association analysis between molecular data of the nine SSR and EST-SSR markers was performed using Map Manager QTX, vQTXb20 (Manly et al. Citation2001).
Results
Mean performance of yield and its components
Highly significant differences were observed among genotypes tested for all studied traits (). The results showed that the highest number of spikes per plant was obtained in genotype L6 (3.81) followed by L2 (3.40), while the lowest number of spikes per plant was obtained in genotype L9 (1.82). The highest number of grains per plant was obtained for genotype L2 (177.3), while the highest values in grain yield, straw yield, number of grains per plant, 1000-grain weight, and number of spikes per plant were obtained in genotype L2.
Table 4. Mean performance combined over the two environments (under stress and adequate) as well as under each environment for yield and its components of eleven bread wheat genotypes tested.
The mean performance combined over the two environments (stress and adequate conditions), as well as under each environment for yield and associated components of the 11 bread wheat genotypes examined are shown in . It is noteworthy that the mean performances of all genotypes under adequate conditions were higher than those under salt stress environment for all recorded traits. However, the differences were significant in only straw yield. For plant height, the genotypes L5 and G171 were the tallest genotypes under stress, while L7 was the shortest under both adequate and stress conditions. The number of spikes per plant was the highest in genotype L6 under stress and adequate conditions, as well as in the combined data (3.57, 4.06, and 3.81, respectively). The lowest values for these traits were observed in genotypes L9 and L3 under stress. For 1000-grain weight (g), L2 showed the highest values under adequate conditions, as well as in the combined data, while the check variety G171 and L5 showed the highest 1000-grain weight under stress conditions (36.58 and 35.97, respectively). In contrast, L7 and L3 showed the lowest 1000-grain weight under stress and adequate conditions, as well as in the combined data. Genotype L2 produced the maximum number of grains per plant under stress as well as in the combined data, while L4 produced the maximum number of grains per plant under adequate conditions. The lowest values for this trait were observed in the check variety G171. Regarding grain yield per plant, both L2 and L4 produced the heaviest grains, while L3 and L9 produced the lightest ones. Six of the nine selected lines surpassed both the check varieties (Sids12 and Giza171) in grain yield per plant in the combined data (L1, L2, L4, L5, L6, and L8). These genotypes were selected for continuation in the wheat breeding program. For straw yield per plant (g), both L2 and L6 recorded the highest values under adequate conditions, as well as in the combined data, while L2 and L4 recorded the highest values under stress conditions. Generally, grain yield superiority for each of these genotypes was attributed to the high potentiality of two or more of the yield attributes (). Therefore, these genotypes should be further tested under different environments (years, locations, and cultural practices) in subsequent breeding program investigations to ensure their stability and better grain quality under such stress conditions.
SSR and EST-SSR combined analysis
Genetic diversity of molecular markers
Of the 96 different SSR and EST-SSR primer pairs used in this study, only 64 generated polymorphisms among the 11 wheat genotypes. A cluster analysis was performed based on similarity coefficients generated from the SSR and EST-SSR combinations data of the 83 scored bands. The cluster analysis grouped the 11 wheat genotypes into three main groups with similarity coefficients ranging from 0.32 to 0.70 with an average of 0.61. The maximum genetic similarity (0.70) was observed between genotypes L4 and L6 and the minimum (0.32) was between Sids12 and L3 ( and ). The first group supported by a bootstrap value of 29% contained four genotypes, (L7, L9, L8, and G171), that were salt-sensitive genotypes. The second group supported by a bootstrap value of 9% contained five wheat genotypes comprising two subgroups. The first subgroup supported by a bootstrap value of 67% included genotypes L4, L6, L1, and L2 that were salt-tolerant. The second subgroup supported by a bootstrap value of 8% included the L5 genotype that was salt-sensitive. The third cluster contained two wheat genotypes, (L3 and Sids12), that were salt-sensitive and supported by a bootstrap value of 63%.
Figure 1. Unweighted pair group method arithmetic average (UPGMA) dendrogram for eleven wheat genotypes based on the allelic data of 33 SSR and 31 EST-SSR combinations.
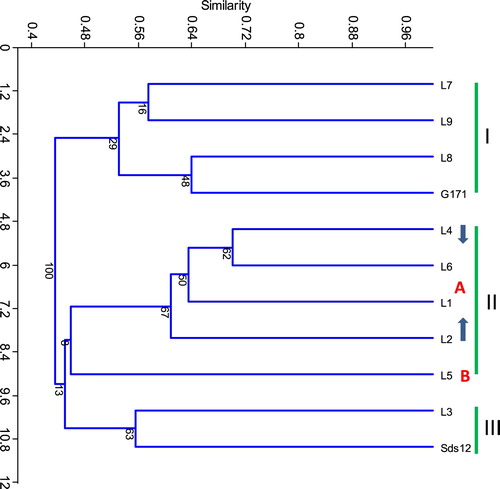
Table 5. The levels of genetic diversity in eleven wheat genotypes by SSR and EST- SSR markers.
Cluster analysis efficiently grouped the salt tolerant and sensitive genotypes separately into three clusters (). The first and third groups contained all the salt-sensitive genotypes, while the second group contained all the salt-tolerant genotypes except genotype (L5), which was separated alone as a subgroup. These results recommended that cluster analysis could be used to distinguish between the salt-tolerant and sensitive genotypes.
Genetic information produced by SSR and EST-SSR markers
Thirty-three SSR markers were used to examine their discrimination power (DP) by calculating the PIC of their loci. A total of 45 bands (alleles) were amplified among the 11 wheat genotypes using 33 SSR markers. The number of amplified bands (alleles) per primer ranged from one allele, for the barc13 primer, to three alleles, for the barc5 primer, with a mean value of 1.36 alleles (). The sizes of the amplified alleles varied between 100 and 600 bp. The level of polymorphism among the 11 genotypes was estimated by calculating the PIC values for each of the 33 SSR loci. The PIC values varied greatly for all SSR loci tested. Twenty-two SSR primers detected a single allele, and their PIC values were zero. The PIC values of the remaining 11 primers ranged from 0.16 (barc63) to 0.92 (barc11) (). The PIC values were positively correlated (r = 0.785) with the number of amplified alleles per marker.
Thirty-one EST-SSR primers were used to investigate their DP by calculating their PIC. A total of 38 alleles were amplified among the 11 wheat genotypes, using 31 EST-SSR primers. The number of amplified bands (alleles) per primer ranged between one allele, for primer ‘Xcwem3’, to five alleles, for primer ‘Xcwem54’, with a mean value of 1.2 alleles (). The sizes of amplified alleles varied between 100 and 650 bp. The levels of polymorphism among the 11 genotypes were evaluated by calculating the PIC values for each of the 31 EST-SSR loci. The PIC values varied greatly for all EST-SSR loci tested. Twenty-eight primers detected a single allele and their PIC values were zero. The PIC values of the remaining three primers ranged from 0.165 (Xcwem11) to 0.742 (Xcwem54) (). The PIC values were positively correlated (r = 0.963) with the number of amplified alleles per primer. The present analysis indicated that the polymorphism revealed by EST-SSR primers was lower than that by gSSR markers. It could effectively differentiate diverse genotypes ().
Identification of new promising molecular markers linked with salinity stress tolerance
The SSR and EST-SSR primers generated in this study to identify salt tolerance-associated DNA markers are presented in . The SSR and EST-SSR analyses showed that some wheat genotypes were salt-tolerant (based on the origin of their field performance). The SSR markers barc63, barc124, barc144, and barc210 produced DNA bands of approximately 210, 100, 250, and 200 bp, respectively, that were present in the salt-tolerant genotypes (L6, L1, L2, and L2), but were absent in the salt-sensitive genotypes (L3, L5, L9, L7, and G171) (). The SSR marker barc125 (130 bp) was present in four salt-tolerant genotypes, (L1, L2, L4, and L6), but was absent in the salt-sensitive genotypes, (L3, L5, L9, L7, and G171) (). In this study, five markers (barc63, barc124, barc125, barc144, and barc210) were amplified in the salt-tolerant genotypes. These markers could explain 65, 41, 63, 41, and 41%, respectively, of phenotypic variation.
Table 6. Specific SSR and EST-SSR markers in eleven wheat genotypes under salt stress.
For the EST-SSR analysis, the polymorphic DNA fragment (390 bp) of primer Xcwem9 was identified in the salt-tolerant genotypes (L2, L4, and L6) but was absent in the salt-sensitive genotypes (L3, L5, L9, L7, and G171) (). The Xcwem54 (220 bp) marker was identified in the salt-tolerant genotypes (L1, L2, L4, and L6), but was absent in the salt-sensitive genotypes (L3, L5, L9, L7, and G171). The EST-SSR markers, Xcwem9 and Xcwem54, explained 78 and 63%, respectively, of the phenotypic variation. These markers appeared to be linked to the salt tolerance genotypes. In addition, the specific DNA bands generated from EST-SSR markers could be used to differentiate between the salt-tolerant (L1, L2, L4, and L6) and salt-sensitive (L3, L5, L9, L7, and G171) genotypes.
Discussion
The highest values of grain yield, straw yield, number of grains per plant, 1000-grain weight, and number of spikes per plant were obtained in genotype L2. These results are consistent with those reported by Afiah (Citation2002) and Afiah et al. (Citation2018). These results are also consistent with the reports of Shpiler and Blum (Citation1990), who found that the number of kernels/spike was the most effective component of grain yield. These variations among genotypes might reflect, partially, their different genetic backgrounds. El-Hendawy et al. (Citation2005) reported that spikelet number on the main stem decreased to a greater extent with salinity than spike length, grain number, and 1000-grain weight at maturity. Moreover, Ouda et al. (Citation2006) reported that the level of wheat yield reduction, as a result of stress, was affected by genotypes.
The findings of Prasad et al. (Citation2000) supported that the cluster obtained based on the similarity matrix, using the UPGMA algorithm, grouped the above cultivars into two main groups (I and II), each with two sub-groups (Ia, Ib, IIa and IIb) in 55 wheat genotypes with 20 SSR primers. Plaschke et al. (Citation1995) reported that the cluster analysis using 23 Wheat Microsatellite Consortium (WMC) SSR primers in 40 wheat cultivars and lines grouped data into one main cluster that comprised three subgroups related by pedigrees. Al-Doss et al. (Citation2011) reported that the UPGMA dendrogram separated the six durum wheat genotypes into three clusters with 19 sequence-related amplified polymorphic (SRAP) primers. Kumar et al. (Citation2016) found that the cluster analysis broadly grouped 54 genotypes into four clusters represented as A, B, C, and D. Among these four clusters, cluster D included the maximum number of genotypes (43), which were further divided into seven sub-clusters using 39 SSR markers. The cluster analysis, with the data of 22 EST-SSR, grouped the 64 durum wheat genotypes into 12 major groups. Thus, there appears to be some clustering based on the geographical origin of the genotypes, with some evidence for the improved varieties also being grouped together (Eujayl et al. Citation2002).
The PCoA and cluster analysis distinguished these cultivars into different groups (Gong et al. Citation2011). Nandha and Singh (Citation2014) reported 16 EST-SSRs in 47 barley accessions (27 wild and 20 cultivated). A cluster analysis classified the cultivated and wild genotypes into two major groups corresponding to their geographic origin. The first principal coordinate accounted for 18.4% of the total variation, clearly separating the wild genotypes from the cultivated ones, and the second PCOA accounted for 10.4% of the total variation and comprised all cultivated genotypes. In general, the diversity measurements were higher in the genotypes, suggesting that such a high level of genetic similarity might be used for selecting materials in breeding programs, wherein the genotypes with high genetic distance could be used.
Prasad et al. (Citation2000) reported one to 13 alleles per locus in 55 wheat genotypes with 20 SSR markers, with a PIC value ranging from 0.21 to 0.90 and an average of 0.68. The coefficient of similarity matrix ranged from 0.05 to 0.88, with an average of 0.23. Mardi et al. (Citation2011) reported two to 10 alleles per locus in 122 durum wheat genotypes, with 19 SSR markers. Al-Murish et al. (Citation2013) reported a mean of 2.31 amplified bands (alleles) per marker among 17 coffee genotypes with 16 SSR markers and a mean PIC value of 0.43. Eujayl et al. (Citation2002) reported that a total of 89 alleles per locus ranged from one to seven alleles, with an average of 4.1 alleles per locus in 64 durum wheat genotypes, with 22 EST-SSR markers and a coefficient of similarity matrix ranging from 0.37 to 0.72.
The present analysis indicated that the polymorphism revealed by EST-SSR markers was lower than that by gSSR markers. It could effectively differentiate diverse genotypes. Similar results were observed by Eujayl et al. (Citation2002), Xinquan et al. (Citation2005), and Nandha and Singh (Citation2014). The EST-SSR markers produced high-quality markers but had the minimum level of polymorphism (25%) in contrast to the other two exporters of genomic SSR primers (53%) (Eujayl et al. Citation2002). Recently, Wang et al. (Citation2018) reported that the EST-SSR sequences were used to identify PIC and they were medium and ranged from 0.080 to 0.562, with a mean of 0.409, using 96 Heterodera avenae cysts with eight EST-SSR markers.
In the present study, five markers (barc63, barc124, barc125, barc144, and barc210) were amplified in the salt-tolerant genotypes. These markers could explain 65, 41, 63, 41, and 41%, respectively, of phenotypic variation. Similar results were reported for rice, where a good correlation was found between genetic diversity and phenotypic traits related to salt tolerance (Kordrostami et al. Citation2016). In addition, Hassanein and Al-Soqeer (Citation2018) found a good correlation between genetic diversity and the morphological variability of Moringa genotypes.
The EST-SSR markers, Xcwem9 and Xcwem54, appeared to be linked to the salt tolerance genotypes. In addition, the specific DNA bands generated from EST-SSR markers could be used to differentiate between the salt-tolerant and salt-sensitive genotypes. Similar results were reported by Peng and Lapitan (Citation2005) indicating the usefulness of EST-SSR markers (Xcwem9 and Xcwem54) for gene mapping and molecular breeding. In addition, Moghaieb et al. (Citation2011) reported that the Egyptian wheat cultivars, ‘Beni-Suef’, ‘Sohagby’, and ‘Gemmiza 10’ were distinguished by SSR primers. Shahzad et al. (Citation2012) found that 12 SSR markers (cfd 1, cfd 9, cfd 18, cfd 46, cfd 49, cfd 183, wmc 11, wmc 17, wmc 18, wmc 154, wmc 432, and wmc 503) detected specific alleles only in the salt-tolerant genotypes. Moreover, the SSR marker ‘barc124’ was associated with salt tolerance in wheat population (Shahzad et al. Citation2012).
Conclusions
In the present study, the wheat genotypes L2 and L4 exhibited the highest values for salt tolerance index. The SSR and EST-SSR primers (markers) were ideal for assessing the genetic variability in wheat. Moreover, five SSR markers (barc63, barc124, barc125, barc144, and barc210) were amplified in the salt-tolerant genotypes. The EST-SSR markers, Xcwem9 and Xcwem54, were identified in the salt-tolerant genotypes (L2, L4, and L6). Therefore, the EST-SSR and SSR markers were very useful in characterizing wheat genotypes that were mostly classified depending upon whether they were salt-tolerant or -sensitive.
Author contributions
Dr Adel A. ELShafei: overall management of the proposed research. Molecular markers analysis and Writing publication. Prof. Samy A. Afiah: Evaluation of wheat genotypes under salinity stress for agronomic traits. Prof. A.A. Al-Doss: Statistical analysis of all data. E. I. Ibrahim: sample collection, sample analysis, field and laboratory work.
Supplemental Material
Download MS Word (152.9 KB)Acknowledgements
The authors thank the Deanship of Scientific Research and RSSU at King Saud University for their technical support. Great appreciation is also owed to Prof. Shaalan, M.I., Prof. Motawei, M. and Dr El-Basyoni, I. for their suggestions and proofreading during the preparation of this manuscript.
Disclosure statement
No potential conflict of interest was reported by the authors.
ORCID
Adel Ahmed Elshafei http://orcid.org/0000-0001-6089-3398
Eid Ibrahim Ibrahim http://orcid.org/0000-0002-5029-6386
Additional information
Funding
Notes on contributors
Adel Ahmed Elshafei
Dr Adel Ahmed Elshafei works as an assistant professor in the Department of Genetic and Cytology, Genetic Engineering and Biotechnology Division, National Research Center (NRC). He obtained his PhD in 2008 in Crop Science Department, for the Title ‘Identification of Molecular Markers Linked to Northern Corn Leaf Blight Resistance in Maize’. He obtained his BSc in 1989 and MSc in 2002 from the same department. He is a faculty of agriculture in Alexandria. His master thesis in in vitro selection studies for drought tolerance in rice. Furthermore, his PhD thesis was the best in Genetic Engineering and Biotechnology from the National Research Center (NRC) Egypt, 2009. His research interest includes plant breeding. He has published about 28 research studies in international journals.
Samy Abd El-Aziz Afiah
Dr Samy Abd El-Aziz Afiah currently works as a professor in Genetic Resources Department, Desert Research Center, El Matareya, Cairo, Egypt. He obtained his PhD in 1991 from Zagazig University. He obtained MSc and BSc in 1981 and 1975, respectively from Ain Shams University, Department of genetics. Dr Afiah's research interest includes crop breeding under different environment conditions.
Abdullah Abdulaziz Al-Doss
Dr Abdullah Abdulaziz Al-Doss is a professor of plant breeding and genetics and a faculty in King Saud university. He obtained his PhD and MSc from University of Arizona, USA in 1993 and 1989, respectively. Also, he obtained his BSc from King Saud University in 1985. His research interests include the use of molecular markers for identification of favorable genes, conservation and enhancement of plant genetic resources of field crops, breeding of grain and forage crops and seed production and seed quality assurance.
Eid Ibrahim Ibrahim
Mr Eid Ibrahim Ibrahim holds a BSc in Genetics from Alexandria University, Egypt (2007) and an MSc in Biotechnology from King Saud University (2014). He is currently a Researcher at Faculty of Food and Agriculture Science, KSU, Saudi Arabia. His research now focuses on the Application of New Biotechnology Tools Improving Wheat and Barley Breeding.
Related Research Data
References
- Acosta-Motos JR, Ortuño MF, Bernal-Vicente A, Diaz-Vivancos P, Sanchez-Blanco MJ, Hernandez JA. 2017. Plant responses to salt stress: adaptive mechanisms. Agronomy. 7(1):18.
- Afiah SA. 2002. Comparative study on combining ability, degrees of dominance and heterotic effects in bread wheat under saline stress and rainfed conditions. Paper presented at the proceedings of the 2nd conference on Sustainable Agricultural Development; May 8–10; Egypt: Faculty of Agriculture, Fayoum Branch, Cairo University.
- Afiah SA, Hassan WA, Ahmed FS, Farag HIA. 2018. Response of some genetically distinct bread wheat genotypes to drought stress. Egypt J Plant Breed. In press.
- Al-Doss AA, Elshafei AA, Moustafa KA, Saleh M, Barakat MN. 2011. Comparative analysis of diversity based on morphoagronomic traits and molecular markers in durum wheat under heat stress. Afr J Biotechnol. 10(19):3671–3681.
- Al-Murish TM, Elshafei AA, Al-Doss AA, Barakat MN. 2013. Genetic diversity of coffee (Coffea arabica L.) in Yemen via SRAP, TRAP and SSR markers. J Food Agric Environ. 11(2):411–416.
- Ashraf M, Foolad MR. 2013. Crop breeding for salt tolerance in the era of molecular markers and marker-assisted selection. Plant Breed. 132(1):10–20.
- Bortolini L, Maucieri C, Borin M. 2018. A tool for the evaluation of irrigation water quality in the arid and semi-arid regions. Agronomy. 8(2):23.
- Cavanagh CR, Chao S, Wang S, Huang BE, Stephen S, Kiani S, Forrest K, Saintenac C, Brown-Guedira GL, Akhunova A. 2013. Genome-wide comparative diversity uncovers multiple targets of selection for improvement in hexaploid wheat landraces and cultivars. Proc Natl Acad Sci USA. 110(20):8057–8062.
- El-Hendawy SE, Hu Y, Yakout GM, Awad AM, Hafiz SE, Schmidhalter U. 2005. Evaluating salt tolerance of wheat genotypes using multiple parameters. Eur J Agron. 22(3):243–253.
- El Siddig MA, Baenziger S, Dweikat I, El Hussein AA. 2013. Preliminary screening for water stress tolerance and genetic diversity in wheat (Triticum aestivum L.) cultivars from Sudan. J Genet Eng Biotechnol. 11(2):87–94. doi: 10.1016/j.jgeb.2013.08.004
- Eujayl I, Sorrells ME, Baum M, Wolters P, Powell W. 2002. Isolation of EST-derived microsatellite markers for genotyping the A and B genomes of wheat. Theor Appl Genet. 104(2–3):399–407.
- Federer WT, King F. 2007. Variations on split plot and split block experiment designs. Vol. 654. Hoboken (NJ): John Wiley & Sons.
- Gadaleta A, Giancaspro A, Zacheo S, Nigro D, Giove SL, Colasuonno P, Blanco A. 2011. Comparison of genomic and EST-derived SSR markers in phylogenetic analysis of wheat. Plant Genet Res. 9(2):243–246.
- Gomez KA, Gomez AA. 1984. Statistical procedures for agricultural research. New York (NY): John Wiley & Sons; p. 680.
- Gong Y, Xu S, Mao W, Li Z, Hu Q, Zhang G, Ding J. 2011. Genetic diversity analysis of faba bean (Vicia faba L.) based on EST-SSR markers. Agric Sci China. 10(6):838–844.
- Guichoux E, Lagache L, Wagner S, Chaumeil P, Léger P, Lepais O, Lepoittevin C, Malausa T, Revardel E, Salin F, Petit RJ. 2011. Current trends in microsatellite genotyping. Mol Ecol Resour. 11(4):591–611.
- Hammer Ø, Harper DAT, Ryan PD. 2001. PAST: paleontological statistics software package for education and data analysis. Palaeontol Electron. 4(1):1–9.
- Hassanein AMA, Al-Soqeer AA. 2018. Morphological and genetic diversity of Moringa oleifera and Moringa peregrina genotypes. Hortic Environ Biotechnol. 59(2):251–261.
- Ishikawa G, Saito M, Tanaka T, Katayose Y, Kanamori H, Kurita K, Nakamura T. 2018. An efficient approach for the development of genome-specific markers in allohexaploid wheat (Triticum aestivum L.) and its application in the construction of high-density linkage maps of the D genome. DNA Res. 25(3):317–326.
- Ismail AM, Horie T. 2017. Genomics, physiology, and molecular breeding approaches for improving salt tolerance. Annu Rev Plant Biol. 68:405–434.
- Klute A, Weaver RW, Mickelson SH, Sparks DL, Bartels JM, Dane JH, Topp GC, Ulery AL, Drees LR, editors. 1994. Methods of soil analysis. 3rd ed. Madison (WI): Soil Science Society of America.
- Kordrostami M, Rabiei B, Hassani Kumleh HH. 2016. Association analysis, genetic diversity and haplotyping of rice plants under salt stress using SSR markers linked to SalTol and morpho-physiological characteristics. Plant Syst Evol. 302(7):871–890.
- Kumar S, Kumar V, Kumari P, Singh AK, Singh R. 2016. DNA fingerprinting and genetic diversity studies in wheat genotypes using SSR markers. J Environ Biol. 37(2):319.
- Li M, Zhu L, Zhou CY, Lin L, Fan YJ, Zhuang ZM. 2012. Development and characterization of EST-SSR markers from Scapharca broughtonii and their transferability in Scapharca subcrenata and Tegillarca granosa. Molecules. 17(9):10716–10723.
- Manly KF, Cudmore RH Jr, Meer JM. 2001. Map Manager QTX, cross-platform software for genetic mapping. Mamm Genome. 12(12):930–932.
- Mardi M, Naghavi M, Pirseyedi S, Kazemi Alamooti M, Rashidi Monfared S, Ahkami A, Omidbakhsh M, Alavi N, Salehi Shanjani P, Katsiotis A. 2011. Comparative assessment of SSAP, AFLP and SSR markers for evaluation of genetic diversity of durum wheat (Triticum turgidum L. var. durum). J Agric Sci Technol. 13:905–920.
- Meyer L, Causse R, Pernin F, Scalone R, Bailly G, Chauvel B, Délye C, Le Corre V. 2017. New gSSR and EST-SSR markers reveal high genetic diversity in the invasive plant Ambrosia artemisiifolia L. and can be transferred to other invasive Ambrosia species. PLos One. 12(5):e0176197.
- Moghaieb RE, Abdel-Hadi AA, Talaat NB. 2011. Molecular markers associated with salt tolerance in Egyptian wheats. Afr J Biotechnol. 10(79):18092–18103.
- Nandha PS, Singh J. 2014. Comparative assessment of genetic diversity between wild and cultivated barley using gSSR and EST-SSR markers. Plant Breed. 133(1):28–35.
- Negrão S, Schmöckel SM, Tester M. 2017. Evaluating physiological responses of plants to salinity stress. Ann Bot. 119(1):1–11.
- Nei M, Li WH. 1979. Mathematical model for studying genetic variation in terms of restriction endonucleases. Proc Natl Acad Sci USA. 76(10):5269–5273.
- Ouda S, Gaballah M, Tantawy M, El-Mesiry T. 2006. Irrigation optimization for sunflower grown under saline conditions. Res J Agric Biol Sci. 2(6):323–327.
- Ouda SAH, Zohry AE. 2017. Crops intensification to reduce wheat gap in Egypt. In: Ouda S, Zohry AE-H, Alkitkat H, Mostafa M, Sayad T, Kamel A, editors. Future food gaps Egypt. Cham: Springer; p. 37–56.
- Peng JH, Lapitan NL. 2005. Characterization of EST-derived microsatellites in the wheat genome and development of eSSR markers. Funct Integr Genomics. 5(2):80–96.
- Plaschke J, Ganal MW, Röder MS. 1995. Detection of genetic diversity in closely related bread wheat using microsatellite markers. Theor Appl Genet. 91–91(6–7):1001–1007.
- Postolache D, Leonarduzzi C, Piotti A, Spanu I, Roig A, Fady B, Roschanski A, Liepelt S, Vendramin GG. 2014. Transcriptome versus genomic microsatellite markers: highly informative multiplexes for genotyping Abies alba Mill. and congeneric species. Plant Mol Biol Report. 32(3):750–760.
- Prasad M, Varshney RK, Roy JK, Balyan HS, Gupta PK. 2000. The use of microsatellites for detecting DNA polymorphism, genotype identification and genetic diversity in wheat. Theor Appl Genet. 100(3–4):584–592.
- Rahneshan Z, Nasibi F, Moghadam AA. 2018. Effects of salinity stress on some growth, physiological, biochemical parameters and nutrients in two pistachio (Pistacia vera L.) rootstocks. J Plant Interact. 13(1):73–82.
- Ren J, Su ZZ, Dang ZH, Ding Y, Wang PX, Niu JM. 2017. Development and characterization of EST-SSR markers in Stipa breviflora (Poaceae). Appl Plant Sci. 5(4):1600157.
- Shahzad A, Ahmad M, Iqbal M, Ahmed I, Ali GM. 2012. Evaluation of wheat landrace genotypes for salinity tolerance at vegetative stage by using morphological and molecular markers. Genet Mol Res. 11(1):679–692.
- Shpiler L, Blum A. 1990. Heat tolerance for yield and its components in different wheat cultivars. Euphytica. 51(3):257–263.
- Smith JSC, Chin ECL, Shu H, Smith OS, Wall SJ, Senior ML, Mitchell SE, Kresovich S, Ziegle J. 1997. An evaluation of the utility of SSR loci as molecular markers in maize (Zea mays L.): comparisons with data from RFLPs and pedigree. Theor Appl Genet. 95(1-2):163–173.
- Somers DJ, Isaac P, Edwards K. 2004. A high-density microsatellite consensus map for bread wheat (Triticum aestivum L.). Theor Appl Genet. 109(6):1105–1114.
- Steel R, Torrie JH. 1980. Principles and procedures of statistics: a biometrical approach. New York (NY): McGraw-Hill.
- Swofford DL. 2001. PAUP*: phylogenetic analysis using parsimony (*and other methods) 4.0.b5. Sunderland (MA): Sinauer Associates.
- Wang X, Ma J, Liu H, Liu R, Li H. 2018. Development and characterization of EST-derived SSR markers in the cereal cyst nematode Heterodera avenae. Eur J Plant Pathol. 150(1):105–113.
- Xinquan Y, Peng L, Zongfu H, Zhongfu N, Qixin S. 2005. Genetic diversity revealed by genomic-SSR and EST-SSR markers among common wheat, spelt and compactum. Prog Natural Sci. 15(1):24–33.