
 ?Mathematical formulae have been encoded as MathML and are displayed in this HTML version using MathJax in order to improve their display. Uncheck the box to turn MathJax off. This feature requires Javascript. Click on a formula to zoom.
ABSTRACT
This study determined genotype-by-environment effect on grain quality among heat and drought tolerant bread wheat genotypes to select ideal genotypes for grain quality improvement. Gliadin (Gli), gluten (Glu), glutenin (Glut), gliadin: glutenin ratio (Gli: Glut ratio) and total protein content (TPC) were determined among 28 elite bread wheat genotypes under non-stressed and drought-stressed conditions. Additive main effect and multiplicative interaction and genotype and genotype-by-environment biplot were used for data analyses. Large genotypic effects were observed for Gli (55.42%), TPC (67.78%) and Gli: Glu ratio (49.77%), suggesting genotypic variation for these traits. High environmental influence of 89.65 and 89.06% were observed for Glu and Glut. Wheat genotypes LM03, LM22, LM23, LM41, LM44, LM60, LM62, LM71, LM73, LM71, LM85, LM90 and LM95 with high protein and protein-fractions and high levels of abiotic stress tolerance (i.e. heat and drought) were selected for breeding for high grain quality.
1. Introduction
Bread wheat (Triticum aestivum L.) is an important staple grain crop globally. Its nutritional benefits include vitamins B and E, micro-nutrients including zinc, iron, and macro-nutrients such as manganese, calcium, and magnesium (Amiri et al. Citation2015; Migliorini et al. Citation2016; Velu et al. Citation2017). Wheat grain is rich in protein (≈14%) useful for improving human diets (Migliorini et al. Citation2016; Guzmán et al. Citation2017; Giunta et al. Citation2019). Grain protein content and the ratio between the different protein fractions determines wheat flour quality and end-user products in processing industries (Xue et al. Citation2016; Luo et al. Citation2019). For example, gluten proteins influence flour blending capacity and dough properties. Gliadin proteins determines dough extensibility, whereas glutenin influences dough elasticity and strength (Shewry et al. Citation2001; Godfrey et al. Citation2010). Gliadin to glutenin ratio which measures molecular weight distribution or protein size, determines the balance between dough viscosity and elasticity (Uthayakumaran et al. Citation1999).
Grain quality is subject to genotype-by-environment (G × E) interaction necessitating selection of promising genotypes to develop market-preferred varieties (Flagella et al. Citation2010; Malik et al. Citation2013; Rozbicki et al. Citation2015; Migliorini et al. Citation2016; Hernández-Espinosa et al. Citation2018). G × E interaction refers to differences in genotypic performance for test traits across diverse environments (Yan and Kang Citation2003). This may limit effective selection of ideal genotypes possessing useful attributes for grain quality improvement. Wheat is cultivated in arid and semi-arid environments where recurrent drought spells and heat stress affect nutritional and processing quality (De Vita et al. Citation2007; Li et al. Citation2013; Hernández-Espinosa et al. Citation2018). Currently, low genetic gains are reported for grain protein content and protein-fractions (Subira et al. Citation2014; Sanchez-Garcia et al. Citation2015). Therefore, improving grain quality attributes is key for developing high-quality and market-preferred end-user products.
Additive main effect and multiplicative interaction (AMMI) is useful to determine genotypic (G), environment (E) and G × E effects on key traits for effective selection of ideal genotypes for production or breeding purposes (Gauch Citation1992; Yan et al. Citation2001). Genotype plus genotype-by-environment interaction (GGE) biplot (Yan and Tinker Citation2006) is useful to identify and select ideal and stable genotypes, and delineate mega-environments to facilitate selection and to design breeding strategies in improvement programmes (Yan et al. Citation2000; Yan and Kang Citation2003; Yan and Tinker Citation2006; Yan et al. Citation2007).
The International Maize and Wheat Improvement Centre (CIMMYT)’s wheat breeding programme develops high-yielding wheat genotypes. These genotypes possess novel grain quality traits suitable for various food processing industries and for the production of quality end-products for human consumption (Cossani and Reynolds Citation2015; Reynolds et al., Citation2017; Guzmán et al. Citation2017). To widen wheat genetic pool for production and breeding activities in South Africa, genetically divergent heat and drought tolerant wheat germplasm were acquired from CIMMYT (Mwadzingeni et al. Citation2016). Understanding the magnitude of G x E interaction under target production environments on nutritional traits is key to selecting well-adapted genotypes for recommendation to processing industries and improve genetic gains for grain quality traits. In light of the above background, the objective of this study was to determine G × E effect on grain quality among heat and drought tolerant bread wheat genotypes to select ideal genotypes for grain quality improvement.
2. Materials and methods
2.1. Plant materials
Twenty-four heat and drought tolerant bread wheat genotypes sourced from CIMMYT’s, and four widely grown wheat cultivars in South Africa were used in the study (). Genetic analysis using simple sequence repeat (SSR) markers revealed the genotypes are genetically diverse. Further, the genotypes possess superior agronomic and physiological attributes useful for breeding for high grain quality attributes.
Table 1. Names and pedigree of heat and drought tolerant wheat genotypes used in the study.
2.2. Test environments, executions of experiments and data collection
A 7 × 4 α-lattice design comprising of two replications was used to execute the experiments in glasshouse (GH) and rain-out shelter (RS) environments at the University of KwaZulu-Natal, South Africa. Treatment factors comprised of 28 genotypes, two water treatments: non-stressed [NS] and terminal drought-stressed [DS] and GH and RS environments. Treatment combinations resulted in four test environments namely GHNS (E1), GHDS (E2), RSNS (E3) and RSDS (E4). In GH and RS environments, pre-anthesis drought stress was induced by withholding water supply at 50% flowering until plant maturity. Non-stressed treatments were watered daily with adequate water to maintain field capacity from planting to maturity. Details of environmental variables (i.e. temperature and relative humidity), establishment and management of experiments (i.e. fertilisation) are described by Thungo et al. (Citation2019). At maturity, grains were harvested for each genotype under each water condition in RS and GH environments, stored in ∼20°C to prevent further moisture loss. The grains (≈12%) were milled to whole wheat flour using a local mill with 2 mm mesh sieve. Flour samples were further passed through 0.75 mm mesh size sieve and packed in air-tight plastic before further use (Abera et al. Citation2017).
2.3. Gliadin and glutenin extraction and quantification
Flour samples were extracted for endosperm storage protein fractions according to Wieser et al. (Citation1998) modified according to Landry and Moureaux (Citation1970). De-ionised water (Millipore Direct-Q UV 3) was used to prepare reagents. Brown flour samples (100 mg) were extracted stepwise for gliadins and glutenin analyses. Each extraction step was initiated by vortexing for two minutes at room temperature using a Heidolph REAX2000 vortex mixer. Samples were centrifuged at 6000× g using Gemmy industrial PLC-05 centrifuge. Initially, albumins and globulins were extracted twice with 0.6 ml of 0.5 M NaCl. Samples were stirred for 10 min at room temperature using Fried Electric MH-4 magnetic stirrer and supernatants discarded. Gliadins were extracted three times by adding 0.5 ml of 60% aqueous ethanol to the pellet. Samples were stirred for 10 min and centrifuged for 15 min at room temperature. Glutenins were extracted twice with 1.0 ml of 50% (v/v) 1-propanol + 2 M urea + 0.05 M Tris-HCl, pH 7.5 + 1% dithiothreitol (DTT) under liquid nitrogen. Samples were stirred for 20 min at 60°C and centrifuged for 20 min at room temperature. Extracts were refrigerated at −20°C before analysis (Wollmer et al. Citation2018). Gliadin and gluten extracts were analysed for total nitrogen content by means of Dumas combustion method using Trumac CNS analyzer (Leco, Moenchengladbach, Germany) on the bases of infrared absorption detection and glycine (nitrogen content = 1%) as reference standard. About ∼1.5 g of 501-427 COM-AID and 0.25 g sample extract were added on 528-203 Combustion Boat lined with 502-343 Nickel Boat Liners. Duplicate samples of gliadin and glutenin were analysed for nitrogen by burning under high furnace temperature (1350°C) under oxygen-rich conditions to produce mineralisable N. The gases were separated by chromatography and measured in a thermal conductivity cell. A factor of 5.7 was used to convert nitrogen content (Schalk et al. Citation2017) to gliadin and glutenin protein concentrations. Gluten content was calculated as an arithmetic sum of gliadin and glutenin. Gliadin/glutenin ratio was calculated by dividing gliadin concentration by glutenin concentration.
2.4. Total protein content analysis and quantification
Flour moisture content was determined according to (James Citation1995). A 5 g flour sample was weighed into a previously weighed metal dish and oven dried at 130°C for two hours. The sample was subsequently cooled in a desiccator. Percentage moisture content was calculated using the equation below:
Where W1 = weight of sample before drying (g), W2 = weight of sample + metal dish and W3 (g) = weight of sample + metal dish after drying (g).
Whole wheat flour samples were analysed for total nitrogen content using the Dumas combustion method using Trumac CNS analyzer (Leco, Moenchengladbach, Germany) on the bases of infrared absorption detection and Ethylene diaminetetra acetic acid (EDTA) (nitrogen content = 9.57%) used as reference standard. Determinations were performed in duplicate on samples of 0.20 g and ∼1 g COM-CAT (502-321) added into 528-203 Combustion Boat. Nitrogen in flour samples was burned at high furnace temperature (1350°C) under oxygen-rich conditions to produce mineralisable N. The gases were separated by chromatography and measured in a thermal conductivity cell. A factor of 5.7 was used to calculate percent protein content based on percent nitrogen (Schalk et al. Citation2017). Flour protein values were reported at 14% dry mass moisture basis (Guzmán et al. Citation2016).
3. Statistical analysis
3.1. Analysis of G, E and G × E effects using AMMI
After combined analysis of variance (ANOVA), AMMI was used to quantify effects due to G, E and G x E effects using Genstat 18th Edition (VSN International, Hempstead, UK).
3.2. Identification of suitable genotypes using GGE biplots
GGE biplots were used to identify highly-responsive and stable genotypes (Yan et al. Citation2000, Citation2001; Yan Citation2001) using GenStat 18th edition.
4. Results
4.1. G, E, and G × E effects on grain quality attributes
AMMI analysis of variance indicated highly significant (p ≤ 0.001) G, E and G × E interaction effects on gliadin, gluten, glutenin, total protein content and gliadin: glutenin ratio (). First principal component analysis axis (IPCA1) and second interaction principal component analysis axis (IPCA2) were significant (P ≤ 0.05) for studied grain quality attributes. For gliadin content, IPCA1 and IPCA2 accounted for a total variation of 78% of which IPCA1 and IPCA1 explained 53 and 25% of the AMMI model, respectively. Further, the AMMI model revealed that 55, 19.3 and 17.4% of the variation was attributable to genotype G, E and G x E interaction respectively. With regards to gluten content, IPCA1 and IPCA2 accounted for a total variation of 90.1% of which IPCA1 and IPCA1 explained 49.6 and 40.1% of the AMMI model, respectively. The model showed that 4.37, 90 and 5% of the variation was attributed to G, E and G x E interaction, respectively. Large E variation (89.1%) and low G and G × E effects of 4.83 and 4.65% were attributed to glutenin content. Further, the AMMI model explained 83.89% of total variation whereby IPCA1 and IPCA2 accounted for 56.55 and 27.34% of total variation. IPCA1 and IPCA2 accounted for a total variation of 77.8% (IPCA1 = 53.04% and IPCA1 = 24.73%) of the AMMI model for total protein content, respectively. Additionally, Large G effect (67.7%) and low E and G x E effects (≈ 13%) were attributed to total protein content. Gliadin: glutenin ratio showed large G effects of 49.7% contrary to E (11.74%) and G × E (24.08%) effects. The AMMI model for gliadin: glutenin explained 90.13% of total variation where IPCA1 and IPCA2 explained 49.56 and 40.57% of variation, respectively.
Table 2. AMMI analysis of variance showing sum of squares, mean squares, % total variation explained and % variation explained by IPCA1 and IPCA2 for grain quality attributes among 28 bread wheat genotypes tested across four test environments.
4.2. Mean performance of genotypes for studied grain quality attributes across environments
Mean values and IPCA scores of grain quality attributes among heat and drought tolerant wheat genotypes across test environments are presented in Supplemental Table 1. Genotypes LM31, LM55, LM64, LM65, LM82 and LM100 recorded low gliadin contents of 0.32, 0.34, 0.28, 0.38, 0.37 and 0.32 mg ml−1 in that order, whereas LM13, LM22, LM23, LM44, LM71 and LM85 recorded high gliadin contents of > 0.8 mg ml−1 across environments. IPCA1 and IPCA2 scores for gliadin content varied from −0.26 to 0.73 and −0.32 to 0.34, respectively. Genotypes LM04, LM35, LM44, LM64, LM69, LM75, LM90, LM95 and LM100 had low IPCA1 and IPCA2 scores, whereas genotypes LM32, LM62 and LM73 recorded high IPCA1 and IPCA2 scores. Gluten content varied significantly (p < 0.001) among wheat genotypes with LM23, LM32, LM35, LM41, LM44, LM71, LM73, LM82, LM90 and LM100 recording higher gluten contents (> 11 mg ml−1) across test environments. Genotypes LM13, LM69, LM72, LM75 and LM81 recorded low (< 10 mg ml−1) gluten contents across environments. IPCA1 and IPCA2 scores for gluten content varied from −0.68 to 0.88 and −1.32 and 0.75, respectively. Genotypes with the lowest IPCA1 and IPCA2 scores were LM31 and LM88, whereas 12 genotypes (≈ 48%) recorded high IPCA1 and IPCA2 scores. Highly significant (P < 0.001) genotypic differences were observed for glutenin content across test environments. Nine (32%) of the studied genotypes recorded low (< 9 mg ml−1) glutenin content, whereas 19 (68%) of the genotypes recorded high (> 10 mg ml−1) glutenin content. Fifty percent (14) of the studied genotypes recorded high IPCA1 and IPCA2 scores; whereas only two genotypes (LM31 and LM64) recorded very low IPCA1 and IPCA2 scores for glutenin content. Total protein content varied among studied wheat genotypes across test environments. Genotypes LM64, LM69 and LM100 recorded low total protein contents of 16.13, 11.55 and 13.23% across test environments, respectively. Contrastingly, genotypes LM03, LM44, LM53, LM71, LM82, LM85, LM90 and LM95 recorded high total protein contents (> 24%) across test environments. IPCA1 and IPCA2 scores for total protein content varied from −1.42 to 1.32 and −0.98 and 0.80, respectively. Ratio of gliadin and glutenin varied significant among studied wheat genotypes across test environments. Genotypes LM13, LM22, LM23, LM71, LM72 and LM81 recorded high gliadin: glutenin ratios (> 0.1), whereas LM04, LM07, LM35, LM41, LM55, LM64, LM69, LM75, LM82 and LM100 recorded low gliadin: glutenin ratios (< 0.5). Most of the studied wheat genotypes recorded low IPCA1 and IPCA2 scores.
4.3. Identification of best performing genotypes using GGE biplot
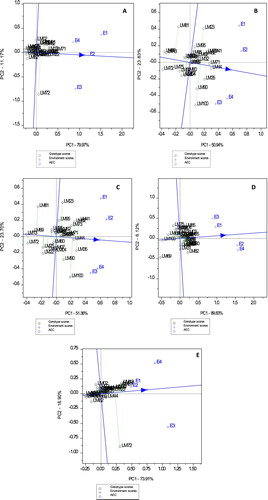
The GGE biplot of PC1 and PC2 scores showing which wheat genotypes performed best in which environments for studied traits is shown in (A–E). PC1 and PC2 accounted for 91.6% of total variation for gliadin content, which suggested sufficient GGE biplot model fit (Yang et al. Citation2009). To identify highly responsive genotypes with narrow adaptation (unstable), the polygon view of the GGE bi-plot is visualised by connecting genotypes furthest from the bi-plot origin with straight lines. As a result, genotypes LM02, LM32, LM71, LM72 and LM73 were located on the vertices of the polygon and were highly unstable for gliadin content ((A)). With regards to gluten content, genotypes LM13, LM23, LM41, LM44, LM69, LM72, LM81 and LM100 were highly responsive to environmental changes and located on the vertices of the GGE-biplot ((B)). The GGE biplot explained 75% of total variation for gluten (i.e. PC1 = 56.94%; PC2 = 23.83%) suggesting good-model fit. Heat and drought tolerant genotypes with highly responsive changes to environments with regards to glutenin contents were LM13, LM23, LM35, LM41, LM72, LM81, LM82 and LM100 ((C)). Genotypes LM55, LM60, LM69, LM75, LM82, LM85 and LM100 were located on the vertices of the polygon and were highly responsive to environmental influence with regards to total protein content ((D)). GGE biplot model total variation accounted for glutenin and protein contents were 75 (PC1 = 51.36%; PC2 = 23.7%) and 96% (PC1 = 89.83%; PC2 = 6.12%), respectively suggesting sufficient model-fit of the data. GGE biplot for gliadin to glutenin ratio explained 92.81% of total variation of which PC1 and PC2 explained 73.91 and 18.9% of total variation, respectively ((E)). Wheat genotypes such as LM02, LM13, LM71, LM72, LM81 and LM100 were highly responsive to environmental changes and located on the vertices of the polygon.
Figure 1. The ‘which-won-where’ view of the GGE biplot showing which heat and drought wheat genotypes performed best in which environments for gliadin content (A), gluten content (B), glutenin content (C), total protein content (D) and gliadin to glutenin ratio (E).

4.4. Identification of stable wheat genotypes
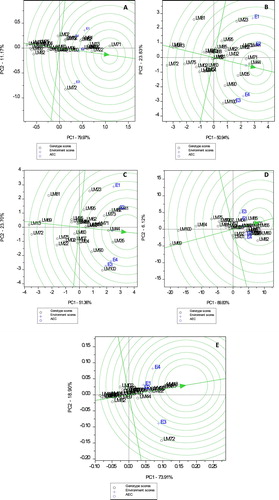
The average-environment coordination (AEC) view GGE biplot was used to determine stability among test genotypes for studied grain quality attributes ((A–E)). To determine stability, dotted vertical lines are projected from the AEC line with an arrow-head. Short projections from the AEC axis is indicative of high stability and vice-versa (Yan and Kang Citation2003; Yan et al. Citation2007). As a result, genotypes such as LM02, LM32, LM73, LM81, LM62 and LM72 which were located furthest from the AEC axis were highly unstable for gliadin content compared to other genotypes ((A)). With regards to gluten content, genotypes LM23, LM81, LM90 and LM100 were highly unstable whereas, LM31, LM32, LM41, LM44, LM55 and LM71 were relatively stable and closest to the AEC abscissa ((B)). Genotypes LM23, LM41, LM81, LM90, LM95 and LM100 were relatively unstable for glutenin content compared to LM32, LM444, LM60, LM71 and LM88 which were stable ((C)). With regards to total protein content, genotypes LM04, LM69, LM75, LM82 and LM85 were unstable, whereas LM35, LM55, LM71, LM73 and LM88 were relatively stable ((D)). Gliadin to glutenin ratio was unstable for genotypes LM02, LM13 and LM72 but stable for LM22, LM44, LM88 and LM90 ((E)).
Figure 2. The AEC GGE-biplot showing stability of heat and drought wheat genotypes tested across four environments for gliadin content (A), gluten content (B), glutenin content (C), total protein content (D) and gliadin to glutenin ratio (E).
4.5. Selection of ‘ideal’ and ‘non-ideal’ wheat genotypes
The GGE-biplot showing comparison of heat and drought tolerant wheat genotypes relative to the ‘ideal genotype’ for studied grain quality traits is shown in (A–E). The ideal genotype is indicated by the arrow head in the innermost concentric circle (Yan and Tinker Citation2006). As a result, genotypes LM22 and LM71 were identified as the most desirable genotypes for gliadin content. Genotypes LM55, LM72, LM82 and LM100 were among some ‘non-ideal’ genotypes located furthest from the ‘ideal’ genotype ((A)). Genotypes LM35, LM44 and LM71 were regarded as ‘ideal’ for gluten content. Some genotypes including LM13, LM69, LM72, LM95 and LM100 were furthest and regarded as ‘non-ideal’ genotypes for gluten content ((B)). Genotypes LM35, LM44 and LM71 were ‘ideal’ genotypes for glutenin content ((C)). With regards to total protein content, genotypes LM35, LM44, LM55, LM71 and LM85 were identified ‘ideal’ whereas, LM64, LM69 and LM100 were identified ‘non-ideal’ ((D)). LM13, LM71 and LM81 were identified ‘ideal genotypes’ for gliadin to glutenin ratios ((E)).
Figure 3. GGE comparison biplot comparing wheat genotypes relative to the ideal genotype (the centre of the concentric circles) for gliadin content (A), gluten content (B), glutenin content (C), total protein content (D) and gliadin to glutenin ratio (E).
5. Discussion
Developing wheat genotypes with excellent grain quality attributes is key for human nutrition and the market place (Nel et al. Citation2000a, Citation2000b; De Vita et al. Citation2007; Li et al. Citation2013; Guzmán et al. Citation2017). The present study determined genotype-by-environment interaction effect on grain quality among heat and drought tolerant bread wheat genotypes under simulated drought-stressed and non-stressed environments to select promising parents for breeding. Significant G × E for grain quality traits indicated differential genotypic responses across test environments. In the present study, G effects were larger for gluten content (55.42%), total protein content (67.78%) and ratio of gliadin to glutenin (49.77%) indicating suitable wheat genotypes could be selected for direct production or breeding. The low G × E on gluten and grain protein content suggested wheat genotypes were less influenced by environment for these traits. Large E effects for gluten (89.65%) and glutenin (89.06%) contents suggested significance influence of environment on these grain quality traits. Specific selection for gluten and glutenin is useful to minimise environmental influence.
Heat and drought tolerant wheat genotypes such as LM13, LM22, LM23, LM85, LM88, LM90 and LM95 were stable for gliadin contents recording high values of 0.93, 0.97, 0.93, 0.94, 0.72 and 0.67 mg ml−1 across test environments. High gliadin contents of these genotypes suggests their value in breeding for flour blending capacity and dough properties or improving gains in gliadin contents. Genotypes LM31, LM32, LM41, LM44, LM55 and LM71 were relatively stable for gluten content recording values of 10.89, 11.37, 12.15, 12.16, 10.80 and 11.94 mg ml−1 across test environments (Supplemental Table 1). The identified wheat genotypes in the present study are useful for breeding for enhanced gluten content. Glutenin play an important role in the development of dough viscoelasticity structures (Zhao et al. Citation2012). Wheat genotypes such as LM32, LM44, LM60, LM71 and LM88 recorded high values of glutenin contents of 10.69, 11.29, 10.08, 10.77 and 10.19 mg ml−1 across test environments. These are useful for breeding for dough elasticity/strength.
Grain protein content is key determinant of flour quality for food processing making this trait useful for improvement. Genotypes LM35, LM55, LM71, LM73 and LM88 were relatively stable for total protein contents (≥ 22%) compared to some widely cultivated wheat genotypes (≈ 14%) in South Africa (Labuschagne et al. Citation2014) and elsewhere (Amiri et al. Citation2015; Guzmán et al. Citation2017; Hernández-Espinosa et al. Citation2018). Genetic gains for protein content have been declining due to the negative inverse relationship with yield gains (Fufa et al. Citation2005; De Vita et al. Citation2007; Amiri et al. Citation2015; Sanchez-Garcia et al. Citation2015; Guzmán et al. Citation2017; Laidig et al. Citation2017). Genotypes identified in the present study are useful genetic material for breeding for improved gains in grain protein content. Gliadin: glutenin ratio is essential to maintain appropriate balance between dough viscosity and elasticity (Dhaka and Khatkar Citation2015). Wheat genotypes such as LM22, LM44, LM88 and LM90 were identified as stable for gliadin: glutenin ratio. The GGE comparison biplot ranking the studied heat and drought tolerant wheat genotypes relative to the ‘ideal genotype’ identified LM22 and LM71 as the most desirable genotypes for gliadin content ((A)). Genotypes LM35, LM44 and LM71 were ‘ideal’ for gluten content, whereas LM35, LM44 and LM71 were ‘ideal’ genotypes for glutenin content ((B,C)). Genotypes LM35, LM44, LM55, LM71 and LM85 were identified ideal for total protein content, whereas LM13, LM71 and LM81 were identified ‘ideal genotypes’ for gliadin to glutenin ratios ((D,E)). Theoretically, an ‘ideal genotype’ is high yielding for that trait and stable across test environments (Yan and Kang Citation2003; Yan and Tinker Citation2006), whereas a desirable genotype is located closer to the ‘ideal genotype’ (Yan Citation2001). The identified genotypes recorded high contents of studied grain quality attributes useful for strategic crossing to develop breeding populations aimed at improving genetic gains for grain quality traits. However, the present study showed genotypes excelling in a particular trait lacked in other traits complicating selection of suitable genotypes combining several grain quality attributes. As a result, principal component (PC) biplot superimposed with studied traits (Data not shown) was used to select genotypes possessing a combination of suitable grain attributes. The PC biplot explained 88.81% of total variation and aided identification and selection of 13 heat and drought tolerant wheat genotypes such as: LM03, LM22, LM23, LM41, LM44, LM60, LM62, LM71, LM73, LM71, LM85, LM90 and LM95 with high gliadin, gluten, glutenin, ratio of gliadin to glutenin and total protein content. Some genotypes such as LM22, LM44, LM73, LM73, LM90 and LM95 are high-yielders (> 2.8 tons/ha) (Thungo et al. Citation2019). The identified heat and drought tolerant wheat genotypes sourced from CIMMYT are useful genetic resources for developing breeding populations for improving grain quality traits for processing of high-quality wheat end-user products.
6. Conclusions
In conclusion, the present study determined G x E effect on grain quality among elite heat and drought tolerant bread wheat genotypes. Ideal genotypes with high protein composition and protein fractions were identified and selected for breeding for grain quality improvement. Strategic crossing of these genotypes may aid development of new families for improving processing quality of wheat products.
Supplemental Material
Download MS Word (18.5 KB)Acknowledgments
Financial support by the Winter Cereal Trust (WCT), the University of KwaZulu-Natal and the National Research Foundation (NRF) of South Africa are sincerely acknowledged. CIMMYT is thanked for providing wheat genotypes used in the study.
Disclosure statement
No potential conflict of interest was reported by the author(s).
ORCID
Jacob Mashilo http://orcid.org/0000-0001-9015-043X
Additional information
Funding
Notes on contributors
Zamalotshwa Thungo
Zamalotshwa Thungo is a PhD student in Plant Breeding at the University of KwaZulu-Natal, African Centre for Crop Improvement, South Africa.
Hussein Shimelis
Hussein Shimelis is a Plant Breeder and the Deputy Director for African Centre for Crop Improvement (ACCI) at the University of KwaZulu-Natal, South Africa.
Alfred Odindo
Alfred Odindo is a Crop Scientist in the Discipline of Crop Science, University of KwaZulu-Natal, South Africa.
Jacob Mashilo
Jacob Mashilo is a Crop Scientist at the Limpopo Department of Agriculture and Rural Development, Limpopo Province, South Africa.
References
- Abera G, Solomon W, Bultosa G. 2017. Effect of drying methods and blending ratios on dough rheological properties, physical and sensory properties of wheat–taro flour composite bread. Food Sci Nutr. 5:653–661. doi: 10.1002/fsn3.444
- Amiri R, Bahraminejad S, Sasani S, Jalali-Honarmand S, Fakhri R. 2015. Bread wheat genetic variation for grain’s protein, iron and zinc concentrations as uptake by their genetic ability. Eur J Agron. 67:20–26. doi: 10.1016/j.eja.2015.03.004
- Cossani CM, Reynolds MP. 2015. Heat stress adaptation in elite lines derived from synthetic hexaploid wheat. Crop Sci. 55:2719–2735. doi: 10.2135/cropsci2015.02.0092
- De Vita P, Li Destri Nicosia O, Nigro F, Platani C, Riefolo C, Di Fonzo N, Cattivelli L. 2007. Breeding progress in morpho-physiological, agronomical and qualitative traits of durum wheat cultivars released in Italy during the 20th century. Eur J Agron. 26:39–53. doi: 10.1016/j.eja.2006.08.009
- Dhaka V, Khatkar B. 2015. Effects of gliadin/glutenin and hmw-gs/lmw-gs ratio on dough rheological properties and bread-making potential of wheat varieties. J Food Qual. 38:71–82. doi: 10.1111/jfq.12122
- Flagella Z, Giuliani MM, Giuzio L, Volpi C, Masci S. 2010. Influence of water deficit on durum wheat storage protein composition and technological quality. Eur. J. Agron. 33:197–120. doi: 10.1016/j.eja.2010.05.006
- Fufa H, Baenziger PS, Beecher BS, Graybosch RA, Eskridge KM, Nelson LA. 2005. Genetic improvement trends in agronomic performances and end-use quality characteristics among hard red winter wheat cultivars in Nebraska. Euphytica. 144:187–198. doi: 10.1007/s10681-005-5811-x
- Gauch HG. 1992. Statistical analysis of regional yield trials: AMMI analysis of factorial designs. Amsterdam: Elsevier Science Publishers.
- Giunta F, Pruneddu G, Motzo R. 2019. Grain yield and grain protein of old and modern durum wheat cultivars grown under different cropping systems. Field Crops Res. 230:107–120. doi: 10.1016/j.fcr.2018.10.012
- Godfrey D, Hawkesford MJ, Powers SJ, Millar S, Shewry PR. 2010. Effects of crop nutrition on wheat grain composition and end use quality. J Agric Food Chem. 58:3012–3021. doi: 10.1021/jf9040645
- Guzmán C, Autrique E, Mondal S, Huerta-Espino J, Singh RP, Vargas M, Crossa J, Amaya A, Peña RJ. 2017. Genetic improvement of grain quality traits for CIMMYT semi-dwarf spring bread wheat varieties developed during 1965–2015: 50 years of breeding. Field Crops Res. 210:192–196. doi: 10.1016/j.fcr.2017.06.002
- Guzmán C, Autrique JE, Mondal S, Singh RP, Govindan V, Morales-Dorantes A, Posadas-Romano G, Crossa J, Ammar K, Javier Peña R. 2016. Response to drought and heat stress on wheat quality, with special emphasis on bread-making quality, in durum wheat. Field Crops Res. 186:157–165. doi: 10.1016/j.fcr.2015.12.002
- Hernández-Espinosa N, Mondal S, Autrique E, Gonzalez-Santoyo H, Cross J, Huerta-Espino J, Singh RP, Guzmán C. 2018. Milling, processing and end-use quality traits of CIMMYT spring bread wheat germplasm under drought and heat stress. Field Crops Res. 215:104–112. doi: 10.1016/j.fcr.2017.10.003
- James C. 1995. Analytical chemistry of foods. Blackie academic and Professional press. Chemistry. 46:4358–4362.
- Labuschagne MT, Mkhatywa N, Wentzel B, Johansson E, van Biljon A. 2014. Tocochromanol concentration, protein composition and baking quality of white flour of South African wheat cultivars. J Food Comp Anal. 33:127–131. doi: 10.1016/j.jfca.2013.12.003
- Laidig F, Piepho HP, Rentel D, Drobek T, Meyer U, Huesken A. 2017. Breeding progress, environmental variation and correlation of winter wheat yield and quality traits in German official variety trials and on-farm during 1983–2014. Theor Appl Genet. 130:1–23. doi: 10.1007/s00122-016-2784-1
- Landry J, Moureaux T. 1970. Heterogeneity of glutelins of corn seeds-Selective extraction and composition of amino acids of 3 isolated fractions. Bull Soc Chim Biol. 52:1021.
- Li YF, Wu Y, Hernandez-Espinosa N, Pena RJ. 2013. Heat and drought stress on durum wheat: responses of genotypes, yield, and quality parameters. J. Cer. Sci. 57:398–404. doi: 10.1016/j.jcs.2013.01.005
- Luo L, Hui X, Wang Z, Zhang X, Xie Y, Gao Z, Chai S, Lu Q, Li T, Sun M, Chang L. 2019. Multi-site evaluation of plastic film mulch and nitrogen fertilization for wheat grain yield, protein content and its components in semiarid areas of China. Field Crops Res. 240:86–94. doi: 10.1016/j.fcr.2019.06.002
- Malik AH, Kuktaite R, Johansson E. 2013. Combined effect of genetic and environmental factors on the accumulation of proteins in the wheat grain and their relationship to bread-making quality. J Cer Sci. 57:170–174. doi: 10.1016/j.jcs.2012.09.017
- Migliorini P, Spagnolo S, Torri L, Arnoulet M, Lazzerini G, Ceccarelli S. 2016. Agronomic and quality characteristics of old, modern and mixture wheat varieties and landraces for organic bread chain in diverse environments of northern Italy. Eur J Agron. 79:131–141. doi: 10.1016/j.eja.2016.05.011
- Mwadzingeni L, Shimelis H, Tesfay S, Tsilo TJ. 2016. Screening of bread wheat genotypes for drought tolerance using phenotypic and proline analyses. Front Plant Sci. 7:1–12. doi: 10.3389/fpls.2016.01276
- Nel M, Agenbag G, Purchase J. 2000a. Sources of variation in spring wheat (Triticum aestivum L.) cultivars of the Western and Southern Cape. II. baking characteristics. S Afr J Plant Soil. 17:40–48. doi: 10.1080/02571862.2000.10634863
- Nel MM, Agenbag GA, Purchase JL. 2000b. Sources of variation in spring wheat (Triticum aestivum L.) cultivars of the Western and Southern Cape. I. Milling and dough development characteristics. S Afr J Plant Soil. 17:30–39. doi: 10.1080/02571862.2000.10634862
- Reynolds MP, Pask AJD, Hoppitt WJE, Sonder K, Sukumaran S, Molero G. 2017. Strategic crossing of biomass and harvest index-source and sink-achieves genetic gains in wheat Euphytica. Vol. 213.
- Rozbicki J, Ceglińska A, Gozdowski D, Jakubczak M, Cacak-Pietrzak G, Madry W, Golba J, Piechociński M, Sobczyńki G, Studnicki M, Drzazga T. 2015. Influence of the cultivar, environment and management on the grain yield and bread-making quality in winter wheat. J Cer Sci. 61:126–132. doi: 10.1016/j.jcs.2014.11.001
- Sanchez-Garcia M, Álvaro F, Peremarti A, Martín-Sánchez JA, Royo C. 2015. Changes in bread-making quality attributes of bread wheat varieties cultivated in Spain during the 20th century. Eur J Agron. 63:79–88. doi: 10.1016/j.eja.2014.11.006
- Schalk K, Lexhaller B, Koehler P, Scherf KA. 2017. Isolation and characterization of gluten protein types from wheat, rye, barley and oats for use as reference materials. PLoS One. 12:e0172819. doi: 10.1371/journal.pone.0172819
- Shewry PR, Popineau Y, Lafiandra D, Belton P. 2001. Wheat glutenin subunits and dough elasticity: findings of the EUROWHEAT project. Trends Food Sci Technol. 11:433–441. doi: 10.1016/S0924-2244(01)00035-8
- Subira J, Peǹa RJ, Alvaro F, Ammar K, Ramdani A, Royo C. 2014. Breeding progress in the pasta-making quality of durum wheat cultivars released in Italy and Spain during the 20th Century. Crop Past Sci. 65:16–26. doi: 10.1071/CP13238
- Thungo Z, Shimelis H, Odindo AO, Mashilo J. 2019. Genotype-by-environment interaction of elite heat and drought tolerant bread wheat (Triticum aestivum L.) genotypes under non-stressed and drought-stressed conditions. Acta Agric Scand Section B — Soil Plant Sci. 70:177–194. https://doi.org/10.1080/09064710.2019.1646797.
- Uthayakumaran S, Gras PW, Stoddard FL, Békés F. 1999. Effects of varying protein content and glutenin-to-gliadin ratio on the functional properties of wheat dough. Cer Chem. 23:33–42.
- Velu G, Singh RP, Huerta J, Guzmán C. 2017. Genetic impact of Rht dwarfing genes on grain micronutrients concentration in wheat. Field Crops Res. 214:373–377. doi: 10.1016/j.fcr.2017.09.030
- Wieser H, Antes S, Seilmeier W. 1998. Quantitative determination of gluten protein types in wheat flour by reversed-phase high-performance liquid chromatography. Cer Chem. 75:644–650. doi: 10.1094/CCHEM.1998.75.5.644
- Wollmer AC, Pitann B, Mühling KH. 2018. Grain storage protein concentration and composition of winter wheat (Triticum aestivum L.) as affected by waterlogging events during stem elongation or ear emergence. J Cer Sci. 83:9–15. doi: 10.1016/j.jcs.2018.07.007
- Xue C, Erley GSA, Rossmann A, Schuster R, Koehler P, Mühling KH. 2016. Split nitrogen application improves wheat baking quality by influencing protein composition rather than concentration. Front. Plant Sci. 7:738. doi: 10.3389/fpls.2016.00738
- Yan W. 2001. GGE biplot – a windows application for graphical analysis of multi-environment trial data and other types of two-way data. Agron J. 93:1111–1118. doi: 10.2134/agronj2001.9351111x
- Yan W, Cornelius PL, Crossa J, Hunt LA. 2001. Two types of GGE biplots for analyzing multi-environment trial data. Crop Sci. 41:656–663. doi: 10.2135/cropsci2001.413656x
- Yan W, Hunt LA, Sheng Q, Szlavnics Z. 2000. Cultivar evaluation and mega environment investigation based on the GGE biplot. Crop Sci. 40:597–605. doi: 10.2135/cropsci2000.403597x
- Yan W, Kang MS. 2003. GGE biplot analysis: a graphical tool for breeders, geneticists, and agronomists. Boca Raton, FL: CRC Press.
- Yan W, Kang M, Ma B, Woods S, Cornelius P. 2007. GGE biplot vs AMMI analysis of genotype-by-environment data. Crop Sci. 47:643–655. doi: 10.2135/cropsci2006.06.0374
- Yan W, Tinker NA. 2006. Biplot analysis of multi-environment trial data: Principles and applications. Can J Plant Sci. 86:623–645. doi: 10.4141/P05-169
- Yang RC, Crossa J, Cornelius PL, Burgueno J. 2009. Biplot analysis of genotype × environment interaction: proceed with caution. Crop Sci. 49:1564–1576. doi: 10.2135/cropsci2008.11.0665
- Zhao L, Li L, Liu G, Chen L, Li X, Li B. 2012. Fractional separation and estimation of Mark–houwink–sakurada equation parameters for gluten. Int J Food Eng. 8:1–15. doi: 10.1515/1556-3758.2667