
ABSTRACT
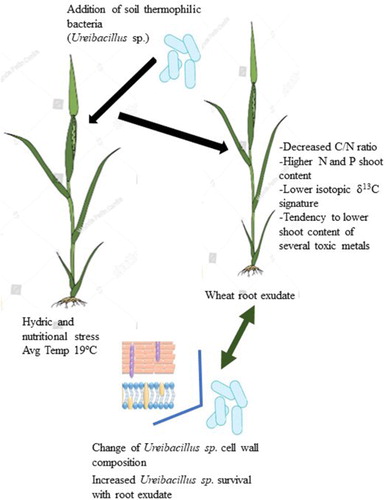
The effect of a soil thermophilic bacteria (STB), Ureibacillus sp. 18UE/10 on the status of wheat plants was evaluated. A greenhouse assay was performed, mimicking scenarios of soil impoverishment and aridity, which included Rhizophagus irregularis, a crop enhancer AMF, for effect comparison. Treatments with strain 18, R. irregularis or both had no significant effect on biomass production, however affected plant physiology. A different partition in biomass, nitrogen and carbon content were observed, resulting in a decreased C/N ratio. Elemental analysis showed an increase in N and P content in shoots, and for treatments containing STB a decrease in the content of several toxic metals. Strain 18 had a distinct δ13C isotopic signature translating an increased stomatal conductance. ATR-IR spectroscopy revealed that root exudate influenced STB cell wall structure and increased the bacterial survival rate at 25°C. These findings show that STB can interact with a plant partner under rhizospheric conditions.
GRAPHICAL ABSTRACT
1. Introduction
Ongoing global climate change will have major impacts on ecosystems services, mainly on those related with agriculture. Climate change together with the increased food demand are major triggers to enhance research in agriculture related areas, aiming at improving crop productivity and sustainability. In this context, innumerous research reports are found on the use of Plant Growth Promoting Rhizobacteria. PGPR colonize the plants’ rhizosphere and enhance their growth through direct and indirect mechanisms, many can relieve abiotic or biotic plant stress. PGPR can improve nutrient availability, synthesize phytohormones or affect plants’ hormone production, outcompete phytopathogens, enhance symbiotic relations (Lugtenberg and Kamilova Citation2009), and improve successful phytoremediaton of metal-contaminated sites (Tak et al. Citation2013). The use of PGPR as biofertilizers is a promising tool, an alternative to efficiently promote crop yield with decreased environmental impacts (Das et al. Citation2013). In addition to the finding and study of PGPR, considerable research has also been done using omic technologies to assess the structural and functional composition of rhizomicrobiomes and how the complex rhizosphere interactions can be engineered for enhancing crop production (Savka et al. Citation2013; Zhang et al. Citation2017). For instance, the plant host exudate can be bred to establish a biased phytosphere, one that favors the persistence of bacteria able to use the novel metabolic resources produced by the plant; from studies of microbial community structure the evaluation and impact of changing host rhizosphere chemistry on the rhizomicrobiome composition can be more fully assessed (Savka et al. Citation2013).
Despite this research investment, there is still scarce information on the plant-soil microbiome interactions and on the contribution of microorganisms to plant and soil functioning. The role of soil thermophilic bacteria (STB) of the Firmicutes phylum (e.g. Geobacillus), a group suggested to have a ubiquitous presence in soils as viable cells, including vegetative forms (Marchant et al. Citation2002b, Citation2008; Portillo et al. Citation2012), has been overlooked. In temperate soils, these STB can take advantage of periodic heat events to proliferate. Previous studies showed that these thermophiles actively participate in the cycling of C, N, S (Portillo et al. Citation2012; Santana et al. Citation2013) and P in soils (Gonzalez Grau et al. Citation2016) processing organic matter and providing inorganic nutrients to either plants or other microbes; noteworthy, STB are major actors in organic sulfur mineralization, being able to release significant quantities of sulfate under high temperature conditions as a product of their metabolism, an important finding that refutes the prevailing view of bacteria as poor S-mineralizers (Eriksen Citation1996). STB extracellular enzymes, involved in organic matter mineralization in soils, are apparently fitted to function under high temperature and low water availability (Moxley et al. Citation2019), conditions encountered during extreme heat events at top-soils. Global warming trends are expected to increase the frequency of extreme heat events. Thus, the role of soil thermophiles is expected to gain importance, with consequences at soil ecosystems.
In this work, the effect of a thermophilic strain, Ureibacillus sp. 18UE/10 (further strain 18) on the status of wheat (Triticum durum, cultivar Marialva) plants was evaluated and compared to the effect of a soil inoculant used in agriculture, the arbuscular mycorrhizal fungi Rhizophagus irregularis, known to colonize several crops. The results showed that this strain, as the AMF, influenced the partition of biomass, nitrogen and carbon, and plant elemental composition; the content of N and P increased in the shoot tissue with both inoculants compared with the control, however, contrarily to the AMF, the bacterial and/or the AMF plus STB treatment lowered the plant content of several toxic metals. Strain 18 treatment also showed a significant different δ13C isotopic signature indicative of an increased stomatal conductance. These effects where observed for experiments performed at an average temperature of 19°C, i.e. outside the permissive temperature range for STB proliferation. Moreover, the cell-wall structure of this STB changed in the presence of wheat-root exudate, suggesting molecular response mechanisms between potential partners: plant and STB. A novel exploratory road is opened, one that includes the study of STB and their interaction with plant crops and the prospect to modulate such interactions at different seasonal temperatures.
2. Materials and methods
2.1. Biological materials
Ureibacillus sp. 18UE/10 has been previously isolated and characterized (Santana et al. Citation2013). This strain, named strain 18 throughout this report for simplification, is a thermophilic bacterium with optimum growth between 50°C and 60°C and minimum growth-temperature value over 25°C.
Rhizophagus irregularis spores (Mycorise ASP) were purchased from OMRI (Organic Materials Review Institute) and diluted in demineralized water before inoculation at ca 30 spores/mL.
Triticum durum seeds (Marialva cultivar) were surface sterilized using the following procedure: gentle mixing in ethanol 70% for 1.5 min, wash with sterile demineralized water (three times), gentle mixing with chlorine bleach (sodium hypochlorite ca 5%) for 3 min followed by wash in sterile demineralized water (10 times). Seeds were then soaked for 12 h in sterile demineralized water under mild agitation at 600 rpm (platform shaker Titramax 100, Heidolph). Finally, they were heated for 50°C 10 min and used immediately in the procedures below, after water removal.
In order to get wheat root exudates, surface-sterilized seeds were placed in square Petri dishes (12 × 12 cm2) containing 1.5% agar (w/v). The Petri dishes were left in the dark at 28°C, in a TC 255 S Lovibond incubator, until the formation of young roots (6 days old plants) and then transferred to an inverted sterile tip box filled with 100 mL of ultra-pure sterile water. Twenty seedlings developed inside this box, which was placed for 10 days in a growth chamber with a 16 h photoperiod at 25°C and 8 h dark at 21°C. After this period, the solution in the tip box containing the root exudate was collected, concentrated ca twofold using a SpeedVac Savant DNA110, sterile-filtered and kept at −20’C.
2.2. Attenuated Total Reflection-Infrared (ATR-IR) spectroscopy
Strain 18 was grown in duplicate in ½ Nutrient Broth Biokar (½ NB: 5 g tryptone, 2.5 g meat extract, 2.5 g sodium chloride, pH 7.2) at 50°C, 180 rpm, until early stationary phase. Cultures were diluted to an OD 600 nm between 0.2 and 0.3, i.e. ca 107 cfu/mL in fivefold diluted ½ NB, which contained or not the wheat root exudate (1 mL to 20 mL diluted ½ NB). Cultures with and without exudate were incubated at 50°C or 25°C, at 180 rpm (orbital shaker Lab companion, Jeio tech, IST 4075) for 24 h. The cultures were centrifuged at 3100 × g for 15 min in an Eppendorf 5810R centrifuge and the pellets were washed with sterile ultra-pure water and kept at −20°C. Aliquots of each of three independent cultures per test condition were taken before and at the end of the 24 h period for serial dilutions and plating: 100 μL of appropriate dilutions were plated in ½ NBA (½ NB with 15 g/L agar Bacteriological grade, HiMedia) for determination of cfu/mL value following plate incubation at 50°C.
Before spectroscopy, samples were defrozen and resuspended at ca 100 mg/mL in sodium chloride 0.85% (w/v), previously sterilized by filtration with a Minisart filter (Sartorius) with a pore size of 0.2 µm. FTIR analyses were carried out using a Nicolet 6700 spectrometer (Thermo, Italy) equipped with a Smart Multi-Bounce Horizontal Attenuated Total Reflectance (HATR) device, with zinc selenide (ZnSe) crystal. Spectra were recorded in the 4000–650 cm−1 range at a resolution of 4 cm−1, averaging 128 scans per sample. Data were collected with Omnic 3.1 software. Aliquots with a minimum of 25 μl were required for each measurement. Each sample was deposited on the surface of the ATR crystal and evaporated to dryness under compressed air flow. Normalization and analysis of spectral data were done using SpectraGryph 1.2. software (Version 1.2.11).
2.3. Greenhouse assay
A greenhouse assay was performed to evaluate the effect of the addition of strain 18 and/or R. irregularis on the growth of stressed wheat plants. Surface sterilized wheat seeds were sowed in a mixture of vermiculite and sand (1:1 volume). Germination was visible after 4 days, and 10 days after germination similar plants were transplanted into with 9.5 cm × 13 cm pots containing the same, moisturized, mixture.
Strain 18 was grown in ½ NB at 50°C, 180 rpm (Comecta orbital shaker, 200D). Cells were collected at early stationary growth by centrifugation of the culture (3100 × g for 15 min in an Eppendorf 5810R centrifuge) and resuspended at 108 cfu/mL in 100 mM sterile MgSO4. The above wheat plants were irrigated with 3 mL of the bacterial suspension and/or with a suspension containing ca 30 spores of R. irregularis. Controls without inocula (irrigation with 3 mL of 100 mM MgSO4) were included in the experiment. Each irrigation condition included five plant replicas. A reinforcement of the bacteria inoculum was made at 16 and 35 days after the first inoculation.
To establish the watering to apply in the assay, the field capacity of the sand:vermiculite mixture was previously assessed by saturation of pre-weighted mixture samples with excess of irrigation water. The saturated samples were covered with aluminum foil to prevent evaporation and left to equilibrate for 3 days. The samples were then weighted, dried at 105°C and weighted again after 24 h and 72 h. The calculated moisture content in the substrate sample is said to be at field capacity.
Plants were watered with 50 mL of tap water (between 25% and 30% field capacity) or Hoagland modified solution (KNO3 1.5 mM, Ca(NO3)2.4H2O 1 mM, NH4H2PO4 0.5 mM, MgSO4.7H2O 0.25 mM, KCl 50 µM, H3BO3 25 µM, MnSO4.H2O 2 µM, ZnSO4.7H2O 2 µM, CuSO4.5H2O 0.5 µM, (NH4)6Mo7O2.4H2O 0.5 µM, FeNaEDTA 20 µM) every 5 days for 20 days, and then with 20 mL of Hoagland modified solution every 10 days. By this way, water stress is higher in older plants (with ca 4 leaves) few days after the bacterial addition at day 16th; soil volumetric water content, as measured with Wet sensor (WET-UM-1.4, Delta-T-Devices), was between 17% and 21% for the first watering regime and 5% and 8%, for the second. Throughout the assay, the average maximum and minimum temperatures in the greenhouse were 27°C and 10°C, respectively.
Plants were collected two months after the initial transplantation for determination of several parameters including the fresh and dry weight of shoots and roots. Root fragments of two plant replicas (ca 40 mg/ root) were also collected, maintained at 4°C in a mixture ethanol:water for further mycorrhiza coloration with trypan blue (Phillips and Hayman Citation1970).
2.4. Elemental and isotopic analysis
Dry shoots and roots were grinded separately with a Retsh mixer Mill MM 200 and send to the Stable Isotopes and Instrumental Analysis Facility unit at cE3c for carbon and nitrogen elemental and isotope ratio analysis by Isotope-ratio mass spectrometry (IRMS). Plant ionomics was performed by Inductively Coupled Plasma Optical Emission Spectroscopy (ICP-OES) at the ‘Centro de Edafología y Biología aplicada del Segura’ (CEBAS-CSIC), Murcia, Spain.
2.5. Statistical analysis
Comparisons between two groups using Student’s t-test, and ANOVA analysis (Sokal and Rohlf Citation1981) were performed using the IBM SPPS25 software to compare significant differences (P < 0.05) among treatments. Tukey’s post hoc test was used to test differences between multiple samples. Linear discriminant analysis (LDA) was used to investigate whether shoot and root mineral element composition was characteristic of a given treatment using the PAST v2.17c statistical software. Data were standardized before running LDA.
3. Results
3.1. Plant physical parameters
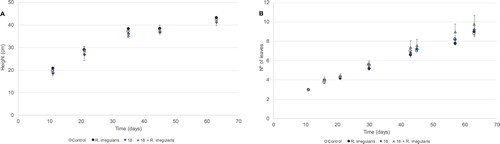
The height and number of leaves of wheat plants was measured throughout the greenhouse assay as an estimation of the differential growth between the treatments. A very slight increase of height was observed for the treatment with R. irregularis ((A)). On the other hand, there was a slim tendency to a higher number of leaves in plants treated with both the bacteria and the AMF ((B)). Overall, indicates a similar growth among the tested conditions.
Figure 1. Average height (A) and number of leaves (B) of growing wheat plants in the greenhouse. Ureibacillus sp. 18UE/10 is marked as 18, 18+R. irregularis represents the treatment with both the bacteria and the arbuscular mycorrhiza Rhizophagus irregularis. Symbols representing average data are as follows: control (open circles), R. irregularis (closed circles), strain 18 (diamonds) and strain 18+R. irregularis (triangles). Vertical bars indicate SE (n = 5).
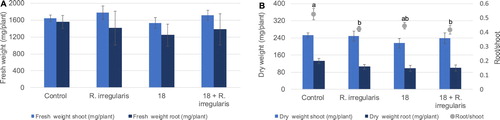
Fresh and dry weight of plants are represented in . Although the addition of R. irregularis either alone or together with strain 18 caused a slight increment of shoot fresh weight of 8% and 4% ((A)), respectively, the dry weight was similar to the control ((B)). AMF addition resulted in a global dry weight reduction of 8%, and a root biomass reduction of 21%. Strain 18 addition decreased both fresh and dry weight and caused a total biomass reduction of 19%, namely a 14% and 26% decrease in shoot and root dry weight, respectively, compared with the control, which was, however, not statistically significant ((B)). The inoculation caused a reduction on root/shoot ratio, which was of ca 20% for R.irregularis treatment and 21% for the joint treatment with the AMF and strain 18 ((B)).
Figure 2. Average fresh (A) and dry weight (B) of growing wheat plants in the greenhouse assay. Light and darker columns represent shoots and roots, respectively. In B, root/shoot ratio is represented by dots. Ureibacillus sp. 18UE/10 is marked as 18, 18+R. irregularis refers to the treatment with both the bacteria and the arbuscular mycorrhiza Rhizophagus irregularis. Vertical bars indicate SE (n = 5). The different letters indicate results that are statistically significantly different (P < 0.05).
3.2. Elemental and isotope composition
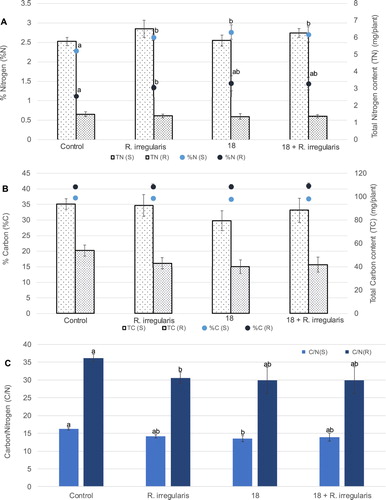
The addition of strain 18 and/or of R. irregularis caused an increment on N content in both shoots and roots of wheat plants which was of 21% and 29%, respectively, for strain 18. However, in terms of total N content in plant biomass, there was a reduction in N incorporation in the plant roots compared with the control, while a slight enhancement in the shoots. This reduction was similar for the different treatments, e.g. of 9% for the bacterial addition ((A)). On the other hand, C content was not changed with the introduction of the bacteria and/or of the AMF. When considering the total carbon assimilation, a reduction of 15% in C shoot incorporation was observed for the treatment with bacterial addition, however not statistically significant, but all treatments caused a similar decrease of the carbon incorporation in the root, e.g. of ca 26% for strain 18% and 23% for the joint addition ((B)). The output was a decrease in the C/N ratio for the shoot and root of wheat plants subjected to the bacterial or AMF treatments ((C)).
Figure 3. Average total nitrogen (A) and carbon (B) assimilation as well as content (in percentage) for shoots and roots of wheat plants from the greenhouse assay. The columns with the lighter and darker pattern represent total N or C in plant shoot and root, respectively. Average nitrogen and carbon percentages for shoots and roots are represented by lighter and darker dots, respectively. Characters TN, TC, %N and %C, inserted in the graphs, represent total nitrogen, total carbon, N content (%) and C content (%), respectively. In (C) the ratio between carbon and nitrogen content is represented for the plants’ shoot (light column) and root (darker column). Characters C/N (S) and C/N (R), inserted in the graph, represent average C/N ratio for shoots and roots, respectively. Other terms are as in the legend of the precedent figures. Vertical bars indicate SE (n = 5). The different letters indicate results that are statistically significantly different (P < 0.05).
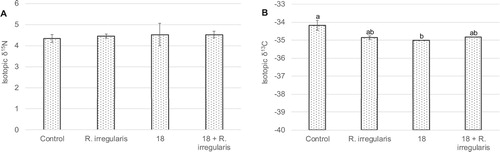
The isotopic ratios δ15N and δ13C were determined for plants’ shoot and are represented in (A,B), respectively. For δ15N, increments of 2% and 4% were observed for the AMF addition and for the addition of strain 18 either alone or in the joint treatment, respectively. However, these were not found to be statistically significant. For δ13C, a difference of 2% was obtained when R. irregularis and/or strain 18 were added, which was statistically significant for strain 18; the distinct isotopic signature translated a carbon isotope separation effect caused by strain 18 addition.
Figure 4. Average ratio of nitrogen isotopes 15N/14N (δ15N) (A) and of carbon isotopes 13C/12C (δ13C) (B) in shoots from wheat plants grown in the greenhouse. Ureibacillus sp. 18UE/10 is marked as 18, 18+R.irregularis represents the treatment with both the bacteria and the arbuscular mycorrhiza Rhizophagus irregularis. Vertical bars indicate SE (n = 3). The different letters indicate results that are statistically significantly different (P < 0.05).
3.3. Plant ionomics
Inoculation with strain 18, AMF or both caused a change in the content of several elements and in some cases a different partition of an element between root and shoot ( and ). An important example is P: the STB treatment, as the AMF inoculation, lead to a significant increase of shoot P content (a 25% increase for strain 18 compared with the control), but not of root P content (). Total phosphorus incorporation in the root was reduced by STB treatments (a significant 34% reduction for the joint treatment compared with the AMF addition). Also, the joint treatment caused nickel content to decrease by 59% in the plant root as compared with the average content in control plants, resulting in a higher shoot/root nickel content ratio.
Figure 5. Average total phosphorus assimilation as well as content (in percentage) for shoots and roots of wheat plants from the greenhouse assay. The columns with the lighter and darker pattern represent total P in plant shoot and root, respectively. Average phosphorus percentages for shoots and roots are represented by lighter and darker dots, respectively. Characters TP and %P, inserted in the graphs, represent total phosphorus and P content (%), respectively. Characters (S) and (R), inserted in the graph, represent shoots and roots, respectively. Other terms are as in the legend of the precedent figures. Vertical bars indicate SE (n = 5). The different letters indicate results that are statistically significantly different (P < 0.05).
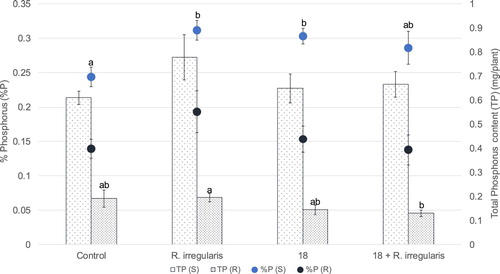
Table 1. Content of ionomic elements in shoot tissue.
Table 2. Content of ionomic elements in root tissue.
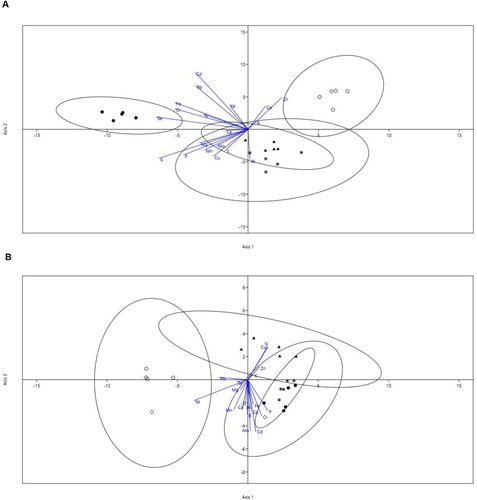
An LDA was performed to assess the relation between the treatments and the content of several ion elements ((A,B)). The discriminant analysis for shoot mineral elements separated nutrient signature data from the control, the bacterial strain 18 and the AMF treatment, because respective ellipses did not overlap, indicating inoculation treatment-specific ionomes, whereas data from the joint treatment greatly overlapped with those of the strain 18 treatment ((A)). The most informative elements loading the first axis were Se, K, Fe, Cr and P, while the metals Cd, Pb, Zn and Al loaded the most on the second axis. For root mineral elements, the discriminant analysis separated data of the control treatment from the three inoculation treatments, which data overlapped ((B)). However, the 95% confidence intervals of the mean scores for each treatment indicated an overlapping between the control and strain 18 treatments. Ni, Pb, and P loaded most on the first axis, while Cd, Mo, Si and Cu loaded most on the second axis. Overall, discriminant analysis representations led to a separation between control and inoculation treatments.
Figure 6. Linear discriminant analysis (LDA) of shoot (A) and root (B) element content by treatment. Symbols represent individual data from Control (open cicles), R. irregularis (closed circles), bacterial strain 18 (triangles) and strain 18+R. irregularis (asteriks) treated plants. Discriminant axis 1 (xx) accounts for 64% and discriminant axis 2 (yy) for 31% of the variance for shoot concentration, and 77% (axis 1) and 13% (axis 2) for root concentration. Ellipses that enclose data points represent regions that include 95% of the theoretical distribution of scores for each treatment. The length of each eigenvector is proportional to the variance in the data for that element.
3.4. Cell surface analysis and viability of strain 18
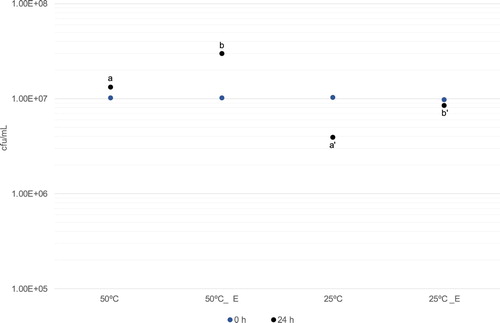
Switching the temperature of strain 18 from 50°C to 25°C (see ‘Materials and Methods’) caused a decrease of ca threefold of the cfu/mL value after 24 h of incubation. However, addition of wheat root exudate prevented that drop, the cfu/mL was increased twofold compared with the 24 h incubation at 25°C without the exudate ().
Figure 7. Effect of wheat root exudate(_E) on the number of colony-forming units (cfu) per mL, after 24 h growth at 50°C and at 25°C. Initial and final (after 24 h) cfu/mL are indicated by light and darker dots, respectively. The different letters a or a’ versus b or b’ indicate results that are statistically significantly different at P < 0.0002 according to Student’s t-test. Values for SD (n = 3) are smaller than the represented symbols.
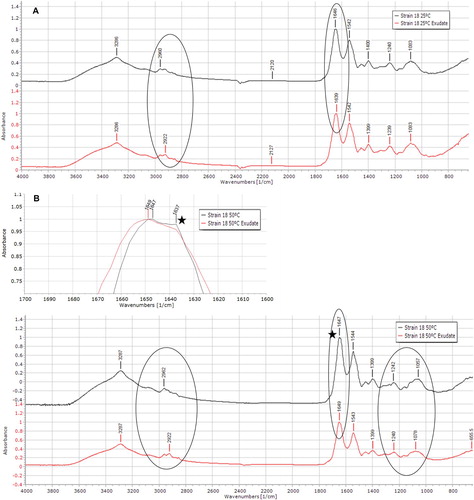
Strain 18 cells were collected from the cultures at 50°C and 25°C for analysis of their cell surface by ATR-IR. Recorded spectra are shown in , where shifts in peaks maximum are pointed out. At 25°C, the presence of the exudate shifted the maximum of the band at 1600–1700 cm−1 region, from 1646 to 1639 cm−1. At 50°C, with no exudate, the band had a prominent shoulder at 1637 cm−1 (max 1647 cm−1), whereas with exudate that shoulder was reduced ((B)). In the 2890–3000 cm−1 range, a peak at 2922 cm−1 was visible at 25°C with exudate addition, whereas without exudate a plateau was observed between 2926 and 2931 cm−1 following a higher shoulder at 2922 cm−1, resulting in a broader band with no defined maximum. A peak maximum at 2922 cm−1 was also present at 50°C with exudate but absent without exudate. Other differences were observed in the 50°C spectra, namely in the 800–1350 cm−1 region. Two peak maxima, at 1057 and 1078 cm−1, were differently expressed at 50°C without and with exudate. Additionally, a shoulder at 1118 cm−1 was detected at 50°C without the exudate.
Figure 8. Normalized spectra of Ureibacillus sp. 18UE/10 (strain 18) cultured at 25°C (A) and 50°C (B) in the absence (top spectrum) or presence (bottom spectrum) of wheat root exudate. The ellipses highlight the regions where differences caused by the exudate addition are visible. The zone marked with a star symbol, next to the 50°C spectra, is expanded at the top of the (B) panel to highlight the prominent shoulder at 1637 cm−1.
4. Discussion
Marchant et al. (Citation2002a, Citation2002b) were able to isolate significant numbers of thermophilic arerobic soil bacteria from several locations in the globe, including cool soil environments, proposing their ubiquity in soils. Actually, the presence of thermophilic bacteria in cool environments has been reported long before. For instance, Bartholomew and Paik (Citation1966) refer that ‘the presence of obligate thermophilic bacteria in an environment having a constant temperature of about 4°C is difficult to explain.’ Their survival mechanisms at low temperature were also tackled by Marchant et al. (Citation2008) when they showed population increases at 4°C could be ‘accounted for by very slow growth rates complemented by negligible death rates.’ In warmer temperate soils, these thermophilic bacteria may take advantage of heat seasonal periods to grow at higher rates. An ecological role was proposed for these thermophiles, which belong to a narrow group of genera (Bacillus, Geobacillus, Parageobacillus, Ureibacillus and Brevibacillus). These soil thermophilic bacteria (STB) perform a dissimilative organic sulfur-oxidizing process that mineralizes organically bound sulfur (Portillo et al. Citation2012; Santana et al. Citation2013); the metabolic pathways at the basis of this process, which generates sulfate (and ammonium) from proteinaceous consumption, compounds to be used to either plants or other microbes, were inferred (Santana et al. Citation2016). It has indeed been shown, namely for Ureibacillus sp. 18UE/10, that cell culture supernatant, containing soluble sulfate and ammonium, stimulated tobacco seedling development (Santana et al. Citation2013). These soil thermophiles surely have an important role in soil fertilization, which also relates to the activity of soil extracellular enzymes that increase at temperatures between 45°C and 75°C (Gonzalez et al. Citation2015) and at low values of water activity (Moxley et al. Citation2019).
The Ureibacillus sp. 18UE/10 strain, previously characterized (Santana et al. Citation2013), showed optimal growth between 50°C and 60°C and minimal growth was between 25°C and 30°C. Further characterization assessed this strain as a potential producer of indole-3-acetic acid auxin, a PGPR biochemical trait, as revealed by Salkowski colorimetric technique (author unpublished results). Here, experiments were designed to assess if this soil thermophilic bacteria can interact with plants under conditions that can be found in the rhizosphere and to infer any potential of the strain to be used directly as a PGP, namely for conditions of plant nutritional and hydric stress, but no temperature stress. Triticum durum was chosen, as it is a temperate crop.
The root exudate of Triticum durum improved the survival rate of strain 18 at 25°C (), an observation that supports the idea of a close association between strain 18 and the wheat plant. One might ask if strain 18 assigns the plant with distinct advantages dependent on space and temperature (see below), and its motility, a trait described for other STB, could be part of the equation that rules such plasticity. Root exudates from young wheat plants would provide a niche for the maintenance of strain 18 at temperatures outside its growth range. Strain 18 would be able to migrate to the upper soil layers, where, at higher temperatures, it would proliferate thanks to organic matter degradation, producing sulfate and ammonium for plant growth (Santana et al. Citation2013). A proximity to stressed plant roots, at high temperatures, would trigger a distinct metabolism in this STB, which might profit from root exudates to proliferate (see ).
The interaction between the wheat plant and strain 18 might result in the change of the bacterial cell wall structure, as indicated by the ATR-IR spectra (). Infrared spectroscopy is based on vibrations of groupings such as –COOH, COO−, O–H, the energy of most of these molecular vibrations corresponds to that of the infrared region of the electromagnetic spectrum. Characteristic group frequencies can be attributed to specific bonds or groupings. The infrared spectrum of a protein is characterized by a set of absorption regions, namely amide I (1600–1700 cm−1), amide II (1480–1575 cm−1) and amide III (1230–1330 cm−1). The amide I band arises mainly from C = O stretching, the amide II and amide III absorption arise mainly from N–H bending and C–N stretching vibrations (Haris and Severcan Citation1999). Changes in the frequency and intensity of amide absorption implies structural and conformational differences in cell proteins (Haris and Severcan Citation1999). Herein, the change of the band maxima from 1646 to 1639 cm−1 in the amide I region vibrations of proteins indicated a shift from random coil (1645–1648 cm−1) to an increased proportion of β-structure components (1637 to 1623 cm−1) (Kamnev Citation2008) when the cells are cultured with the exudate, at 25°C. At 50°C, with no exudate, the amide I band had a prominent shoulder at 1637 cm−1; the addition of exudate caused a shoulder reduction and the peak maximum was at 1649 cm−1 reflecting a shift to α-helices components, which maximum is at about 1650–1660 cm−1(Kamnev Citation2008). Thus, the exudate promoted the formation of α-structure components over β- at 50°C, but not at 25°C. Ureibacillus spp., although belonging to the Firmicutes phylum do not appear positive by Gram coloration (e. g. Weon et al. Citation2007) and studies on their cell wall composition and surface proteins are lacking. Therefore, it is difficult to hypothesize if the exudate promoted the formation of α-helical enzymes on the cell surface of active metabolic bacteria at 50°C, and if, at 25°C, specific structural proteins with β-structure components could be formed for cell maintenance. On the other hand, it is known that bacterial cell surface proteins are involved in stress resistance and plant root colonization (Burdman et al. Citation2001), hence it can be proposed that the observed spectral changes reflect structural and/or compositional changes of strain 18 cell surface proteins that ease adaptation associated with the wheat root exudate. At 50°C, the changes caused by the exudate addition in peak maxima, at 1057 and 1078 cm−1, and at ca 1118 cm−1 could be related to changes in the content of polyesters. An increased absorption in the region 1150–1000 cm−1, characteristic of various C–O–C and C–C–O vibrations, was related to the accumulation of polyesters in Azospirillum brasilense under heavy metal and nutritional stress (Kamnev Citation2008). Change in band pattern was also observed in the range of 2800–3010 cm−1. This spectral range is assigned to the -CH3 (terminal methyl) and -CH2- (methylene) vibrations in the fatty acid components of the cell wall (Rubio et al. Citation2006). The ratio between the bands at 2960 cm−1 (CH3 asymmetrical stretching vibrations) and 2922 cm−1 (CH2 asymmetrical stretching vibrations) can be related either to the acyl chain length or to the lipidic content (Melin et al. Citation2004). Both at 25°C and 50°C, there was an enhancement of the band at 2922 cm−1 with the exudate addition, indicating a different CH2/CH3 ratio. Modifications in this spectral region were also detected for Bacillus cereus grown in different media (Dutta et al. Citation2013) and variation in membrane fatty acyl composition had been previously reported for B. cereus in response to reduced temperature and growth in rice starch (Haque and Russell Citation2004). Overall, the spectra data show that the bacteria altered cell surface composition as a result of the exudate addition and suggest the potential of molecular response mechanisms through cell surface components between strain 18 and the potential plant host.
Adding the bacterial strain through irrigation of similar young wheat plants, subjected to stress, had no apparent benefit, with no increment in plant growth parameters ( and ). Addition of R. irregularis, an AMF known to be beneficial to the host plant, gave similar results in terms of biomass partition between shoot and root, as well as in terms of N and C assimilation and C/N ratio ( and ). Mycorrhizal fungi show an apparent ‘parasitic’ behavior, with decreased plant yield, when the net cost of the symbiosis exceeds net benefits. AMF addition resulted indeed in a total biomass reduction of 8%. On the other hand, the increased N content in plant shoot, here observed for the plants treated with strain 18 and/or the AMF, is known to be related to higher allocation of N to Rubisco protein so that higher photosynthetic-N use efficiency may be obtained under stress conditions. In Triticum aestivum L, higher N nutrition granted drought tolerance by maintaining Rubisco content and higher antioxidative defense systems (higher superoxide dismutase and ascorbate peroxidase activities) (Abid et al. Citation2016). Additionally, the bacterial addition caused a significant lower δ13C value (), i.e. higher intercellular CO2 concentration and a lower 13C abundance of the fixed CO2 (Scheidegger et al. Citation2000; Dercon et al. Citation2006), translating an increased stomatal conductance, necessary for the maintenance of the photosynthetic capacity under the imposed stress.
The STB treatments, as the AMF, lead also to the increase of P shoot content ( and ); P content was an important feature for the establishment of distinct plant shoot ionomes (). This result might translate a higher potential for stress tolerance of STB or AMF treated plants, since it is long known that increased allocation of P to shoots result in better growth of above-ground plant parts (Baon et al. Citation1993) and consequent maintenance of productivity under stress. In spite of strain 18 ability to produce sulfate from organic-S (Santana et al. Citation2013), this production is maximal at 50°C, thus the absence of an effect of strain 18 on sulfur content of roots and shoots ( and ) is not surprising.
An additional benefit of the STB and of the joint treatment was the observed decreased content of several toxic elements, e.g. cadmium, lead, nickel, iron, in plant shoot or root ( and ). The effect is notorious when compared with the AMF treated plants, which showed, in most cases, a metal content greater than the one of control plants. Interestingly, the joint treatment caused the larger decrease, suggesting an interaction between the bacterial strain and the AMF. Synergistic effects between AMF and PGP have been reported, where dual inoculation resulted in increased plant tolerance to heavy metals. For instance, studies using a Ni-tolerant Brevibacillus brevis strain along with AMF reduced nickel toxicity in Trifolium repens, the specific amount of nickel absorbed per unit of root biomass was reduced in comparison with that of plants grown in soil inoculated only with AMF (Vivas et al. Citation2006). A beneficial effect of B. brevis on the extent of AM colonization together with the cumulative effect of metal homeostasis inherent mechanisms of bacteria and AMF (e.g. extra and intra-cellular quelation) were suggested to confer plant tolerance to Ni. It might be possible that a similar cooperation between AMF and strain 18 may be responsible for the observed decreased nickel content in the root, which was already lowered by AMF inoculation alone.
In agreement with the different elemental composition, the discriminant analysis showed that ionome distributions differed significantly between control and inoculation treatments (), suggesting that microbial inoculants induced characteristic shoot and root ionomes. For instance, plants from the bacterial and the joint treatments showed a trend to have lower shoot content of several metals compared with the control.
The work herein showed that STB can interact with a plant partner under rhizospheric conditions, pointing to a novel exploratory area in the domain of plant-soil bacteria interactions and to the prospect of modulating such interactions according to seasonal temperature changes. STB showed a behavior similar with a crop enhancer, R. irregularis, when triggering in the plant armed responses for stress tolerance. These findings warrant future assays to inspect further conditions that might reveal an ability of STB to increment plant growth, classing STB as PGP. In any case, and despite the positive results here reported, assays must be performed further in field conditions, since the survival and efficiency of PGP is frequently diminished therein due to various biotic and abiotic factors. An accrual advantage of STB is their activity as organic N, S and P-mineralizers at high temperatures, making them potential adjuvants in soil fertilization during heat periods. STB and their potential should thus be considered in functional terms and in plant-soil ecology.
Acknowledgments
This work was supported by the Fundação para a Ciência e a Tecnologia under Grant PTDC/AGR-PRO/1852/2014 and FCT R&D Unit funding UIDB/00329/2020.
Disclosure statement
No potential conflict of interest was reported by the author(s).
ORCID
Margarida M. Santana http://orcid.org/0000-0002-5712-3939
Luís Carvalho http://orcid.org/0000-0003-4918-6160
Juliana Melo http://orcid.org/0000-0003-1518-5055
Maria Eduarda Araújo http://orcid.org/0000-0002-9876-9015
Cristina Cruz http://orcid.org/0000-0003-3100-463X
Additional information
Funding
Notes on contributors
Margarida M. Santana
Margarida M. Santana received a PhD in Sciences from the University of Paris XI in 1995, and an equivalence doctoral degree in Microbiology from the University of Lisbon in 1996. She is currently working in the Plant-Soil Ecology research group of cE3c. Her research focuses on plant-bacteria associations, namely on the effect of soil thermophilic bacteria on plant nutrient availability.
Luís Carvalho
Luís Carvalho received a PhD in Ecology from the University of Lisbon in 2004 and he is currently working in the Plant-Soil Ecology group of cE3c and in the startup R&D company Soilvitae. His research focuses on the development of microbial solutions for a sustainable agriculture.
Juliana Melo
Juliana Melo received a PhD in Ecology of Ecosystems in 2014 from the University of Vila Velha, Brazil. She is currently a post-doctoral researcher of the Plant-Soil Ecology (PSE) research group of cE3c. Her research focuses on soil microbiology and plant-microorganism interactions, particularly those microorganisms that promote plant growth (PGPM).
Maria Eduarda Araújo
Maria Eduarda Araújo received a PhD in Organic Chemistry in 1991 from the University of Lisbon, Faculty of Sciences. She is currently a Professor of Chemistry of Natural and Nutraceutical Products at the University of Lisbon and a researcher at the Center of Chemistry and Biochemistry, University of Lisbon.
Cristina Cruz
Cristina Cruz received a PhD in Ecology and Plant Systematics from the University of Lisbon in 1994 and she is currently leading the Plant-Soil Ecology (PSE) research group of cE3c. She is a Lecturer of Plant Biology at the University of Lisbon. Her research focuses on the physiological ecology of nitrogen (N) acquisition and impacts of increased N availability in terrestrial plants.
References
- Abid M, Tian Z, Ata-Ul-Karim ST, Cui Y, Liu Y, Zahoor R, Jiang D, Dai T. 2016. Nitrogen nutrition improves the potential of wheat (Triticum aestivum L.) to alleviate the effects of drought stress during vegetative growth periods. Front Plant Sci. 7:981. doi: 10.3389/fpls.2016.00981
- Baon JB, Smith SE, Alston AM. 1993. Phosphorus allocation in P-efficient and inefficient barley cultivars as affected by mycorrhizal infection. Plant Soil. 155:277–280. doi:10.1007/BF00025036.
- Bartholomew JW, Paik G. 1966. Isolation and identification of obligate thermophilic sporeforming bacilli from ocean basin cores. J Bacteriol. 92(3):635–638. doi: 10.1128/JB.92.3.635-638.1966
- Burdman S, Dulguerova G, Okon Y, Jurkevitch E. 2001. Purification of the major outer membrane protein of Azospirillum brasilense, its affinity to plant roots, and its involvement in cell aggregation. Mol Plant Microbe Interact. 14(4):555–561. doi: 10.1094/MPMI.2001.14.4.555
- Das AJ, Kumar M, Kumar R. 2013. Plant Growth Promoting Rhizobacteria (PGPR): an alternative of chemical fertilizer for sustainable, environment friendly agriculture. Res J Agric For Sci. 1(4):21–23.
- Dercon G, Clymans E, Diels J, Merckx R, Deckers J. 2006. Differential 13C isotopic discrimination in maize at varying water stress and at low to high nitrogen availability. Plant Soil. 282(1-2):313–326. doi:10.1007/s11104-006-0001-8.
- Dutta S, Rani TS, Podile AR. 2013. Root exudate-induced alterations in Bacillus cereus cell wall contribute to root colonization and plant growth promotion. PLoS One. 8(10):e78369. doi:10.1371/journal.pone.0078369.
- Eriksen J. 1996. Incorporation of S into soil organic matter in the field as determined by the natural abundance of stable S isotopes. Biol Fertil Soils. 22:149–155. doi:10.1007/BF00384447.
- Gonzalez JM, Portillo MC, Piñeiro-Vidal M. 2015. Latitude-dependent underestimation of microbial extracellular enzyme activity in soils. Int J Environ Sci Technol. 12(7):2427–2434. doi: 10.1007/s13762-014-0635-7
- Gonzalez Grau JM, Delgado Romero JA, Gómez Fernández EJ, Santana MM, Cruz CM. 2016. P201630900. Thermophilic microorganisms for phosphate solubilization at high temperatures. “Oficina Espanõla de Patentes y marcas” (OEPM).
- Haque MA, Russell NJ. 2004. Strains of Bacillus cereus vary in the phenotypic adaptation of their membrane lipid composition in response to low water activity, reduced temperature and growth in rice starch. Microbiology. 150(5):1397–1404. doi: 10.1099/mic.0.26767-0
- Haris PI, Severcan F. 1999. FTIR spectroscopic characterization of protein structure in aqueous and non-aqueous media. J Mol Catal B Enzym. 7(1-4):207–221. doi:10.1016/S1381-1177(99)00030-2.
- Kamnev AA. 2008. FTIR spectroscopic studies of bacterial cellular responses to environmental factors, plant-bacterial interactions and signaling. Spectroscopy. 22:83–95. doi: 10.1155/2008/862085
- Lugtenberg B, Kamilova F. 2009. Plant-growth-promoting rhizobacteria. Annu Rev Microbiol. 63(1):541–556. doi:10.1146/annurev.micro.62.081307.162918.
- Marchant R, Banat IM, Rahman TJ, Berzano M. 2002b. The frequency and characteristics of highly thermophilic bacteria in cool soil environments. Environ Microbiol. 4(10):595–602. doi: 10.1046/j.1462-2920.2002.00344.x
- Marchant R, Banat IM, Rahman TJS, Berzano M. 2002a. What are high temperature bacteria doing in cold environments? Trends Microbiol. 10(3):120–121. doi:10.1016/S0966-842X(02)02311-9.
- Marchant R, Franzetti A, Pavlostathis SG, Tas DO, Erdbrűgger I, Űnyayar A, Mazmanci MA, Banat IM. 2008. Thermophilic bacteria in cool temperate soils: are they metabolically active or continually added by global atmospheric transport? Appl Microbiol Biotechnol. 78(5):841–852. doi: 10.1007/s00253-008-1372-y
- Melin AM, Allery A, Perromat A, Bebear C, Delleris G, De Barbeyrac B. 2004. Fourier transform infrared spectroscopy as a new tool for characterization of mollicutes. J Microbiol Methods. 56(1):73–82. doi: 10.1016/j.mimet.2003.09.020
- Moxley E, Puerta-Fernandez E, Gomez EJ, Gonzalez JM. 2019. Influence of abiotic factors, temperature and water content on bacterial 2-chlorophenol biodegradation in soils. Front Environ Sci. 7:41. doi: 10.3389/fenvs.2019.00041
- Phillips JM, Hayman DS. 1970. Improved procedures for clearing roots and staining parasitic and vesicular arbuscular mycorrhizal fungi for rapid assessment of infection. Trans British Mycol Soc. 55(1):158–161. doi: 10.1016/S0007-1536(70)80110-3
- Portillo MC, Santana M, Gonzalez JM. 2012. Presence and potential role of thermophilic bacteria in temperate terrestrial environments. Naturwissenschaften. 99(1):43–53. doi:10.1007/s00114-011-0867-z.
- Rubio C, Ott C, Amiel C, Dupont-Moral I, Travert J, Mariey L. 2006. Sulfato/thiosulfato reducing bacteria characterization by FT-IR spectroscopy: a new approach to biocorrosion control. J Microbiol Methods. 64(3):287–296. doi: 10.1016/j.mimet.2005.05.013
- Santana MM, Gonzalez JM, Clara MI. 2016. Inferring pathways leading to organic-S mineralization in the Bacillales. Crit Rev Microbiol. 42(1):31–45. doi: 10.3109/1040841X.2013.877869
- Santana MM, Portillo MC, Gonzalez JM, Clara MIE. 2013. Characterization of new soil thermophilic bacteria potentially involved in soil fertilization. J Plant Nutr Soil Sci. 176(1):47–56. doi: 10.1002/jpln.201100382
- Savka MA, Dessaux Y, McSpadden Gardener BB, Mondy S, Kohler PRA, de Bruijn FJ, Rossbach S. 2013. The “biased rhizosphere” concept and advances in the omics era to study bacterial competitiveness and persistence in the phytosphere. In: de Bruijn FJ, editor. Molecular microbial ecology of the rhizosphere. Vol. 1& 2. Hoboken: John Wiley & Sons; p. 1145–1161. doi:10.1002/9781118297674.ch110.
- Scheidegger Y, Saurer M, Bahn M, Siegwolf R. 2000. Linking stable oxygen and carbon isotopes with stomatal conductance and photosynthetic capacity: a conceptual model. Oecologia. 125(3):350–357. doi: 10.1007/s004420000466.
- Sokal RR, Rohlf JF. 1981. Biometry. NewYork: Freeman WH & Co.
- Tak HI, Ahmad F, Babalola OO. 2013. Advances in the application of plant growth-promoting rhizobacteria in phytoremediation of heavy metals. Rev Environ Contam Toxicol. 223:33–52. doi:10.1007/978-1-4614-5577-6_2.
- Vivas A, Biró B, Németh T, Barea JM, Azcón R. 2006. Nickel-tolerant Brevibacillus brevis and arbuscular mycorrhizal fungus can reduce metal acquisition and nickel toxicity effects in plant growing in nickel supplemented soil. Soil Biol Biochem. 38(9):2694–2704. doi:10.1016/j.soilbio.2006.04.020.
- Weon H-Y, Lee S-Y, Kim B-Y, Noh H-J, Schumann P, Kim J-S, Kwon S-W. 2007. Ureibacillus composti sp. nov. and Ureibacillus thermophilus sp. nov., isolated from livestock-manure composts. Int J Syst Evol Microbiol. 57(12):2908–2911. doi:10.1099/ijs.0.65232-0.
- Zhang R, Vivanco JM, Shen Q. 2017. The unseen rhizosphere root–soil–microbe interactions for crop production. Curr Opin Microbiol. 37:8–14. doi: 10.1016/j.mib.2017.03.008