
 ?Mathematical formulae have been encoded as MathML and are displayed in this HTML version using MathJax in order to improve their display. Uncheck the box to turn MathJax off. This feature requires Javascript. Click on a formula to zoom.
ABSTRACT
Opening and greening are main characteristics of morphogenesis of cotyledons. For revealing interrelationship between metabolism and morphogenesis, metabolic shifts were analyzed in cotyledon of A. membranaceus seedlings with different stages in light and in darkness. Light induced 69 metabolites (MA), related to cotyledon greening; additional 89 metabolites (MB), related to cotyledon opening, were identified by WGCNA. The screening of metabolites shared in both MA and MB obtained 37 specific metabolites (MC) related to both opening and greening. In this context, main changes in MC occurred during A3, the stage in which cotyledons fully opened and greened. Within MC, few sugars, including L-(-)-sorbose, mannose, glucose and its derivatives, markedly decreased, while other sugars, amino acids, and unsaturated fatty acids increased. Most isoflavones and flavonols including ononin, caycosin-7-glucosides, quercetin, genistein, and catechin increased 5.3, 5.5, 13.4, 6.4 and 1.8 times, respectively. Thus, accumulated flavonoids play an important role during this developmental stage.
1 Introduction
After germination, seedlings of higher plants undergo two morphogenesis processes, skotomorphogenesis and photomorphogenesis, depending on the presence or absence of light (Pfeiffer et al. Citation2016). In the absence of light, young seedlings develop an apical hook topped by tightly-closed undeveloped cotyledons, as well as slim and elongated hypocotyl, and undeveloped root. In the light, however, the seedlings open and expand the rapidly greening cotyledons, and the hypocotyl gets sturdy and elongated root occurs (Sullivan and Deng Citation2003). This successful greening, i.e. the photomorphogenesis, is vital for the life cycle of the plant, because this denotes the essential transition from the heterotrophic to the autotrophic phase of seedling development (Gommers and Monte Citation2018).
In skotomorphogenesis, seeds primarily deploy their reserve to provide energy and structural components for the rapid elongation of the hypocotyl, to ensure that seedling gets access to light before storage material is exhausted (Arsovski et al. Citation2012). However, once seedling had reached the light, this stimulates the enlargement of the cotyledon and rapid cell division, proliferation and enlargement promote their opening. For cotyledons, it is more essential to increase their leaf area faster than growing in length (Stoynova-Bakalova et al. Citation2004). At the same time, the light also triggered the greening of the cotyledon by the conversion of yet undifferentiated proplastids into photosynthetically active chloroplasts. The cotyledon opening and greening is a very complex process involving several morphological and metabolic changes (Gommers and Monte Citation2018). the rise of ‘omics’ techniques provided a wider understanding of the different metabolic steps of seedling establishment in various plants (Ribeiro et al. Citation2015; He et al. Citation2016; Silva et al. Citation2017; Alves da Silva et al. Citation2019).
Generally, the metabolic responses of plants are quite diverse. In Arabidopsis seedlings, carbohydrates and TCA cycle intermediates accumulate during seedling establishment relative to the seed germination (Silva et al. Citation2017). In rapeseed seedlings, however, the light induced the increase in the contents of reducing sugars. Interestingly, the comparison of effects of short light and dark phases revealed that the changes of some metabolites and related protein were programmed in seed (He et al. Citation2016). In addition, the activities of cell wall and amino acid metabolisms, and transport-related pathways were significantly enhanced during cotyledon expansion (Qu et al. Citation2019). Beyond that, contents of secondary metabolites such as flavonoids and phenolic acids increased early during seedling establishment in A. thaliana (Bowler et al. Citation2013), silver birch (Luis et al. Citation2011), white birch (Laitinen et al. Citation2002) and tomato (Tamagnone et al. Citation1998). It is well established that tissue contents of secondary metabolites may vary pronouncedly and species-specifically in seedlings (Chacón et al. Citation2013; Roldan et al. Citation2014). Thus, the interrelationship between morphogenesis and general plant metabolism still needs to be further evaluated in detail in additional species (Bellaire et al. Citation2014).
Astragalus membranaceus (Fisch.) Bunge, a major traditional Chinese herb, accumulates high concentrations of various secondary metabolites such as phenolic acids, flavonoids and phenylpropanoids (Xu et al. Citation2011; Jun et al. Citation2012). In a previous study, 25 active compounds have been identified in different tissues of A. membranaceus (Li et al. Citation2019), including the mobilization seed reserve during germination (Yang et al. Citation2018). However, detailed reports on the seedling establishment are scarce for plants of this species. Thus, in the presented study, the regulation cotyledon morphogenesis and the potential correlation between morphogenesis and metabolism were comprehensively analyzed in seedlings of A. membranaceus, particularly considering the diversity of phenols. To realize this, metabolomics was applied to compare and statistically analyze the changes in 111 primary metabolites, 28 phenols and 18 fatty acids contents of cotyledons at different stages of their opening (A1, A2, A3, A4) under light and dark. PLS-DA and non-parametric Mann–Whitney U-test revealed that 69 differential metabolites (MA) related to cotyledon greening were induced by light. Additional 89 metabolites (MB) related to cotyledon opening under light were identified by WGCNA analysis. Then, metabolites shared in MA and MB were further screened, obtaining 37 specific metabolites (MC) related to both opening and greening.
2 Materials and methods
2.1 Seed material and seedling growth
Seeds of Astragalus membranaceus (Fisch.) Bunge (syn. Astragalus propinquus Schischkin) were purchased from a supplier (Anguo Traditional Chinese Medicine Promotion Station, Hebei, China). Seeds of uniform size were selected and surface sterilized with 10% sodium hypochlorite solution for 15 min and then sterilized with 75% alcohol solution for 10 s, and finally thoroughly washed with distilled water six times. After imbibition in sterile distilled water for 24 h at room temperature, the seeds were sown on sterilized vermiculite in plots of 150 seeds.
The samples were divided into two groups; one group of seeds was germinated under white light (12 h light /12 h dark cycle) at 25 °C / 22 °C and the other in complete darkness at 22 °C as controls. Light-germinated cotyledons were collected between days 3 and 6 after germination, representing cotyledons with four different opening and greening stages, i.e. unearthed and closed cotyledons (A1), slightly extended (A2), fully opened (A3), and cotyledons with true leaves (A4). At the same time as the light-germinated samples, tightly closed etiolated cotyledons of the strictly darkened controls were collected. Some of cotyledons were sampled, weighed (fresh mass, FM), dried in an oven at 70 °C, and weighed again (dry mass, DM). The remaining samples are frozen in liquid nitrogen for subsequent analysis.
2.2 Determination of morphological parameters
The clean seedlings were placed on a white paper; the contours of the cotyledons depicted and finally cotyledons’ angle measured with a protractor. The cotyledon area was measured with ImageJ on a scaled (i.e. known scale added) digital (digital camera) RGB image. The absolute rates of leaf expansion (ARLE) (cm2 per seedling per unit time) of cotyledons was calculated as:
2.3 Metabolite profiling
2.3.1 Extraction and determination of primary metabolites
Extraction and determination of primary metabolites followed Liu et al. (Liu et al. Citation2017a) with minor modifications. Cotyledons samples (90 mg) previously stored in liquid nitrogen were homogenized in a tissueLyser II (QIAGEN GmbH, Hilden, Germany) with 540 μL cold methanol and 60 μL internal standard (L-2-chloro-phenylalanine, 0.3 g L−1, dissolved in methanol). After ultrasonication for 30 min, 300 μL chloroform and 600 μL purified water were added to the sample. After additional vortexing (2 min) and sonication (30 min), the sample was centrifuged at 10,000 g for 10 min at 4°C. An aliquot of the supernatant (700 μL) was transferred into a glass sampling vial for vacuum-drying. Then, 400 μL methoxyamine (15 g L−1 in pyridine) was added to the vial, vortexed 2 min at 37°C for 90 min. After that, 400 μL BSTFA (1% TMCS) and 80 μL n-hexane were also added to the vial for derivatization at 70°C for 60 min.
Afterwards, the solution was injected into a GC-MS (Agilent 7890A-5975C, Agilent Technologies, Inc., Santa Clara, USA). Separation was carried out on a non-polar DB-5 capillary column (30 m×250 μm I.D., J&W Scientific, Folsom, USA), with high purity helium as the carrier gas at a constant flow rate of 1.0 mL min−1. The initial GC temperature was set to 50°C, followed by a temperature ramp to 125°C at 8 K min−1, to 170°C a 15 K min−1, to 210°C at 4 K min−1, to 270°C at 10 K min−1 and then to 305 °C at 5 K min−1, which was kept constant for 5 min. The Electron impact (EI) ion source was maintained at 70 eV; scanning ranged from 50 to 500 m/z with an acquisition rate of 20 spectra s−1.
2.3.2 Extraction and determination of phenols
Previously liquid nitrogen-stored cotyledons (1 g) were homogenized in 10 mL methanol (70%). After ultrasonication for 30 min, the homogenized sample was centrifuged at 5000 g for 10 min, the supernatant collected and the residues extracted again. Finally, the merged supernatant was dried under vacuum, re-dissolved with 1 mL methanol (70%), and centrifuged at 10, 000 g for 10 min. The sample was filtered with 0.22 μm nylon membrane for analysis.
The qualitative analysis of the metabolites was based on the phenolic metabolic pool obtained by LC/Q-TOF-MS (Waters Xevo G2, USA), which included 31 general phenolic metabolites, i.e. p-hydroxybenzoic acid, brassinolide, abscisate, 2,5-dihydroxybenzoic acid, syringic acid, salicylic acid, gallic acid, vanillic acid, genistein, daidzein, petunidin, naringenin, hesperidin, quercetin-3-O-rhamnoside, myricitrin, luteolin, catechin, myricetin, quercetin, kaempferol, liquiritigenin, rutin, isoliquiritigenin, chlorogenic acid, ferulic acid, cinnamic acid, L-phenylalanine, calycosin-7-glucoside, calycosin, formononetin, and ononin (Chen et al. Citation2018). The chromatographic conditions were A %: 0.05% formic acid water, B %: 0.05% formic acid acetonitrile, m/z 120-1200, positive ion scanning mode; leucine enkephalin was labeled as an internal standard, using a reversed ACQUITY UPLC BEHC18 Column (1.7 µm, 2.1 mm × 50 mm). Subsequently, the gradient employed the flow rate of 0.25 mL min−1 for 0–23 min at 95% A– 5% A, 5% B–95% B; 23–25 min at 5% A–95% A, 95% B–5% B and 25–31 min at 95% A– 95% A, 5% B–5% B, respectively. Obtained data were analyzed and normalized by the mass spectrometry software MassLynxTM (Waters Corporation, Milford, USA).
2.3.3 The extraction and determination of fatty acids
2.3.3.1. Lipid extraction
The fatty acids were extracted and determined according (Yang et al. Citation2018). Total lipids were extracted using a cold mixture of chloroform: methanol: 0.1 M KCl (2:1:1, v/v/v) (Zhou et al. Citation2013).
2.3.3.2. Isolation of chloroplast and mitochondrial
Differential centrifugation was used to separate chloroplast and mitochondrial as described by Mackender and Leech (Citation1974) with a little modification. The cotyledons (100 pairs) were homogenized in an ice-cold mortar with an appropriate amount of ice-cold 53 mmol L−1 Na2HPO4/KH2PO4 buffer (pH 7.3) containing 500 mmol L−1 sorbitol, 10 mmol L−1 MgCl2 and 10 mmol L-1 EDTA-Na2. The homogenate was then filtered through 4 layers of non-woven fabrics, the residue was discarded and the filtrate was used for organelle separation.
Isolation of chloroplasts: under low light, the filtrate was centrifuged at 3000 g for 15 s at 4°C. The resulting supernatant was used for other organelle separation. The sediment was layered on 5 mL of 53 mmol L−1 Na2HPO4/KH2PO4 buffer (pH 7.3) containing 400 mmol L−1 sucrose and centrifuged at 500 g for 12 s again. The second sediment contained the chloroplasts.
Isolation of mitochondria: The supernatant obtained by isolation of chloroplast was centrifuged at 3000 g for 5 min, and then the resulting supernatant was centrifuged at 20,000 g for 30 min at 4°C. The sediment was re-suspended in 53 mmol L−1 Na2HPO4/KH2PO4 buffer (pH 7.3) without sorbitol and centrifuged at 3000 g for 5 min. The resulting supernatant was centrifuged at 20,000 g for 30 min. The final sediment contained the mitochondria.
2.3.3.3. Lipid analysis
To determine the fatty acid compositions, 0.1 g lipid sample was methyl esterified (Doss and Oette Citation1965). The fatty acid methyl esters were analyzed by GC-MS (QP2010 Plus, Shimadzu, Tokyo, Japan) equipped with a CP-Sil 88 column (100 m length × 0.25 mm diameter and 0.20 µm thickness, Agilent, USA). The initial column temperature was set at 140°C and a holding time of 5 min, followed by a ramp to 240°C at 4 K min−1, and then it was kept constant for 15 min. The ionization energy and ion source was maintained at 70 eV and 200 °C, respectively. The scanning range was from 50 to 500 m/z. Identification of each peak in the sample chromatogram was achieved by comparing their peak retention time to that of a mixed standard of 37 fatty acid methyl ester (Nestle 37, Nu-Chek Prep, Elysian, USA). According to peak area normalization, the percentage of fatty acids in the total fatty acid was determined.
2.4 Statistical analysis
In the present study, three replicates were arranged in a randomized block design manner for each group. All the data were presented as mean ± standard error (SE) and comparison of means were performed using SPSS (SPSS 24.0, IBM, Armonk, USA). The one-way ANOVA with the Duncan’s post hoc test was performed to test the significance (p < 0.05) of differences between means. Raw data obtained by GC-MS were transformed into CDF format with data analysis in ChromaTOF software (v 4.34, LECO, St. Joseph, MI, USA). Each compound was displayed as peak area normalized to the internal standard. For further analysis, the results were exported to Microsoft Excel. After metabolites data were normalized by mean centering and unit variance scaling, PLS-DA analysis were performed by the SIMCA-P+11.5 software package (Umetrics, Umeå, Sweden). Metabolic pathway analyses were performed in MBRole (http://csbg.cnb.csic.es/mbrole2/) and KEGG (https://www.kegg.jp/). The non-parametric Mann–Whitney U-test was also calculated by SPSS24.0. The heap map, bubble chart and WGCNA analysis was made with R (version 3.6.1) using the ‘pheatmap,’ ‘ggplot2’ and ‘WGCNA’ packages (https://www.r-project.org/; (Pei et al. Citation2017)).
3 Results
3.1 The morphological characteristics of cotyledon developed under light or in darkness
When germinated in darkness, the seedling showed typical form of skotomorphogenesis, including the unopened top hook and tightly closed etiolated cotyledons (). Leaf area and fresh mass of cotyledons remained almost unchanged during the entire experiment (), while fresh mass-based water content gradually increased to final 84.79% at A4. Dry mass decreased significantly at stage A2 and then slowly till the end of the study. In contrast, the hooks of light-grown cotyledons unfolded at A2 and cotyledons were fully open and green at stage A3. Meanwhile, the cotyledon angle reached approx. 100°, mean leaf area and fresh mass of cotyledons was up to 4.3 mm2 and 26.5 mg, respectively and had the highest ARLE (186). Water content also reached its maximum (89.5%). On the other hand, dry mass of cotyledons significantly declined at this stage, remaining constant afterwards. Environmental factors and growth processes significantly and interactively influenced the growth parameters.
Figure 1. Morphological characteristics of A. membranaceus cotyledons grown in light or in darkness.
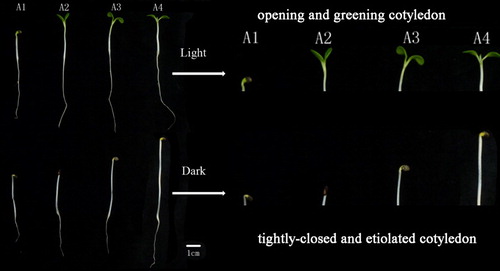
Table 1. Morphological parameters of A. membranaceus cotyledon under light and dark.
3.2 The difference of the metabolite composition between light and dark-grown cotyledons
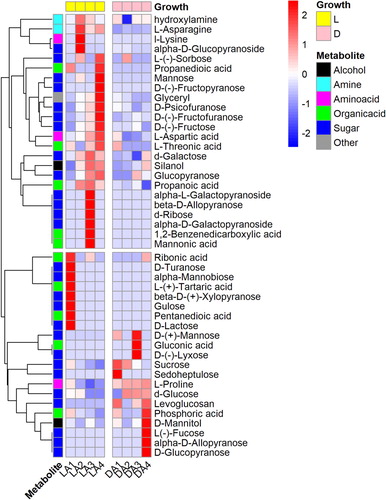
To reveal the primary metabolites profile and specificity in cotyledon either grown in light or in darkness, a supervised multi-dimensional PLS-DA was conducted. R2Y and Q2Y of PLS-DA were 0.991 and 0.987, respectively, which means that the model is good and effectively explains the observations and predict the response variables. In the PLS-DA score plot, the principal component 1 (t [1]) reflects the difference between metabolite profiles of light or dark-grown cotyledons, while t [2] indicates the metabolic response to the growth stages at both growing conditions, especially in light-grown cotyledons from A2 to A3 ((a)). It suggests that a big metabolic shift occurred at A3. The corresponding PLS-DA trajectory score plot reveals distinct metabolic fluctuations that were associated with both cotyledon development and growth conditions along t [1] and t [2], respectively ((b)). From the PLS-DA loading plot, it is obvious that the separation between the metabolomics composition of light- and dark-grown cotyledons was mainly due to sugars, amino acids, and organic acids ((c)). According to their VIP values (VIP>1), the differential primary metabolites in cotyledons were further indicated in a heatmap (, Table S1). The differential primary metabolites are mainly clustered into two groups. The ‘light-accumulated’ group mainly includes L-asparagine, alpha-D-glucopyranoside, l-lysine, L-(-)-sorbose, propanedioic acid, D-(-)-fructopyranose, mannose, D-psicofuranose, L-aspartic acid, glycerol, D-(-)-fructofuranose, D-(-)-fructose, d-galactose, L-threonic acid, silanol, and propanoic acid, while ‘dark-accumulated’ group preferentially includes L-proline, D-mannitol, D-(+)-mannose, D-(-)-lyxose, gluconic acid, L(-)-fucose, D-glucopyranose, phosphoric acid, d-glucose, sucrose and alpha-D-allopyranose. There are also some other metabolites (alpha-D-galactopyranoside, alpha-L-galactopyranoside, beta-D-(+)-xylopyranose) that accumulated specifically under light.
Figure 2. Metabolic responses of light or dark-grown cotyledons. (a) PLS-DA score plot of results of light- (L, blue) and dark- (D, red) grown cotyledons along the first and second principal components. (b) Time-dependent metabolic trajectory of the PLS-DA score plot of results obtained for the four growth stages. Error bars represent the standard error of measurement (SEM) at each time point. (c) Corresponding PLS-DA loading plot.
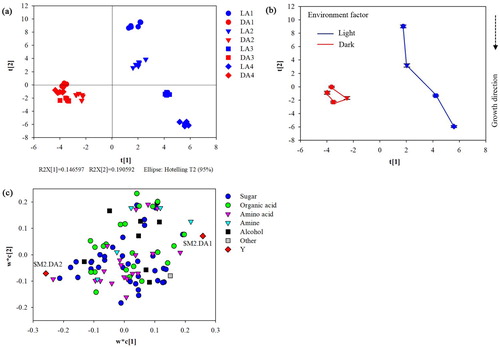
Figure 3. Heatmap of the differential metabolites profile in light (L) and dark-grown (D) cotyledons of A. membranaceus.
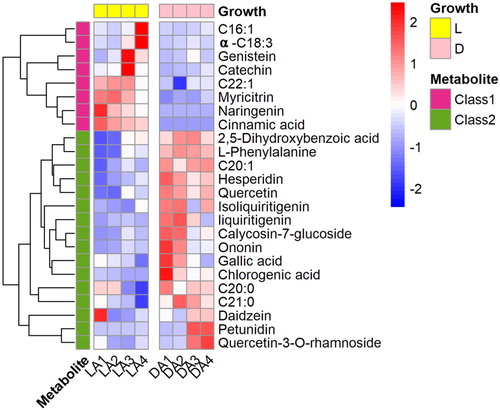
To evaluate the differentiation of phenols and fatty acids profiles between light and dark-grown cotyledons, 28 phenolic compounds and 18 fatty acids were statistically analyzed with a non-parametric Mann–Whitney U-test and the respective results clustered in a heat map (, Table S1). The 24 compounds differing between light and dark were mainly found in two groups; one includes three fatty acids (C16:1, C18:3, C22:1) and five phenolic compounds (genistein, Catechin, myricitrin, naringenin, cinnamic acid) primarily accumulated under light, while another three fatty acids (C20:1, C20:0, C21:0) and 13 phenolic compounds (2,5-dihydroxybenzoic acid, L-phenylalanine, hesperidin, quercetin, liquiritigenin, isoliquiritigenin, caycosin-7-glucosides, ononin, gallic acid, chlorogenic acid, daidzein, luteoloside, quercetin-3-O-rhamnoside) were primarily found in dark-grown cotyledons.
Figure 4. Heatmap of differential profiles of phenolic compounds and fatty acids in in light (L) and dark-grown (D) cotyledons of A. membranaceus.
3.3 Difference of metabolites in cotyledons at different opening stages under light
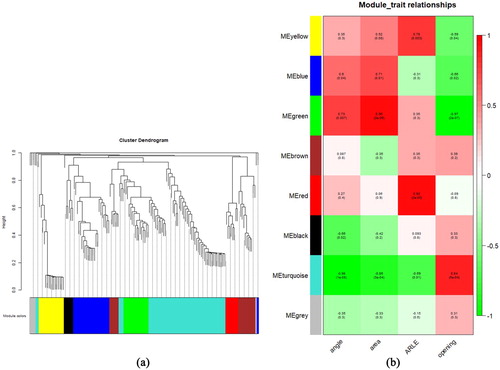
Through all light-induced metabolites (MA) were related to cotyledon greening. Besides greening, opening is another important process during cotyledon morphogenesis. The co-expression network analysis by Weighted Gene Co-Expression Network Analysis (WGCNA) was applied to differentially characterize those metabolites by directly comparing cotyledon at different stages of opening. Considering both the scale-free topology fit index and the mean connectivity, a soft-thresholding value of 12 was employed to construct metabolite co-expression modules (Figure S1). A total of 144 metabolites were parsed into 8 metabolites modules represented by color classifiers ((a)) and the module-trait correlation analysis was carried out further ((b)). The green module was positively correlated, while the turquoise module was negatively correlated with both the angle and the area of cotyledons. Red and yellow modules were positively correlated with ARLE. The correlation coefficients between the turquoise module and the artificially defined opening stages A1 to A4 are quite high (up to 0.84). A significant negative correlation between the green module and the trait of opening cotyledon was also observed. The green, turquoise, red and yellow modules, which were related to angle, area, ARLE and opening, were selected for further analysis to obtain relevant metabolites (MB) (Figure S2).
Figure 5. Network visualization plots. (a) Clustering dendrograms of metabolites, with dissimilarity based on topological overlap, together with assigned module colors. There is one metabolite dendrogram per block. (b) The associations of Module–trait. Each row corresponds to a module eigenmetabolite and each column to a trait. Each cell contains the corresponding correlation and p-value. The table is color coded by correlation according to the color legend.
3.4 The variation of specific metabolites related to cotyledons opening and greening
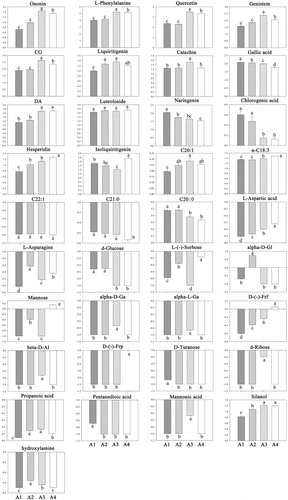
The Venn diagram analysis indicated 37 specific metabolites (MC) from and, which were related to both greening (MA) and opening (MB) of cotyledons (Figure S3). All specific metabolites were assigned to biological pathways listed in the KEGG database. Selected by p < 0.05, 12 significantly enriched pathways involved in cotyledon morphogenesis were identified (). The MC group mainly includes 14 phenolic metabolites, 5 fatty acids and 18 primary metabolites (). The phenolic compounds and their precursor were particularly relevant in the phenylpropanoid and flavonoid biosynthesis. Compared with A1, contents of ononin, caycosin-7-glucosides, L-phenylalanine, quercetin, genistein, and catechin markedly increased at A3, but declined again thereafter. Hesperidin contents were enhanced at A3 and continued to increase, Similarly, contents of liquiritigenin rose from A1 to A3 and remained constant. In contrast, isoliquiritigenin, gallic acid, naringenin, chlorogenic acid contents significantly decreased from A1 to A3. Fatty acid metabolites were mainly involved in the biosynthesis of unsaturated fatty acids. Contents of α-C18:3 but also C20:1 were enhanced at A3, while the latter remained constant, the former continued to increase. In contrast, levels of C20:0 decreased significantly on A3, as compared to A1. In addition, contents of C20:1 decreased significantly only at A4. Amino acids and amine were attributed to the alanine, aspartate and glutamate metabolisms and aminoacyl-tRNA biosynthesis. An initial increase in L-asparagine and hydroxylamine contents was observed at A2, followed by a decline to its initial level. Only L-aspartic acid continuously increased throughout the whole period. Sugars were mostly annotated to the galactose, fructose and mannose metabolisms. Compared with A1, contents of alpha-D-galactopyranoside, alpha-L-galactopyranoside, D-(-)-fructofuranose, d-ribose and beta-D-allopyranose were markedly enhanced at A3, while contents of d-glucose, L-(-)-sorbose, mannose, alpha-D-glucopyranoside decreased significantly from A1 to A3. Contents of mannonic acid and propanoic acid increased on from A1 to A3, while that of pentanedioic acid was lower at A2 and remained constant thereafter.
Figure 6. The enriched KEGG pathways of specific metabolites (MC). The greater the bubble size, the more of specific metabolites were involved. The color of the bubble varied from green to red. The deeper the red of a bubble, i.e. the smaller its p-value, the greater the significance of the enrichment pathway.
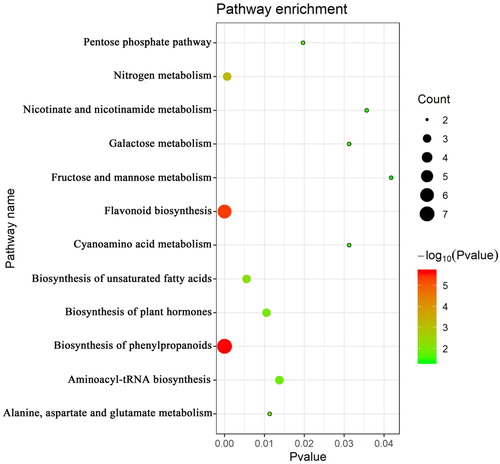
Figure 7. The variation of specific metabolites (MC) related to a morphological marker in cotyledons of A. membranaceus in the light. CG, alpha-D-Gl, alpha-D-Ga, alpha-L-Ga, D-(-)-Frp, D-(-)-Frf, beta-D-Al and DA represented calycosin-7-glucoside, alpha-D-glucopyranoside, alpha-D-galactopyranoside, alpha-L-galactopyranoside, D-(-)-fructopyranose, D-(-)-fructofuranose, beta-D-allopyranose and 2,5-dihydroxybenzoic acid respectively.
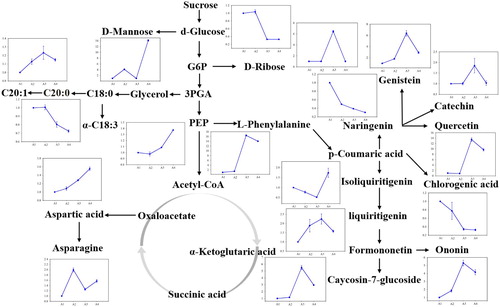
Based on the above analysis, a simplified map of metabolic pathways involved in cotyledon morphogenesis was constructed (). During cotyledon morphogenesis, the whole metabolic pathways changed significantly from A1 to A3. In sugar metabolism, the contents of some sugars increased, while some others decreased, e.g. d-glucose was reduced 0.3 times if compared to A1. In amino acids metabolism, contents of L-aspartic acid and L-phenylalanine increased 1.3 and 16.4 times, respectively. Contents of the fatty acids α-C18:3 and C20:1 increased 1.1 and 1.2-fold, respectively. Importantly, contents of most flavonoids and flavonols enhanced at A3; e.g. ononin, caycosin-7-glucosides, quercetin, genistein, and catechin increased 5.3, 5.5, 13.4, 6.4 and 1.8 times, respectively, while those of Isoliquiritigenin, naringenin and chlorogenic acid, which all contribute to the biosynthesis of flavonoids and flavonols declined at A3.
Figure 8. Mapping of specific metabolites (MC) involved in metabolic pathways during morphogenesis of A. membranaceus cotyledon. The line chart indicates changes of metabolites from A1 to A4 under light.
4 Discussion
The photo- and skotomorphogenesis responses of A. membranaceus seedlings presented in this study closely reflect the typical morphological changes exhibited by rapeseed (He et al. Citation2016). In the dark, seedlings were characterized by unopened top hooks, and tightly closed, etiolated cotyledons (). In the light, however, the top hooks opened and the cotyledons fully expanded and greened (A3). The close interrelationship between morphogenesis and the respective metabolism of cotyledons was studied in detail in this investigation.
4.1 The varied sugar, and increased amino acid and fatty acid contents promote opening and greening of cotyledons
Before the cotyledons open and develop their photosynthetic capacity, the seedlings must rely on the resources stored in the seeds. Sugars as the main carbon source, have important regulatory functions in adjusting metabolism, growth and development of plants (Smeekens et al. Citation2010). The presented results indicated that galactose, and fructose and mannose metabolisms pronouncedly changed during cotyledon morphogenesis. The contents of glucose derivatives (glucose and alpha-D-glucopyranoside), L-(-)-sorbose and mannose markedly decreased during cotyledon opening, while those of galactose (alpha-D-galactopyranoside and alpha-L-galactopyranoside), and D-(-)-fructofuranose, d-ribose and beta-D-allopyranose increased. The changes in the strength of the respective of carbon sources reflect their specific function in providing the biological energy and the components necessary to promote growth, opening and greening of the cotyledons.
The light-induced cotyledon opening is generally characterized by cell division and expansion, the decrease in cell number, and by cell enlargement (Yang and Benning Citation2018). The phases of cell division and cell expansion were well-studied in Arabidopsis cotyledons (Stoynova-Bakalova et al. Citation2004). An indispensable part of both is the formation and the development of the primary cell walls with their characteristic layers of the (hetero-) polysaccharides pectin, hemicellulose and of cellulose (Carpita and Gibeaut Citation1993; Yong et al. Citation2005). Thus, it is highly probable that the reduction of glucose derivatives and mannose concentrations may have been due to their involvement in cell wall production during rapid cell division and enlargement; while concentrations of the respective galactose derivatives could have been increased by conversion into other galactose substances for the synthesis of pectins. Especially, glucose is not only used in basic metabolism, but is also an important signal molecule that plays a role in plant growth including hypocotyl elongation, cotyledon greening and expansion, primary and lateral root growth, and true leaf development (Zhou et al. Citation1998). As mentioned earlier, low concentrations of glucose can trigger growth stimulation, while high concentration inhibits growth (Cho et al. Citation2006). Moreover, glucose could be converted into ascorbic acid, which functions as an antioxidant and protects plant cells from oxidative damage.
As the main components of cell membrane, both lipids and proteins play an important role in cell division and expansion. It was reported (Hildebrandt et al. Citation2015) that amino acid biosynthesis is enhanced in growing photosynthetically active cells, with photosynthesis actively providing precursors for the highly active protein synthesis. Indeed, results presented in this study clearly indicated that alanine, aspartate and glutamate metabolisms, and aminoacyl-tRNA biosynthesis were enhanced during cotyledon opening. Amino acids, which had particularly obtained high concentrations at cotyledon opening (A3), were L-asparagine and L-aspartic acid. These findings nicely reflect the increase in the concentrations of glutamate, aspartate and asparagine, observed during Poplar seedling establishment (Qu et al. Citation2019). Importantly, L-asparagine and L-aspartic acid are the primary source of N for protein synthesis, particularly in actively growing tissues (Sieciechowicz et al. Citation1988; Brouquisse et al. Citation1992). Furthermore, N assimilation may, in turn, lead to the synthesis of other amino acids, such as lysine or phenylalanine, as observed in the present study. However, during Arabidopsis thaliana seedling establishment (Silva et al. Citation2017) mainly the amino acids isoleucine, serine, threonine and GABA increased. Thus, it seems that patterns of amino acid metabolisms are highly species-specific. In addition, the reduction of concentrations of the glucose derivatives in A. membranaceus cotyledon may promote the synthesis of amino acids through TCA cycle and the conversion of carbon to nitrogen sources, thus highlighting the important role of amino acids metabolites in maintaining the balance between carbon and nitrogen (Zheng Citation2009).
The variations in fatty acids metabolism during greening and formation of the photosynthetic apparatus were mainly studied in pea cotyledon (Trémolières and Lepage Citation1971; Abbas et al. Citation2015). In A. membranaceus cotyledons, concentrations of unsaturated fatty acids, especially of α-C18:3 increased during cotyledon opening, reflecting findings published for Sinapis alba L. and Crambe abyssinica L. (Yaniv et al. Citation1998). In the present study, the increase in linolenic acid (α-C18:3) contents of the cotyledons mainly attributed to the plastids (Figure S4), because this fatty acid accounts for 90% of thylakoid membrane compounds (Le Guedard et al. Citation2012). As a consequence, the changes in α-C18:3 may closely reflect the development of the plastids during the opening of the cotyledons and the ongoing plastid differentiation after full unfolding (Zienkiewicz et al. Citation2011), with the increase in unsaturated fatty acid concentrations mainly providing components of thylakoid membrane lipids.
The synthesis of lipids in the form of triacylglycerol (TAG) is catalyzed by the TAG lipase (Eastmond Citation2006). Early seedling establishment is largely driven by sugar produced from the degradation of seed-stored TAG and fatty acid β-oxidation (Pritchard et al. Citation2002; Liu et al. Citation2017b). The conversion of TAGs to sugars has great effects on cell division and expansion in cotyledons. and, therefore, is crucial for post-germinative organ development in seedlings (Yang and Benning Citation2018).
In addition, α-C18:3 acts as precursor for the synthesis of jasmonic acid (JA) (Zhao et al. Citation2005), which, in turn, could stimulate cotyledon opening by releasing MYC2 and suppressing the COP1 activity, which is followed by the induction of light-regulated transcription factors (Zheng et al. Citation2017). This suggests that α-C18:3 may stimulate cotyledon opening by the promotion of jasmonic acid synthesis. Besides this, the increase in the long-chain fatty acids (C20:0, C21:0), observed in the cotyledon of A. membranaceus in light, may be attributed to the potential involvement of their derivatives in the synthesis of epidermal waxes (Nobusawa et al. Citation2013).
4.2 The accumulated flavonoids enhanced adaptability after cotyledon opening and greening
The roles of flavonoids, located in the epidermis of leaves, can effectively absorb solar UV radiation (Goulas et al. Citation2004) and their respective function in photoprotection, particularly that of quercetin (Rozema et al. Citation2002), has been yet well established (Agati et al. Citation2013). As an example, the youngest unfolded Betula pendula leaves adjust the epidermal flavonoid content according to the UV irradiation dose during expansion (Luis et al. Citation2011). In the present study, flavonoid biosynthesis was, accordingly, largely enhanced only in fully opened and green cotyledons (A3) where they could act as effective UV screens. Notably, the specific accumulation of isoflavones initially occurred during the morphogenesis of A. membranaceus cotyledon In this context, terpenoid indole alkaloids were also strongly induced by light during cotyledon opening in Catharanthus roseus seedling (Yu et al. Citation2018). Besides this, phenylalanine, the precursor of the flavonoids synthesis, also increased at A3. As a factor limiting the initial mechanisms of UV protection during seedling establishment and being essential for proper chloroplast development (Sullivan et al. Citation2014), this compound is important for cotyledon morphogenesis.
Young seedlings are highly vulnerable during cotyledon morphogenesis. They are particularly sensitive to photodamage related to the absorption of excess light (Barber and Andersson Citation1992), resulting in the generation of ROS (Alboresi et al. Citation2011). As antioxidants, flavonoids are, therefore, located within or in the proximity of centers of ROS generation (Agati et al. Citation2012); e.g. chloroplast-located flavonoids may scavenge H2O2 and singlet oxygen (Agati et al. Citation2013).
In addition, flavonoids are known to regulate the transport of auxin (Peer and Murphy Citation2007). In the analysis of region-specific co-localization, flavonoids were found to be active regulators for auxin retention (Peer et al. Citation2001). Thus, the increase in flavonoids concentrations in A. membranaceus cotyledons may be related to the increasing need of the regulation of the auxin transport during cotyledon opening, as has been reported earlier (Daniel et al. Citation2009). Auxin signaling was also strongly observed along the margins of the cotyledon blade and at the cotyledon apex (Noh et al. Citation2001). Consequently, flavonoids could have been progressively accumulated at A3 to better retain auxin, thereby promoting cotyledon opening and greening.
5 Conclusion
In this study, the interrelationship between metabolism and cotyledon morphogenesis were investigated in detail. After double screening, 37 metabolites specifically related to light-induced cotyledon opening and greening were identified at the different stages of opening. During morphogenesis, the main changes in the contents of these specific metabolites occurred at the stage of fully opened and greened cotyledons. Only a few primary metabolites and fatty acids had changed before this. The increase in the contents of various sugars, unsaturated fatty acids and amino acids effectively provided sufficient resources for cotyledon opening and greening. Nevertheless, most phenols were involved in cotyledon morphogenesis. Flavonoids and flavonols, derived from amino acids, accumulated as UV-screening or antioxidant molecules, providing enhanced photoprotection and adaptability after cotyledon opening and greening. In this context, the decline in isoliquiritigenin, naringenin and chlorogenic acid contents reflects the involvement of these compounds in the flavonoid and flavonol biosynthesis. The integration analysis of metabolite profiles enables a very detailed view on the active metabolic reprograms during cotyledon morphogenesis and revealed novel interrelationships between metabolism and morphogenesis.
Authors contribution
Zhonghua Tang and Hongzheng Wang conceived and designed the experiments; Nan Yang, Jia Liu and Yang Liu performed the experiments; Nan Yang, Xiaorui Guo, and Ye Zhang analyzed the data; Nan Yang and Xiaorui Guo contributed reagents/materials/analysis tools; Nan Yang and Hongzheng Wang wrote the paper.
Supplemental Material
Download MS Word (254 KB)Supplemental Material
Download MS Excel (40 KB)Disclosure statement
No potential conflict of interest was reported by the author(s).
Additional information
Funding
Notes on contributors
Nan Yang
Nan Yang is a doctoral student. She is studying in the College of Chemistry, Chemical Engineering and Resource Utilization, Northeast Forestry University, Harbin, People's Republic of China. She mainly studies the regulation of growth and development and stress adaptation strategies of the medicinal plant Astragalus membranaceus.
Ye Zhang
Ye Zhang is a master's degree student. She is studying in the College of Chemistry, Chemical Engineering and Resource Utilization, Northeast Forestry University, Harbin, People's Republic of China. She mainly studies the relationship between secondary metabolism and nutritional regulation of medicinal plant Astragalus membranaceus.
Jia Liu
Jia Liu is a postdoctoral student. She works in Material Science and Engineering College, Northeast Forestry University, Harbin, People's Republic of China. She mainly studies the biological information and secondary metabolic regulation of medicinal plants.
Yang Liu
Yang Liu is a postdoctoral student. She works in School of Forestry, Northeast Forestry University, Harbin, People's Republic of China. Her main research direction is the metabolic analysis of plant resources.
Qi Chen
Qi Chen is a doctor. She works in School of Life Sciences, Nantong University, Nantong, People's Republic of China. Her main research direction is the metabolic response mechanism of medicinal plant Catharanthus roseus to abiotic stress.
Hongzheng Wang
Hongzheng Wang is a doctor. He works in the College of Chemistry, Chemical Engineering and Resource Utilization, Northeast Forestry University, Harbin, People's Republic of China. He is mainly engaged in the basic research on the metabolic regulation mechanism of plant resource components and the research on the cultivation, utilization and application of medicinal plants.
Xiaorui Guo
Xiaorui Guo is a doctoral supervisor. She works in the College of Chemistry, Chemical Engineering and Resource Utilization, Northeast Forestry University, Harbin, People's Republic of China. Her main research direction is the regulation of secondary metabolism of medicinal plant Catharanthus roseus.
Werner B. Herppich
Werner B. Herppich is a postdoctoral fellow. He works in the Department of Horticultural Engineering, Leibniz Institute for Agricultural Engineering and Bioeconomy (ATB), Potsdam, Germany. His current research focuses on the evaluation of photosynthetic, respirational and biomechanical properties, and water status of fruits, vegetables and ornamentals, scaling up from cells to the produce.
Zhonghua Tang
Zhonghua Tang is a doctoral supervisor. He is currently the vice dean of the College of Chemistry, Chemical Engineering and Resource Utilization, Northeast Forestry University, the leader of the first-tier discipline of Pharmacy of Northeast Forestry University, and the executive director of China Wild Plant Conservation Association. He is mainly engaged in the regulation of plant metabolism and the physiology and ecology of plant stress.
Notes
Note: Different letters indicate significant difference (P <0.05) between means, DS: Different stages, ARLE: Absolute rates of leaf expansion, GC: Growth condition.
References
- Abbas M, Berckhan S, Rooney DJ, Gibbs DJ, Vicente Conde J, Sousa Correia C, Bassel GW, Marín-de la Rosa N, León J, Alabadí D, Blázquez MA, Holdsworth MJ. 2015. Oxygen sensing coordinates photomorphogenesis to facilitate seedling survival. Curr Biol. 25:1483–1488. doi:10.1016/j.cub.2015.03.060
- Agati G, Azzarello E, Pollastri S, Tattini M. 2012. Flavonoids as antioxidants in plants: location and functional significance. Plant Sci. 196:67–76. doi:10.1016/j.plantsci.2012.07.014
- Agati G, Brunetti C, Di Ferdinando M, Ferrini F, Pollastri S, Tattini M. 2013. Functional roles of flavonoids in photoprotection: new evidence, lessons from the past. Plant Physiol Biochem. 72:35–45. doi:10.1016/j.plaphy.2013.03.014
- Alboresi A, Dall'Osto L, Aprile A, Carillo P, Roncaglia E, Cattivelli L, Bassi R. 2011. Reactive oxygen species and transcript analysis upon excess light treatment in wild-type Arabidopsis thaliana vs a photosensitive mutant lacking zeaxanthin and lutein. BMC Plant Biol. 11:62. doi:10.1186/1471-2229-11-62
- Alves da Silva H, de Oliveira DFA, Avelino AP, Costa de Macêdo CE, Galvão TB, Voigt EL. 2019. Salt stress differentially regulates mobilization of carbon and nitrogen reserves during seedling establishment of Pityrocarpa moniliformis. Plant Biol. 21(6):1110–1118.
- Arsovski AA, Galstyan A, Guseman JM, Nemhauser JL. 2012. Photomorphogenesis. The Arabidopsis Book. 10:e0147. doi:10.1199/tab.0147
- Barber J, Andersson B. 1992. Too much of a good thing: light can be bad for photosynthesis. Trends Biochem Sci. 17:61–66. doi:10.1016/0968-0004(92)90503-2
- Bellaire A, Ischebeck T, Staedler Y, Weinhaeuser I, Mair A, Parameswaran S, Ito T, Schönenberger J, Weckwerth W. 2014. Metabolism and development–integration of micro computed tomography data and metabolite profiling reveals metabolic reprogramming from floral initiation to silique development. New Phytol. 202:322–335. doi:10.1111/nph.12631
- Bowler C, Botto J, Deng X-W. 2013. Photomorphogenesis, B-Box transcription factors, and the legacy of Magnus Holm. Am Soc Plant Biol. 25(4):1192–1195.
- Brouquisse R, James F, Pradet A, Raymond P. 1992. Asparagine metabolism and nitrogen distribution during protein degradation in sugar-starved maize root tips. Planta. 188:384–395. doi:10.1007/BF00192806
- Carpita NC, Gibeaut DM. 1993. Structural models of primary cell walls in flowering plants: consistency of molecular structure with the physical properties of the walls during growth. Plant J. 3:1–30. doi:10.1111/j.1365-313X.1993.tb00007.x
- Chacón I-l-C, Riley-Saldaña CA, González-Esquinca AR. 2013. Secondary metabolites during early development in plants. Phytochem Rev. 12:47–64. doi:10.1007/s11101-012-9250-8
- Chen Q, Lu X, Guo X, Liu J, Liu Y, Guo Q, Tang Z. 2018. The specific responses to mechanical wound in leaves and roots of Catharanthus roseus seedlings by metabolomics. J Plant Interact. 13:450–460. doi:10.1080/17429145.2018.1499970
- Cho YH, Yoo SD, Sheen J. 2006. Regulatory functions of nuclear hexokinase1 complex in glucose signaling. Cell. 127:579–589. doi:10.1016/j.cell.2006.09.028
- Daniel RL, Guosheng W, Karin L, Spalding EP. 2009. Auxin transport into cotyledons and cotyledon growth depend similarly on the ABCB19 Multidrug Resistance-like transporter. Plant J Cell Mol Biol. 60:91–101. doi:10.1111/j.1365-313X.2009.03941.x
- Doss M, Oette K. 1965. Rapid method for the preparation of fatty acid methyl esters for gas chromatographic analysis. Z Klin Chem Klin Biochem. 3:125–129.
- Eastmond PJ. 2006. SUGAR-DEPENDENT1 encodes a patatin domain triacylglycerol lipase that initiates storage oil breakdown in germinating Arabidopsis seeds. Plant Cell. 18:665–675. doi:10.1105/tpc.105.040543
- Gommers CM, Monte E. 2018. Seedling establishment: a dimmer switch-regulated process between dark and light signaling. Plant Physiol. 176:1061–1074. doi:10.1104/pp.17.01460
- Goulas Y, Cerovic ZG, Cartelat A, Moya I. 2004. Dualex: a new instrument for field measurements of epidermal ultraviolet absorbance by chlorophyll fluorescence. Appl Opt. 43:4488–4496. doi:10.1364/AO.43.004488
- He D, Damaris RN., Fu J, Tu J, Fu T, Xi C, Yi B, Yang P. 2016. Differential Molecular responses of rapeseed cotyledons to light and dark reveal metabolic Adaptations toward Autotrophy establishment. Front Plant Sci. 7:988..
- Hildebrandt TM, Nunes Nesi A, Araújo WL, Braun HP. 2015. Amino acid Catabolism in plants. Mol Plant. 8(11):1563–1579. doi:10.1016/j.molp.2015.09.005
- Jun YM, Kim EH, Lim JJ, Kim SH, Kim SH, Lim JD. 2012. Variation of phenolic compounds contents in cultivated Astragalus membranaceus Korean. J Med Crop Sci. 20:447–453. doi:10.7783/KJMCS.2012.20.6.447
- Laitinen ML, Julkunen-Tiitto R, Rousi M. 2002. Foliar phenolic composition of European white birch during bud and leaf development. Physiol Plant. 114:450–460. doi:10.1034/j.1399-3054.2002.1140315.x
- Le Guedard M, Faure O, Bessoule JJ. 2012. Early changes in the fatty acid composition of photosynthetic membrane lipids from Populus nigra grown on a metallurgical landfill. Chemosphere. 88:693–698. doi:10.1016/j.chemosphere.2012.03.079
- Li Y, Guo S, Zhu Y, Yan H, Qian DW, Wang HQ, Yu JQ, Duan JA. 2019. Comparative analysis of twenty-five compounds in different parts of Astragalus membranaceus var. mongholicus and Astragalus membranaceus by UPLC-MS/MS. J Pharm Anal. 9(6):392–399.
- Liu WC, Han TT, Yuan HM, Yu ZD, Zhang LY, Zhang BL, Zhai S, Zheng SQ, Lu YT. 2017b. CATALASE2 functions for seedling postgerminative growth by scavenging H2O2 and stimulating ACX2/3 activity in Arabidopsis. Plant Cell Environ. 40:2720–2728. doi:10.1111/pce.13031
- Liu J, Liu Y, Wang Y, Abozeid A, Zu Y-G, Tang Z-H. 2017a. The integration of GC–MS and LC–MS to assay the metabolomics profiling in Panax ginseng and Panax quinquefolius reveals a tissue-and species-specific connectivity of primary metabolites and ginsenosides accumulation. J Pharm Biomed Anal. 135:176–185. doi:10.1016/j.jpba.2016.12.026
- Luis OM, Tegelburg R, Brosche M, Lindfors A, Siipola S, Aphalo PJ. 2011. Temporal variation in epidermal flavonoids due to altered solar UV radiation is moderated by the leaf position in Betula pendula. Physiol Plant. 143:261–270. doi:10.1111/j.1399-3054.2011.01511.x
- Mackender R, Leech RM. 1974. The Galactolipid, phospholipid, and fatty acid composition of the chloroplast envelope membranes of Vicia faba. L. Plant Physiol. 53:496–502. doi:10.1104/pp.53.3.496
- Nobusawa T, Okushima Y, Nagata N, Kojima M, Sakakibara H, Umeda M. 2013. Synthesis of very-long-chain fatty acids in the epidermis controls plant organ growth by restricting cell proliferation. PLoS Biol. 11:e1001531. doi:10.1371/journal.pbio.1001531
- Noh B, Murphy AS, Spalding EP. 2001. Multidrug resistance-like genes of Arabidopsis required for auxin transport and auxin-mediated development. Plant Cell. 13:2441–2454.
- Peer WA, Brown DE, Tague BW, Muday GK, Taiz L, Murphy AS. 2001. Flavonoid accumulation patterns of transparent testa mutants of Arabidopsis. Plant Physiol. 126:536–548. doi:10.1104/pp.126.2.536
- Peer WA, Murphy AS. 2007. Flavonoids and auxin transport: modulators or regulators? Trends Plant Sci. 12:556–563. doi:10.1016/j.tplants.2007.10.003
- Pei G, Chen L, Zhang W. 2017. WGCNA application to proteomic and metabolomic data analysis. Methods in enzymology. Academic Press. 585:135–158. doi:10.1016/bs.mie.2016.09.016. Epub 2016 Dec 15. PMID: 28109426.
- Pfeiffer A, Janocha D, Dong Y, Medzihradszky A, Schöne S, Daum G, Suzaki T, Forner J, Langenecker T, Rempel E, Schmid M, Wirtz M, Hell R, Lohmann JU. 2016. Integration of light and metabolic signals for stem cell activation at the shoot apical meristem. Elife. 5:e17023. doi:10.7554/eLife.17023
- Pritchard SL, Charlton WL, Baker A, Graham IA. 2002. Germination and storage reserve mobilization are regulated independently in Arabidopsis. Plant J. 31:639–647. doi:10.1046/j.1365-313X.2002.01376.x
- Qu C, Zuo Z, Cao L, Huang J, Sun X, Zhang P, Yang C, Li L, Xu Z, Liu G. 2019. Comprehensive dissection of transcript and metabolite shifts during seed germination and post-germination stages in poplar BMC. Plant Biology. 19:279.
- Ribeiro PR, Willems LA, Mutimawurugo M-C, Fernandez LG, de Castro RD, Ligterink W, Hilhorst HW. 2015. Metabolite profiling of Ricinus communis germination at different temperatures provides new insights into thermo-mediated requirements for successful seedling establishment. Plant Sci. 239:180–191. doi:10.1016/j.plantsci.2015.08.002
- Roldan MVG, Engel B, de Vos RCH, Vereijken P, Astola L, Groenenboom M, van de Geest H, Bovy A, Molenaar J, van Eeuwijk F. 2014. Metabolomics reveals organ-specific metabolic rearrangements during early tomato seedling development. Metabolomics. 10:958–974. doi:10.1007/s11306-014-0625-2
- Rozema J, Björn LO, Bornman JF, Gaberscik A, Häder DP, Trost T, Germ M, Klisch M, Gröniger A, Sinha RP, Lebert M, He YY, Buffoni-Hall R, de Bakker NV, van de Staaij J, Meijkamp BB. 2002. The role of UV-B radiation in aquatic and terrestrial ecosystems—an experimental and functional analysis of the evolution of UV-absorbing compounds. J Photochem Photobiol, B. 66:2–12. doi:10.1016/S1011-1344(01)00269-X
- Sieciechowicz KA, Joy KW, Ireland RJ. 1988. The metabolism of asparagine in plants. Phytochemistry. 27:663–671. doi:10.1016/0031-9422(88)84071-8
- Silva AT, Ligterink W, Hilhorst HW. 2017. Metabolite profiling and associated gene expression reveal two metabolic shifts during the seed-to-seedling transition in Arabidopsis thaliana. Plant Mol Biol. 95:481–496. doi:10.1007/s11103-017-0665-x
- Smeekens S, Ma J, Hanson J, Rolland F. 2010. Sugar signals and molecular networks controlling plant growth. Curr Opin Plant Biol. 13:273–278. doi:10.1016/j.pbi.2009.12.002
- Stoynova-Bakalova E, Karanov E, Petrov P, Hall M. 2004. Cell division and cell expansion in cotyledons of Arabidopsis seedlings. New Phytol. 162:471–479. doi:10.1111/j.1469-8137.2004.01031.x
- Sullivan JA, Deng XW. 2003. From seed to seed: the role of photoreceptors in Arabidopsis development. Dev Biol. 260:289–297. doi:10.1016/S0012-1606(03)00212-4
- Sullivan JH, Muhammad D, Warpeha KM. 2014. Phenylalanine is required to promote specific developmental responses and prevents cellular damage in response to ultraviolet light in soybean (Glycine max) during the seed-to-seedling transition. PloS one. 9:e112301. doi:10.1371/journal.pone.0112301
- Tamagnone L, Merida A, Stacey N, Plaskitt K, Parr A, Chang CF, Lynn D, Dow JM, Roberts K, Martin C. 1998. Inhibition of phenolic acid metabolism results in precocious cell death and altered cell morphology in leaves of transgenic tobacco plants. Plant Cell. 10:1801–1816. doi:10.1105/tpc.10.11.1801
- Trémolières A, Lepage M. 1971. Changes in lipid composition during greening of etiolated pea seedlings. Plant Physiol. 47:329–334. doi:10.1104/pp.47.2.329
- Xu RY, Nan P, Yang Y, Pan H, Zhou T, Chen J. 2011. Ultraviolet irradiation induces accumulation of isoflavonoids and transcription of genes of enzymes involved in the calycosin-7-.
- Yang N, Guo X, Wu Y, Hu X, Ma Y, Zhang Y, Wang H & Tang Z. 2018. The inhibited seed germination by ABA and MeJA is associated with the disturbance of reserve utilizations in Astragalus membranaceus. Journal of Plant Interactions. 13:388–397. doi:10.1080/17429145.2018.1483034
- Yang Y, Benning C. 2018. Functions of triacylglycerols during plant development and stress. Curr Opin Biotechnol. 49:191–198. doi:10.1016/j.copbio.2017.09.003
- Yaniv Z, Shabelsky E, Schafferman D, Granot I, Kipnis T. 1998. Oil and fatty acid changes in Sinapis and Crambe seeds during germination and early development. Ind Crops Prod. 9:1–8. doi:10.1016/S0926-6690(98)00005-3
- Yong W, Link B, O'Malley R, Tewari J, Hunter CT, Lu CA, Li X, Bleecker AB, Koch KE, McCann MC, McCarty DR, Patterson SE, Reiter WD, Staiger C, Thomas SR, Vermerris W, Carpita NC. 2005. Genomics of plant cell wall biogenesis. Planta. 221:747–751. doi:10.1007/s00425-005-1563-z
- Yu B, Liu Y, Pan Y, Liu J, Wang H, Tang Z. 2018. Light enhanced the biosynthesis of terpenoid indole alkaloids to meet the opening of cotyledons in process of photomorphogenesis of Catharanthus roseus. Plant Growth Regul. 84:617–626. doi:10.1007/s10725-017-0366-0
- Zhao J, Davis LC, Verpoorte R. 2005. Elicitor signal transduction leading to production of plant secondary metabolites. Biotechnol Adv. 23:283–333.. doi:10.1016/j.biotechadv.2005.01.003
- Zheng ZL. 2009. Carbon and nitrogen nutrient balance signaling in plants. Plant Signal Behav. 4:584–591.. doi:10.4161/psb.4.7.8540
- Zheng Y, Cui X, Su L, Fang S, Chu J, Gong Q, Yang J, Zhu Z. 2017. Jasmonate inhibits COP1 activity to suppress hypocotyl elongation and promote cotyledon opening in etiolated Arabidopsis seedlings. Plant J. 90:1144–1155. doi:10.1111/tpj.13539
- Zhou L, Jang J-C, Jones TL, Sheen J. 1998. Glucose and ethylene signal transduction crosstalk revealed by an Arabidopsis glucose-insensitive mutant. Proc Natl Acad Sci U S A. 95:10294–10299. doi:10.1073/pnas.95.17.10294
- Zhou X-R, Shrestha P, Yin F, Petrie JR, Singh SP. 2013. AtDGAT2 is a functional acyl-CoA: diacylglycerol acyltransferase and displays different acyl-CoA substrate preferences than AtDGAT1. FEBS Lett. 587:2371–2376. doi:10.1016/j.febslet.2013.06.003
- Zienkiewicz A, Jimenez-Lopez JC, Zienkiewicz K, de Dios Alche J, Rodriguez-Garcia MI. 2011. Development of the cotyledon cells during olive (Olea europaea L.) in vitro seed germination and seedling growth. Protoplasma. 248(4):751–765. doi:10.1007/s00709-010-0242-5