
ABSTRACT
Really Interesting New Gene (RING) proteins are referred to as CHY zinc and ring finger protein (CHYR) members because they have the CHY domain, a type of protein that responds to abiotic stress. However, there are scant data on CHYR members in Phaseolus vulgaris (common bean). This study identified eight CHYR members (PvCHYRs) in the reference genome. A comprehensive analysis was performed to determine function, location, basic information, evolution, motifs, gene structure, cis-acting elements, collinearity, and expression patterns at the seeding stage. The results demonstrated that PvCHYRs might be involved in response to abiotic stressors, whereas some PvCHYRs were screened and can be used as candidate CHYR genes in further research. This study provides a basis for identifying and analyzing PvCHYR members and provides insights for their screening in future research.
Introduction
The Really Interesting New Gene (RING) proteins are important proteins that respond to abiotic stress (Ding et al. Citation2015), and their ubiquitination may play a significant role in response to environmental stress (including abiotic stresses) (Smalle and Vierstra Citation2004). These proteins are also called CHY zinc and ring finger protein (CHYR) members because they have a CHY domain (Jia et al. Citation2021). CHYR members have CHY and RING finger domains, with the N-terminal CHY domain having some conserved cysteine and histidine residues (Cayrol et al. Citation2007; Finn et al. Citation2010). Protein sequence alignment depicted that CHYR family members contain CHY zinc-finger, ring finger, and rubredoxin-type fold domains, thus defining them as CHYR family members containing these domains (Matthiadis and Long Citation2016; Hindt et al. Citation2017; Rodriguez-Celma et al. Citation2019a). CHYR members may play a role in binding to zinc ions, physical interactions, protein–protein interactions, and ubiquitination due to the CHY zinc and ring finger domains (Finn et al. Citation2010; Lee and Kim Citation2011; Xia et al. Citation2013), whereas rubredoxin-type fold domain may play a role in regulating iron homeostasis (Hindt et al. Citation2017; Kobayashi Citation2019; Rodriguez-Celma et al. 2019).
CHYR members have been reported to perform vital functions in plant growth, development, and various stress responses through ubiquitination and degradation of proteins (Ding et al. Citation2015; Rodriguez-Celma et al. 2019). The first CHYR member in Arabidopsis was identified in 2013 and named MYB30-Interacting E3 Ligase 1(MIEL1) (Marino et al. Citation2013), which can stabilize proteins (such as MYB96 and MYB30), facilitate crosstalk between abscisic acid (ABA) and biotic stress (Lee and Seo Citation2016), and negatively regulate cuticular wax biosynthesis in stems (Lee et al. Citation2017). More and more results indicated that CHYR members have a role in plant growth, development, and stress response (Jia et al. Citation2021). Some CHYR members are closely related to reactive oxygen species (ROS), which might play a functional role by regulating ROS under abiotic stresses (He et al. Citation2018): AtCHYR1 is a CHYR member in Arabidopsis, which stimulates ROS production, closes the stoma to increase ABA content, and responds to drought stress (Ding et al. Citation2015); PeCHYR1, a CHYR gene in Populus euphratica and a homologous gene of AtCHYR1, exhibited similar phenotypes under drought tolerance, such as stomatal closure and hydrogen peroxide (H2O2) production through the regulation of ROS (He et al. Citation2018); the CHYR gene OsRZF34 has the CHYR domain, which could open stomata and cool leaves under stress (Hsu et al. Citation2014); MYB30 could interact with MIEL1 and then suppress defense and hypersensitive responses through the regulation of ROS (Lee et al. Citation2017).
CHYR members have been identified in certain plant species, such as soybean (Glycine max) (Jia et al. Citation2021) and bread wheat (Triticum aestivum) (Liu et al. Citation2022); however, few studies have been conducted on common bean (Phaseolus vulgaris). Common bean, a legume crop cultivated on approximately 30 million hectares worldwide (Buruchara et al. Citation2011), is rich in starch, protein, fiber, vitamins, and folate (Mukankusi et al. Citation2019). It is sensitive to abiotic stress, especially at the seedling stage (Zhang et al. Citation2021; Zhang et al. Citation2022); Consequently, the improvement of common bean tolerance to abiotic stresses is of prime interest. Some gene families, including CCCH (Zhang et al. Citation2020), bZIP (Zhang et al. Citation2022), PRX (Boubakri et al. Citation2022a), SWEET (Du et al. Citation2022a), and LBD (Du et al. Citation2022b) had been identified in common bean, which had the connection with abiotic stresses. In the present study, the CHYR members were identified in common beans. A systematic analysis (including location, evolution, motif, gene structure, cis-acting elements, and collinearity) of the CHYR members was performed in common bean beside their expression patterns in response to abiotic stressors to filter out potential gene candidates for future functional analyses.
Materials and methods
Identification and analysis of CHYR members
The reference genome of the common bean (Phaseolus vulgaris) was obtained from the Ensembl Plants website (https://plants.ensembl.org/index.html), and PhaVulg1_0 version was used to identify CHYR members. Deoxyribonucleic acid (DNA), protein (pep), coding sequence (CDS), complementary DNA (cDNA), and general feature format (gff) information were obtained from the Ensembl Plants website (Kitts et al. Citation2016). The domain was provided by the Pfam 35.0 database (Mistry et al. Citation2021), while hmmsearch and hmmbuild were used to develop models with multiple alignment sequences. The location of CHYR members in the common bean was analyzed using TBtools (Chen et al. Citation2020) and named accordingly. The evolution was constructed by MEGA X (Kumar et al. Citation2018), in which LG+G was set as the optimal computing model predicted by MEGA using maximum likelihood. The motifs were analyzed using the MEME Suite (Bailey et al. Citation2015), and the value of each motif was less than 1e−10. Gene structure and cis-acting elements were analyzed using Gene Structure Display Server (GSDS) and PlantCARE databases, respectively (Lescot et al. Citation2002; Guo et al. Citation2007). The multiple collinearity scan toolkit (MCScanX) and Circos were used to analyze the collinearity of CHYR members in the common bean (Krzywinski et al. Citation2009; Wang et al. Citation2012). The expression pattern data of CHYR members were obtained from the Phytozome website (https://phytozome-next.jgi.doe.gov/) (Goodstein et al. Citation2012) and visualized using TBtools (Chen et al. Citation2020).
Plant materials, treatment and qRT-PCR analysis
Longyun No.5, which was bred by the Heilongjiang Academy of Agricultural Sciences (Harbin, Heilongjiang, China), was used as the plant material, and a local variety was grown in Northeast China and seemed to tolerate stress. The seeds were provided by the Crop Resources Research Institute of Heilongjiang Academy of Agricultural Sciences (Harbin, Heilongjiang, China). The seeds were placed in a wet kit for five days in a 25°C incubator without light to facilitate germination after 10 min of sodium hypochlorite (NaClO) treatment. The sprouts with the same growth trend on the fifth day were chosen for different treatments, including control (CK), salt (70 mmol/L NaCl) (Zhang et al. Citation2022), and cold (4°C) (Hayford et al. Citation2017) for 12 h stresses. The cotyledons, hypocotyls, and radicles were included in the control treatment on the fifth day, while radicles in salt and cold treatments were set as samples. Total RNA was extracted using the MolPure® Plant Plus RNA Kit (19292, Yeasen, Shanghai) according to manufacturer’s instructions and tested using NanoDrop (Thermo OneC, United States) and 2% agarose gel electrophoresis. The qualifying RNA was then reverse-transcribed into cDNA using 5X Evo M-MLV RT Master Mix (AG11706, Accurate Biology, Hunan, China). The primers of CHYR members in common bean were designed using Primerpremier 5.0 (Singh et al. Citation1998), while Pvactin served as the reference gene (Table S1). The qRT-PCR system provided by the Roche platform (480II, Roche, Basel, Switzerland) and Hieff UNICON® Universal Blue qPCR SYBR Green Master Mix (11184, Yeasen, Shanghai, China) were used according to the manufacturer’s instructions. The qRT-PCR program was 94°C for 30 s; followed by 40 cycles: 5 s at 94°C, 15 s at 60°C, and 15 s at 72°C, and a final elongation step for 5 min at 72°C. The 2-ΔCt method (Livak and Schmittgen Citation2001) was used to calculate the relative expression of common bean CHYR genes (two biological and two technical replicates were performed).
Statistical analysis
The data of qRT-PCR analysis were analyzed using SPSS 19.0 software (Preacher and Hayes Citation2004), and significant differences were determined by ANOVA tests.
Results
Identification of CHYR members
After hmmbuild and hmmsearch, 14 members containing the CHY domain were identified. After removing duplicate values, eight members remained that might be identified as CHYR members from the common bean genome (Phaseolus vulgaris). All CHYR members were named PvCHYR01-08 based on their location in the genome (). Chrs 1, 2, 3, 6, 9, and 11 had PvCHYR members, with Chr 3 having the most number of PvCHYR members (3). Detailed information is presented in . The protein length ranged from 221 (PvCHYR08) to 1256 (PvCHYR05), while the isoelectric point of PvCHYR members was between 5.78 (PvCHYR02) and 7.19 (PvCHYR07). The PvCHYR with the largest molecular weight was PvCHYR05 (145479.33), while the lowest molecular weight was 25411.16 (PvCHYR08). The variation ranges of the instability and aliphatic index were 38.34–60.08 and 61.18–65.57, respectively. This detailed information helps to realize the importance of PvCHYRs.
Figure 1. Location of the PvCHYRs. The ruler on the left represents its location on chromosomes on the reference genome. The tightness of the line represents the density of genes. All this information was provided by the Ensembl Plants database.
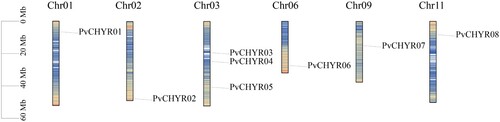
Table 1. The detailed information of PvCHYRs.
Evolution of PvCHYRs
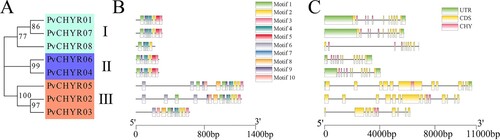
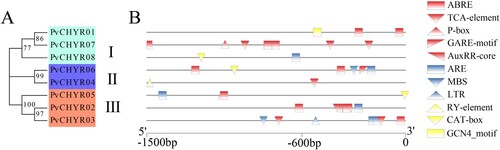
MEGA X was used to analyze the evolutionary relationship of PvCHYRs using the maximum likelihood method with 1,000 bootstraps predicted by MEGA based on the protein sequence of PvCHYRs. The Dayhoff+G model is used in this study. The results revealed that the members were divided into three subgroups, with three PvCHYR members in subgroups I and III and only two in subgroup II (PvCHYR04 and 06).
Motifs and gene structure of PvCHYRs
MEME was used to analyze the motifs of PvCHYRs, where the length of the amino acids of the motifs ranged from 10 to 50, and the e-value was less than 1e−20. The motif results of PvCHYRs revealed that all members had motifs 1, 2, 3, and 4, whereas members of each subgroup had motifs of the same kind (). Motifs 5 and 9 were present in subgroups I and II, while motifs 6, 8, and 10 were exclusive to subgroup III members. These results suggest that the PvCHYRs in each subgroup may have similar functions. In addition, GSDS was used to analyze the gene structure of PvCHYRs. The sequence of the PvCHYRs was divided into the untranslated region (UTR) (green squares), coding sequence region (CDS) (yellow squares), and intron region (black lines). In addition, the sequence encoding the CHY domain was determined and is depicted as pink squares. The gene structure results of the PvCHYRs revealed that the members of each subgroup had a similar gene structure (). Subgroup II members (PvCHYR04 and 06) had a longer CDS region, while the coding CHY domain was located farther forward compared to the other subgroups. These results demonstrated that the PvCHYRs in each subgroup might share a similar structure.
Figure 3. The motifs and gene structure analysis of PvCHYRs. (A) The evolution of PvCHYRs; (B) The motifs of PvCHYRs. Ten squares with different colors represent different motifs; (C) The gene structure of PvCHYRs. The green squares represent the UTR region, the yellow squares represent the CDS region, and the pink squares represent the sequence coding CHY domain.
Comprehensive analysis of CHYR members
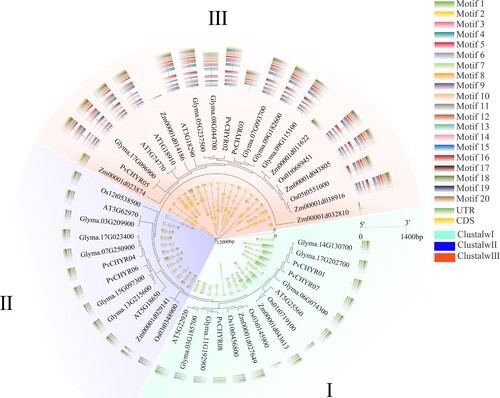
The CHYR members of five species (Arabidopsis, rice maize, soybean, and common bean) were analyzed. These members were divided into three subgroups in the evolutionary analysis, with more members in subgroups I (15) and III (20) than in subgroup II (12). This finding was similar to the evolutionary relationship observed in PvCHYRs ( and ). Analysis of CHYR members depicted that CHYR members in each subgroup had similar motifs and gene structures, indicating that CHYRs in each subgroup may have similar functions.
Figure 2. The evolutionary analysis of PvCHYRs. The arc shapes with different colors represent subgroups I, II, and III.
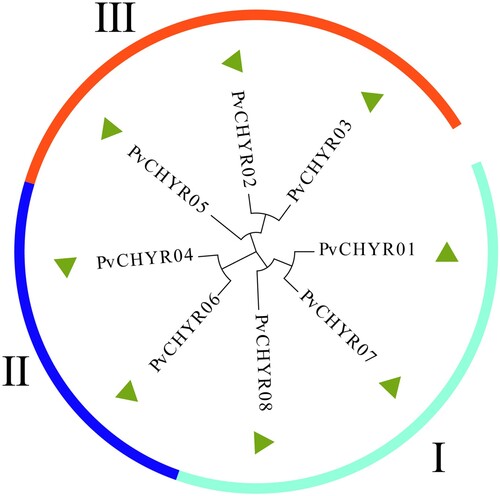
Figure 4. The evolution, motifs, and gene structure analysis of CHYR members in five species, Arabidopsis, rice, maize, soybean, and common bean. Different colored backgrounds represent different subgroups. The outer ring is the motif analysis, while the inner ring is the gene structure analysis of CHYR members.
Cis-acting elements of PvCHYRs
Plant care was used to analyze the cis-acting elements of PvCHYRs and predict their functions (Table S2). The cis-acting elements were divided into three categories: hormone-(red), stress-(blue), and sprout-related (yellow). This analysis revealed that almost all members had hormone-related elements, except PvCHYR08, in which PvCHYRs might respond to hormones. More than half of the members had stress-related elements, indicating that some PvCHYRs may be associated with stress. Some members contained sprout-related elements, indicating that PvCHYRs may have participated in the sprouting stage ().
Figure 5. The cis-acting elements analysis of PvCHYRs. (A) The evolution of PvCHYRs. (B) The cis-acting elements of PvCHYRs. The red ones represent the hormone-related elements, the blue ones represent stress-related elements, and the yellow ones represent sprout-related elements.
Collinearity of PvCHYRs
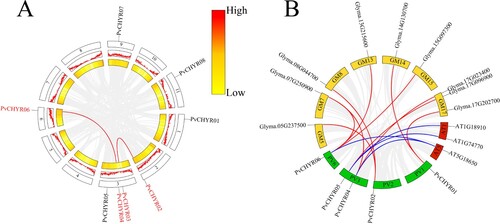
The collinear relationship between PvCHYRs was analyzed in this study. The results are depicted in . Only two pairs of PvCHYRs depicted a collinear relationship (PvCHYR02 and 03, PvCHYR04 and 06). PvCHYRs had more collinear pairs with soybean (10) than Arabidopsis (4), suggesting that these collinear genes may have similar functions to PvCHYRs.
Figure 6. The collinearity analysis of PvCHYRs. (A) The collinear relationship of PvCHYRs. Two middle rings represent the gene density of the genome. (B) The collinear relationship of PvCHYRs with soybean and Arabidopsis. Green squares are common bean’s chromosomes; yellow ones are soybean chromosomes, while red ones represent Arabidopsis’s chromosomes. Red lines represent the collinear relationship with soybean, and blue lines represent the collinear relationship with Arabidopsis.
Expression patterns of PvCHYRs in silico and qRT-PCR analysis at seeding stage
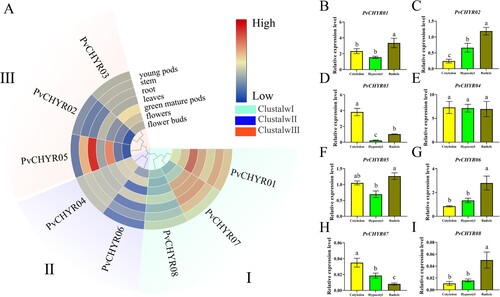
The expression patterns of PvCHYRs in different tissues were extracted from the Phytozome database. The results demonstrated that PvCHYRs had tissue-specific expression patterns. Some PvCHYRs (such as PvCHYR05) had a higher expression in roots, whereas PvCHYR01 had a higher expression in mature green pods, and the expression pattern of PvCHYRs at the seeding stage was analyzed by qRT-PCR. The results depicted that almost all PvCHYRs (such as PvCHYR01, 02, 03, and 07) had tissue-specific expression patterns, whereas others (such as PvCHYR04) did not. A greater number of PvCHYRs were highly expressed in radicles, which might be used to target tissues during the seeding stage ().
Figure 7. The expression pattern analysis of PvCHYRs in different tissues at the seeding stage. (A) The expression pattern analysis of PvCHYRs in silico. Different colored backgrounds represent different subgroups. The color of the squares, from blue to red, represent the expression level from low to high, respectively. (B-I) The expression pattern analysis of PvCHYRs by qRT-PCR analysis. The columns of three colors represent cotyledons, hypocotyls, and radicles, respectively. The different letters on the column represent the significance (P < 0.05).
Expression pattern of PvCHYRs under abiotic stress
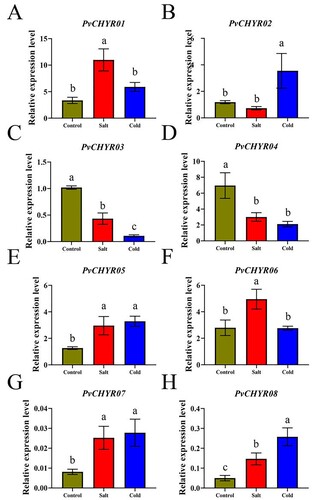
This study determined the expression levels of PvCHYRs at the seedling stage under abiotic stress using qRT-PCR. The results displayed that almost all members had significantly different expression levels under abiotic stress conditions (P < 0.05). Some PvCHYRs (such as PvCHYR01, 05, 07, and 08) were upregulated under stress, whereas others (such as PvCHYR03 and 04) were downregulated. All these results demonstrated that PvCHYRs have closely related to abiotic stress, and they may be used as candidate members in further research ().
Figure 8. The expression pattern analysis of PvCHYRs in radicle at the seeding stage under abiotic stress. The columns of three colors represent control, salt, and cold, respectively. The different letters on the column represent the significance (P < 0.05).
Discussion
CHYR members have been identified in some plants such as Arabidopsis, rice, maize, soybean, and wheat (Xia et al. Citation2012; Hsu et al. Citation2014; Rodriguez-Celma et al. 2019; Jia et al. Citation2021; Liu et al. Citation2022). However, the number of CHYR members in different plant species varies substantially; 18 TaCHYR members have been identified in the bread wheat (Triticum aestivum) genome (Liu et al. Citation2022), while 16 GmCHYR members have been identified in the soybean (Glycine max) genome (Jia et al. Citation2021). In this study, only eight CHYR members were identified in the reference genome of the common bean (Phaseolus vulgaris), which is lower than the number of TaCHYRs and GmCHYRs. This phenomenon could be due to the small size of the common bean genome compared to that of wheat and soybean (Zhang et al. Citation2022) beside the differential evolutionary history of each plant species (Feller et al. Citation2011). The CHYR members in plants emerged during evolution, resulting in the appearance of three subgroups (Ding et al. Citation2015; Liu et al. Citation2022); in which subgroups I and II CHYR members appear after angiosperm differentiation (Liu et al. Citation2022). TaCHYR and GmCHYR members were also divided into three subgroups based on evolutionary analysis (Jia et al. Citation2021; Liu et al. Citation2022). Additionally, the evolution of PvCHYRs demonstrated that their members were divided into three subgroups, with subgroup II including fewer members than subgroups I and III. The evolution of CHYR members in the five species (containing monocots and dicots) depicted three subgroups, which may be characteristic of PvCHYRs.
The motifs and gene structure of PvCHYRs demonstrated that each subgroup member had similar motifs and gene structures similar to those of TaCHYRs and GmCHYRs (Liu et al. Citation2022). The conserved motifs, including CHY and ring finger domains, have been displayed to have an important function in response to adverse stresses, especially abiotic stress (He et al. Citation2018). These results suggest that PvCHYRs may be related to abiotic stress. According to the analysis of the cis-acting elements, ARE, MBS, and LTR were identified as three cis-acting elements related to abiotic stress in the initiation region of PvCHYRs. These cis-acting elements also appeared in the CHYR members in other plants or other gene families related to abiotic stress tolerance, such as SULTR and Grxs (Boubakri et al. Citation2022b). PvCHYRs also were found to have a collinear relationship with AT1G18910, AT1G74770, and AT5G18650, AT1G18910 and AT1G74770 that regulated ion homeostasis and responded to ion import into the cell (Colangelo and Guerinot Citation2004; Rodriguez-Celma et al. 2019), whereas AT5G18650 was found to be involved in stress response (Marino et al. Citation2013). These findings suggest that PvCHYRs might have a role in abiotic stress response in common bean.
Previous studies have reported that CHYR members exhibit tissue-specific expression (Liu et al. Citation2022). In this study, PvCHYRs also revealed tissue-specific expression patterns. In addition, CHYR genes have been reported to participate in various biological processes and stress responses (Li and Lan Citation2015; Leng and Hall Citation2019). Some GmCHYRs exhibit a potential role in the stress response, as their expression levels are upregulated or downregulated in response to abiotic stresses (Jia et al. Citation2021). ATCHYR1 is a CHYR gene that improves tolerance by promoting stomatal closure and ROS production (Matthiadis and Long Citation2016). CaASRF1, a CHYR member, positively modulates abiotic stress via the ABA pathway (Moore and Purugganan Citation2003). Moreover, certain H-type thioredoxins (Trxs) were previously reported to be induced by abiotic stresses in Phaseolus vulgaris and the authors have suggested that these members might be used to engineer new salt-tolerant lines (Boubakri et al. Citation2021). Similarly, in our present study, specific PvCHYR members (PvCHYR01, 05, and 08) were found to be upregulated under abiotic stresses suggesting that these genes may also be good candidates for further functional analyses.
Conclusions
This study identified eight CHYR members through the common bean reference genome and named PvCHYR01–08 based on their location information. A comprehensive analysis including evolution, motifs, gene structure, and cis-acting elements revealed that the PvCHYRs in each subgroup were similar. Analysis of cis-acting elements, collinearity, and expression patterns under abiotic stresses demonstrated that some PvCHYRs may be connected to abiotic stresses and might be used as candidate CHYR genes in future functional studies.
Supplemental Material
Download Zip (22.1 KB)Disclosure statement
No potential conflict of interest was reported by the author(s).
Data availability statement
All data generated or analyzed during this study are included in this manuscript.
Additional information
Funding
Notes on contributors
Xianxin Meng
Meng Xianxin, Associate professor, Institute of Crop Resources, Heilongjiang Academy of Agricultural Sciences, is engaged in genetic breeding of edible beans for stress resistance (especially environmental interaction).
Zhengong Yin
Yin Zhengong, Associate professor, Istitute of Crop Resources, Heilongjiang Academy of Agricultural Sciences.
Guangdong Yang
Yang Guangdong, Professor, Istitute of Crop Resources, Heilongjiang Academy of Agricultural Sciences.
Shuhong Wei
Wei Shuhong, Professor, Istitute of Crop Resources, Heilongjiang Academy of Agricultural Sciences.
Yifan Guo
Guo Yifan, Associate professor, Istitute of Crop Resources, Heilongjiang Academy of Agricultural Sciences.
Wei Zhang
Wei Zhang, Associate professor, Istitute of Crop Resources, Heilongjiang Academy of Agricultural Sciences.
Qiang Wang
Wang Qiang, Professor, Institute of Crop Resources, Heilongjiang Academy of Agricultural Sciences, is engaged in genetic breeding and resource innovation of edible beans.
References
- Bailey TL, Johnson J, Grant CE, Noble WS. 2015. The MEME suite. Nucleic Acids Res. 43:W39–W4W39.
- Boubakri H, Chihaoui SA, Najjar E, Barhoumi F, Jebara M. 2022a. Comprehensive identification, evolutionary patterns and the divergent response of PRX genes in Phaseolus vulgaris under biotic and abiotic interactions. 3 Biotech. 12(8):175.
- Boubakri H, Chihaoui SA, Najjar E, Gargouri M, Barhoumi F, Jebara M. 2021. Genome-wide analysis and expression profiling of H-type Trx family in Phaseolus vulgaris revealed distinctive isoforms associated with symbiotic N2-fixing performance and abiotic stress response. J Plant Physiol. 260:153410.
- Boubakri H, Najjar E, Jihnaoui N, Chihaoui S, Barhoumi F, Jebara M. 2022b. Genome-wide identification, characterization and expression analysis of glutaredoxin gene family (Grxs) in Phaseolus vulgaris. Gene. 833:146591.
- Buruchara R, Chirwa R, Sperling L, Mukankusi C, Rubyogo JC, Mutonhi R, Abang MM. 2011. Development and delivery of bean varieties in Africa: the Pan-Africa Bean Research Alliance (PABRA) model. Afr Crop Sci J. 19:227–245.
- Cayrol C, Lacroix C, Mathe C, Ecochard V, Ceribelli M, Loreau E, Lazar V, Dessen P, Mantovani R, Aguilar L, et al. 2007. The THAP-zinc finger protein THAP1 regulates endothelial cell proliferation through modulation of pRB/E2F cell-cycle target genes. Blood. 109:584–594.
- Chen C, Chen H, Zhang Y, Thomas HR, Frank MH, He Y, Xia R. 2020. TBtools: an integrative toolkit developed for interactive analyses of big biological data. Mol Plant. 13:1194–1202.
- Colangelo EP, Guerinot ML. 2004. The essential basic helix-loop-helix protein FIT1 is required for the iron deficiency response. Plant Cell. 16:3400–3412.
- Ding S, Zhang B, Qin F. 2015. Arabidopsis RZFP34/CHYR1, a Ubiquitin E3 Ligase. Regulates stomatal movement and drought tolerance via SnRK. 2:6-mediated phosphorylation. Plant cell. 27:3228-3244.
- Du Y, Li W, Geng J, Li S, Zhang W, Liu X, Hu M, Zhang Z, Fan Y, Yuan X, Du J, Zhao Q. 2022a. Genome-wide identification of the SWEET gene family in Phaseolus vulgaris L. and their patterns of expression under abiotic stress. J Plant Interact. 17:390–403.
- Du Y, Zhao Q, Li W, Geng J, Li S, Yuan X, Gu Y, Zhong J, Zhang Y, Du J. 2022b. Genome-wide identification of the LBD transcription factor genes in common bean (Phaseolus vulgaris L.) and expression analysis under different abiotic stresses. J Plant Interact. 17:731–743.
- Feller A, Machemer K, Braun EL, Grotewold E. 2011. Evolutionary and comparative analysis of MYB and bHLH plant transcription factors. Plant J. 66:94–116.
- Finn RD, Mistry J, Tate J, Coggill P, Heger A, Pollington JE, Gavin OL, Gunasekaran P, Ceric G, Forslund K, et al. 2010. The Pfam protein families database. Nucleic Acids Res. 38:D211–D222.
- Goodstein DM, Shu S, Howson R, Neupane R, Hayes RD, Fazo J, Mitros T, Dirks W, Hellsten U, Putnam N, et al. 2012. Phytozome: a comparative platform for green plant genomics. Nucleic Acids Res. 40:D1178–D1186.
- Guo AY, Zhu QH, Chen X, Luo JC. 2007. [GSDS: a gene structure display server]. Yi chuan = Hereditas. 29:1023–1026.
- Hayford RK, Ligaba-Osena A, Subramani M, Brown A, Melmaiee K, Hossain K, Kalavacharla VK. 2017. Characterization and expression analysis of common bean Histone Deacetylase 6 during development and cold stress response. Int J Genomics. 2017:1–12.
- He F, Wang HL, Li HG, Su Y, Li S, Yang Y, Feng CH, Yin W, Xia X. 2018. PeCHYR1, a ubiquitin E3 ligase from Populus euphratica, enhances drought tolerance via ABA-induced stomatal closure by ROS production in Populus. Plant Biotechnol J. 16:1514–1528.
- Hindt MN, Akmakjian GZ, Pivarski KL, Punshon T, Baxter I, Salt DE, Guerinot ML. 2017. BRUTUS and its paralogs, BTS LIKE1 and BTS LIKE2, encode important negative regulators of the iron deficiency response in Arabidopsis thaliana. Metallomics. 9:876–890.
- Hsu KH, Liu CC, Wu SJ, Kuo YY, Lu CA, Wu CR, Lian PJ, Hong CY, Ke YT, Huang JH, et al. 2014. Expression of a gene encoding a rice RING zinc-finger protein, OsRZFP34, enhances stomata opening. Plant Mol Biol. 86:125–137.
- Jia B, Wang Y, Zhang D, Li W, Cui H, Jin J, Cai X, Shen Y, Wu S, Guo Y, et al. 2021. Genome-wide identification, characterization and expression analysis of soybean CHYR gene family. Int J Mol Sci. 22(22):12192.
- Kitts PA, Church DM, Thibaud-Nissen F, Choi J, Hem V, Sapojnikov V, Smith RG, Tatusova T, Xiang C, Zherikov A, et al. 2016. Assembly: a resource for assembled genomes at NCBI. Nucleic Acids Res. 44:D73–D80.
- Kobayashi T. 2019. Understanding the complexity of iron sensing and signaling cascades in plants. Plant Cell Physiol. 60:1440–1446.
- Krzywinski M, Schein J, Birol I, Connors J, Gascoyne R, Horsman D, Jones SJ, Marra MA. 2009. Circos: an information aesthetic for comparative genomics. Genome Res. 19:1639–1645.
- Kumar S, Stecher G, Li M, Knyaz C, Tamura K. 2018. MEGA x: molecular evolutionary genetics analysis across computing platforms. Mol Biol Evol. 35:1547–1549.
- Lee HG, Kim J, Suh MC, Seo PJ. 2017. The MIEL1 E3 ubiquitin ligase negatively regulates cuticular wax biosynthesis in Arabidopsis stems. Plant Cell Physiol. 58:2040.
- Lee HG, Seo PJ. 2016. The Arabidopsis MIEL1 E3 ligase negatively regulates ABA signalling by promoting protein turnover of MYB96. Nat Commun. 7:12525.
- Lee JH, Kim WT. 2011. Regulation of abiotic stress signal transduction by E3 ubiquitin ligases in Arabidopsis. Mol Cells. 31:201–208.
- Leng G, Hall J. 2019. Crop yield sensitivity of global major agricultural countries to droughts and the projected changes in the future. Sci Total Environ. 654:811–821.
- Lescot M, Déhais P, Thijs G, Marchal K, Moreau Y, Van de Peer Y, Rouzé P, Rombauts S. 2002. PlantCARE, a database of plant cis-acting regulatory elements and a portal to tools for in silico analysis of promoter sequences. Nucleic Acids Res. 30:325–327.
- Li W, Lan P. 2015. Genome-wide analysis of overlapping genes regulated by iron deficiency and phosphate starvation reveals new interactions in Arabidopsis roots. BMC Res Notes. 8:555.
- Liu H, Yang W, Zhao X, Kang G, Li N, Xu H. 2022. Genome-wide analysis and functional characterization of CHYR gene family associated with abiotic stress tolerance in bread wheat (Triticum aestivum L.). BMC Plant Biol. 22:204.
- Livak KJ, Schmittgen TD. 2001. Analysis of relative gene expression data using real-time quantitative PCR and the 2(-Delta Delta C(T)) Method. Methods (San Diego. Calif.). 25:402–408.
- Marino D, Froidure S, Canonne J, Ben Khaled S, Khafif M, Pouzet C, Jauneau A, Roby D, Rivas S. 2013. Arabidopsis ubiquitin ligase MIEL1 mediates degradation of the transcription factor MYB30 weakening plant defence. Nat Commun. 4:1476.
- Matthiadis A, Long TA. 2016. Further insight into BRUTUS domain composition and functionality. Plant Signaling Behav. 11:e1204508.
- Mistry J, Chuguransky S, Williams L, Qureshi M, Salazar GA, Sonnhammer EL, Tosatto SC, Paladin L, Raj S, Richardson LJ. 2021. Pfam: the protein families database in 2021. Nucleic Acids Res. 49:D412–D419.
- Moore RC, Purugganan MD. 2003. The early stages of duplicate gene evolution. Proc Natl Acad Sci. 100:15682–15687.
- Mukankusi C, Raatz B, Nkalubo S, Berhanu F, Binagwa P, Kilango M, Williams M, Enid K, Chirwa R, Beebe S. 2019. Genomics, genetics and breeding of common bean in Africa: a review of tropical legume project. Plant breeding = Zeitschrift fur Pflanzenzuchtung. 138:401–414.
- Preacher KJ, Hayes AF. 2004. SPSS and SAS procedures for estimating indirect effects in simple mediation models. Behav Res Methods Instrum Comput. 36(4):717–731. doi:10.3758/BF03206553
- Rodríguez-Celma J, Chou H, Kobayashi T, Long TA, Balk J. 2019a. Hemerythrin E3 ubiquitin ligases as negative regulators of iron homeostasis in plants. Front Plant Sci. 10:98.
- Singh VK, Mangalam AK, Dwivedi S, Naik S. 1998. Primer premier: program for design of degenerate primers from a protein sequence. BioTechniques. 24:318–319.
- Smalle J, Vierstra RD. 2004. The ubiquitin 26S proteasome proteolytic pathway. Annu Rev Plant Biol. 55:555–590.
- Wang Y, Tang H, Debarry JD, Tan X, Li J, Wang X, Lee TH, Jin H, Marler B, Guo H, et al. 2012. MCScanx: a toolkit for detection and evolutionary analysis of gene synteny and collinearity. Nucleic Acids Res. 40:e49.
- Xia Z, Liu Q, Wu J, Ding J. 2012. ZmRFP1, the putative ortholog of SDIR1, encodes a RING-H2 E3 ubiquitin ligase and responds to drought stress in an ABA-dependent manner in maize. Gene. 495:146–153.
- Xia Z, Su X, Liu J, Wang M. 2013. The RING-H2 finger gene 1 (RHF1) encodes an E3 ubiquitin ligase and participates in drought stress response in Nicotiana tabacum. Genetica. 141:11–21.
- Zhang Q, Geng J, Du Y, Zhao Q, Zhang W, Fang Q, Yin Z, Li J, Yuan X, Fan Y, et al. 2022. Heat shock transcription factor (Hsf) gene family in common bean (Phaseolus vulgaris): genome-wide identification, phylogeny, evolutionary expansion and expression analyses at the sprout stage under abiotic stress. BMC Plant Biol. 22:33.
- Zhang Q, Li M, Xia CY, Zhang WJ, Yin ZG, Zhang YL, Fang QX, Liu YC, Zhang MY, Zhang WH. 2021. Transcriptome-based analysis of salt-related genes during the sprout stage of common bean (Phaseolus vulgaris) under salt stress conditions. Biotechnol Biotechnol Equip. 35:1086–1098.
- Zhang Q, Zhang W-j, Yin Z-g, Li W-j, Xia C-Y, Sun H-Y, Yang Y-M, Wu H-B, Zhang S, Zhao H-h. 2022. Genome-wide identification reveals the potential functions of the bZIP gene family in common bean (Phaseolus vulgaris) in response to salt stress during the sprouting stage. J Plant Growth Regul. 41:3075–3090
- Zhang Q, Zhang WJ, Yin ZG, Li WJ, Zhao HH, Zhang S, Zhuang L, Wang YX, Zhang WH, Du JD. 2020. Genome- and transcriptome-wide identification of C3Hs in common bean (Phaseolus vulgaris L.) and structural and expression-based analyses of their functions during the sprout stage under salt-stress conditions. Front Genet. 11:564607.