
ABSTRACT
Tobacco is a special commercial crop that prefers potassium but not chlorine, and excessive chloride (Cl–) accumulation can cause toxicity. Here, we revealed that the structural characteristics of chloroplasts in tobacco leaves were significantly destroyed under high Cl– salinity, but not mitochondria. Large differences in leaf structure, MDA content, and antioxidant enzyme activities were observed for the treatment with highest chloride accumulation at the 14th day. Moreover, RNA-seq analysis of tobacco leaves exposed to high Cl– salinity revealed global changes in gene transcription levels. A total of 1360 DEGs involved in cell wall, lipid, starch, and secondary metabolism processes were unevenly distributed on chromosomes, and were mainly enriched for starch and sucrose metabolism, phenylpropanoid biosynthesis, ribosome and ribosome biogenesis, protein processing in the endoplasmic reticulum, and plant hormone signal transduction pathways. Overall, our study provides valuable insights for further research on the mechanism underlying Cl– salinity and salt-tolerant tobacco development.
1. Introduction
Chlorine (Cl−) is the dominant form of the halogen element chlorine in soils, which is one of the 13 essential mineral nutrient elements for plant growth and development (Uchida Citation2000). Traditionally, Cl− has been classified as a micronutrient, as it is required by all plants in small quantities, typically being required in concentrations of less than 50–100 μM in nutrient medium for healthy growth (Broyer et al. Citation1954; Broadley et al. Citation2012). The average Cl− content in plants varies greatly from 2.0 to 20.0 mg·g−1 DW (Xu et al. Citation1999; Broadley et al. Citation2012; Colmenero-Flores et al. Citation2019) and can accumulate up to 50 mg·g−1 DW in the tobacco plant (Nicotiana tabacum) when treated with 5 mM Cl− (Franco-Navarro et al. Citation2016). Moreover, recent reports have indicated that Cl− is considered a beneficial macronutrient when it accumulates to macronutrient levels in tobacco plant tissues (Raven Citation2016; Wege et al. Citation2017; Colmenero-Flores et al. Citation2019). However, the tissue concentration of Cl− can gradually increase beyond required levels, leading to toxicity in some specific field environments, such as saline-alkali land and regions with chloride overfertilization (Shelke et al. Citation2019). Despite this, little is known about the cytological and physiological effects of treatment with different Cl− concentrations in tobacco.
Cl− plays two major roles in plant nutrition: (i) as an elementary cofactor or essential micronutrient with irreplaceable functions, and (ii) as a non-assimilating, highly mobile anion, or a quantitatively and qualitatively preferred osmoticum in plants that cannot be replaced by other anionic macronutrients. As an essential micronutrient, Cl− is involved in the chemical breakdown of water in the sun and the activation of several enzyme systems. Specifically, Cl− ions are an essential cofactor for the oxygen evolution of photosystem II (PSII) in the chloroplast, stabilizing the water splitting system at the oxidizing site of PSII (Homann Citation1987; Pokhrel et al. Citation2011), and regulating the activities of enzymes such as asparagine synthetase, amylases, and the tonoplast-type H+-pumping ATPase (Rognes Citation1980; Churchill and Sze Citation1984; Metzler Citation2003; Raven Citation2016).
In addition to the above mentioned essential micronutrient functions, Cl− is also involved in regulating cell osmolarity as an osmoticum and maintaining the electrical charge balance of cations as a non-assimilating highly mobile anion (Flowers Citation1988; Marschner Citation2012; Rosales et al. Citation2020). As the preferred osmoticum in plants, Cl− is highly efficient in enhancing cell osmolarity, water accumulation, and turgor, which further drive forward plant cell elongation and growth (Yamagami et al. Citation2004; Burdach et al. Citation2014; Colmenero-Flores et al. Citation2019). Furthermore, Cl− ions also play key roles in regulating photosynthetic electron transport and photoprotective mechanisms in chloroplasts (Herdean et al. Citation2016a; Herdean et al. Citation2016b). Accordingly, the relationship between Cl− and mitochondria is also worth exploring, which requires further elucidation.
Although Cl− has been adopted as a beneficial macronutrient, excessive Cl− influx into plant cells inhibits mineral uptake and results in nutrient imbalance and ion toxicity (Chen et al. Citation2007; Wu et al. Citation2013). Under high Cl− conditions, ionic imbalances caused by Cl− accumulation result in enhanced lipid peroxidation, membrane damage, and increased production of reactive oxygen species (ROS) such as singlet oxygen, superoxide radicals (O2−), hydrogen peroxide (H2O2), and hydroxyl radicals (OH−), eventually inhibiting plant growth and development (Wang et al. Citation2003). In line with the vital roles of Cl− in the chloroplast, various injuries occur with increasing Cl− concentration, including a reduced photosynthetic capacity owing to nonstomatal effects, impaired chlorophyll synthesis, enhanced chlorophyll degradation, and a decreased quantum yield of PSII electron transport, which is associated with both photochemical quenching and the efficiency of excitation energy capture (Guo et al. Citation2014). Furthermore, regarding the molecular mechanisms of tobacco in response to salt stress, previous studies have highlighted that tobacco can adapt to salt stress via various strategies, including cellular ion transport, osmotic regulation, antioxidation, signal transduction, expression regulation, and protection of cells from stress damage (Sun et al. Citation2020). However, little is known about transcriptional regulation related to Cl− toxicity under salt stress conditions in plants.
Tobacco is a special commercial crop that prefers potassium but not chlorine, because potassium can increase the burning property and quality of tobacco, while superfluous chlorine can produce flame retardant effect and reduce tobacco quality. Therefore, we selected different concentrations of KCl to treat tobacco seedlings, aiming to (i) observe morphological changes in chloroplasts and mitochondria cellular structures in tobacco leaves under high Cl− accumulation, (ii) analyze the effects of high Cl− accumulation on the changes of physiological index including MDA, SOD, POD, and CAT, and (iii) investigate the global transcriptome changes and molecular mechanisms in response to high Cl− accumulation. The results of this study will enable us to elucidate the physiological and transcriptomic profiles of tobacco seedling leaves in response to high Cl− accumulation and thereby provide a valuable theoretical basis for further research on the molecular mechanisms underlying tolerance and adaptation to high Cl− accumulation in plants.
2. Materials and methods
2.1. Plant material and experimental design
This study employed Yunyan 87 (Nicotiana tabacum L.), one of the most widely cultivated tobacco varieties in China, developed by the Yunnan Tobacco Academy of Agricultural Sciences and the China Tobacco Breeding Research (South) Center.
The healthy seeds of Yunyan 87 were surface-sterilized in a 10% H2O2 solution, washed using sterilized water five to six times, and subsequently transferred to Petri dishes with moist germination paper. The germinated seeds were grown in plastic trays filled with vermiculite and cultured using the Hoagland nutrient solution in a greenhouse under a 16-h (day): 8-h (night) photoperiod with a temperature of 23 ± 2°C and a humidity of 65 ± 5%. Forty-day-old seedlings that had grown to four-leaves stage without diseases or pests were used for treatments with different Cl− concentrations. Fifty-four seedlings were used in each treatment for 6 replications, and 9 seedlings per replicate were planted in an environmentally controlled greenhouse. The solution was replaced after every 3 days and aerated for 1 h at each morning and evening for every day. The details of experimental treatments were as follows: control treatments (CK) were received only Hoagland nutrient solution; and different treatments of KCl were supplemented progressively until reaching the final concentration to 15 mg/L (T1), 30 mg/L (T2), 60 mg/L (T3), and 120 mg/L (T4).
All plants were collected for leaf cytological observations and enzyme activity measurements at the 7th, 14th, and 21st days after treatment.
2.2. Anatomical characteristics of chloroplasts and mitochondria
The third leaf from the bottom of each seedling was collected for electron microscopy observation at the 21st day after treatment. Initially, a cut (2 mm × 2 mm) in the middle of the blade away from the main vein was selected and soaked in a 4.0% glutaraldehyde solution at 4°C for over 24 h. After that, samples were rinsed in 0.1 M PBS buffer (pH = 6.8) for four times with 10 min long each time, and then fixed in 1% osmic acid for 2 h. Subsequently, the processed samples were washed using a 0.1 M phosphate buffer solution and dehydrated using a series of gradient alcohol solutions (30%, 50%, 70%, 80%, and 90%) for 15 min each time. The resulting sample was dehydrated in 100% alcohol for three times with 30 min each time, which was subsequently replaced with 100% acetone. Finally, the samples were embedded in epoxy resin 812 and sliced using an ultramicrotome (LEICA EM UC7). After dyeing with aqueous uranyl acetate and lead citrate, the slices were observed and photographed using a transmission electron microscope as described in the previous study (Ma et al. Citation2019).
2.3. Determination of MDA, SOD, POD, and CAT concentration
The concentrations of malondialdehyde (MDA), superoxide dismutase (SOD), peroxidase (POD), and catalase (CAT) were determined according to the manufacturer's protocols in the reagent kits (Suzhou Comin Biotechnology Co. Ltd.). The tissue from the last third leaf from the bottom in each seedling was frozen in liquid nitrogen, ground to powder, and then rapidly transferred to 150 mM phosphate buffer (pH = 7.0). The homogenate was centrifuged (8000 r/min, 10 min, 4°C), and the resulting supernatant was used for the MDA, SOD, POD, and CAT assays. Each sample was analyzed in three independent technical replicates, and each treatment was performed in three biological replicates. Values are estimated in units of SOD, POD, and CAT activity per gram of fresh tissue weight.
2.4. RNA extraction, cDNA library construction, and RNA sequencing
Total RNA was extracted from approximately 1 g of tobacco leaves after 14 days of treatment with T0 (Hoagland nutrient solution only) and T3 (60 mg/L KCl with Hoagland nutrient solution) using the RNAprep Pure Plant Kit (DP441) (TIANGEN Biotechnology, Beijing, China). All samples were analyzed using three biological replicates. The RNA concentration and integrity were determined using a NanoDrop 2000 spectrophotometer (Thermo Scientific, Waltham, MA, USA) and an Agilent 2100 Bioanalyzer (Agilent Technologies, Santa Clara, CA, USA), respectively.
After quantification, library construction and sequencing were performed by Wuhan Seq Health Tech Co., Ltd. (Wuhan, China). Briefly, the first strand was generated through random hexamer-primed reverse transcription. Second-strand cDNA was synthesized using buffer, dNTPs, RNase H, and DNA polymerase I. Finally, the samples were sequenced using the paired-end (PE) read method on the Illumina HiSeq 2000 platform, following the manufacturer's instructions. About 8 Gb data was obtained for each sample.
2.5. Transcriptome analysis
Raw data were preliminarily processed using Trimmomatic (Bolger et al. Citation2014), and clean reads were obtained after filtering low-quality reads. Qualified reads were mapped to the reference genome Nitab_v1.0_2017 (https://solgenomics.net/organism/Nicotiana_tabacum/genome) using bowtie2 (Langdon Citation2015; Edwards et al. Citation2017). The read count of each gene was calculated using HTSeq (Anders et al. Citation2015), and the FPKM value for each gene was determined using Cufflinks (Trapnell et al. Citation2012).
Differentially expressed genes (DEGs) between the two samples were analyzed using the DESeq package in R environment (Love et al. Citation2014). The cutoff for significant differential expression was set at a threshold of false discovery rate (FDR) < 0.05 and |log2 (fold change)| > 1. Based on the Wallenius non-central hypergeometric distribution, GO enrichment and KEGG pathway analyses of DEGs were performed using the clusterProfiler R package (Yu et al. Citation2012). The MapMan tool (http://MapMan.gabipd.org) was used to generate a graphical overview of the pathways involving the DEGs.
2.6. qRT-PCR validation
To validate the RNA-Seq results, qRT-PCR was performed using three independent biological replicates and three technical replicates. Gene-specific primers were designed using Primer 5.0 software and are listed in Table S4. cDNA was synthesized using a HiScript III 1st Strand cDNA synthesis kit, and qRT-PCR was performed using ChamQ SYBR qPCR Master Mix (Vazyme Biotech Co. Ltd., Nanjing, China) on a LightCycler 480 instrument II. The expression levels were calculated using the 2−ΔΔCt method, with the reference gene NtEF-1α serving as an internal control (Livak and Schmittgen Citation2001; Schmidt and Delaney Citation2010).
2.7. Statistical analysis
A two-way analysis of variance (ANOVA) was performed using SPSS software (version 25.0; IBM Inc., Chicago, IL, USA). Statistical significance was set at P < 0.05. All experimental data were obtained in triplicate and are expressed as the mean ± standard deviation (SD).
3. Results
3.1. Changes in chloroplasts and mitochondrial structures in tobacco leaves exposed to chloride salinity
After Cl– salinity treatment, obvious symptoms were observed in tobacco leaves during the growth period, particularly in the chloroplasts and mitochondrial structures. Under control (CK) conditions, the chloroplasts were evenly and neatly arranged and almost all were close to the cell wall. Furthermore, it was observed that each organelle in the cell and membrane systems was relatively complete. The arrangement of the grana lamellae was clearly visible, and the thylakoid lamellae were neatly stacked. Moreover, the chloroplast structures under the T1 and T2 conditions exhibited characteristics similar to that under CK conditions (). However, under T3 and T4 conditions, the distribution of chloroplasts was disordered. Additionally, under T3 conditions, chloroplasts exhibited a flat structure with a long axis not close to the cell wall, whereas under T4, the chloroplasts were stacked (). As the Cl– concentration increased, the chloroplast morphology gradually expanded, with increased osmiophilic granules on the surface, while simultaneously, the thylakoid lamella gradually decreased with partial fusion and disintegration. Furthermore, the number of osmophilic granules in the chloroplasts was lower under T3 compared to T4, whereas the number of thylakoid lamellae was relatively higher ().
Figure 1. Changes in the physiological structure of tobacco leaf cells after 14 days of growth in Hoagland nutrient solution under different chloride (Cl−) salinity treatments. CK: control treatment; T1: 15 mg/L Cl− salinity; T2: 30 mg/L Cl− salinity; T3: 60 mg/L Cl− salinity; T4: 120 mg/L Cl− salinity. Abbreviations: Ch, chloroplasts; Cw, cell wall; Cy, cytoplasm; Cm, cell membrane; St, starch granules; Mi, mitochondria; Th, thylakoid; OG, osmiophilic granules.
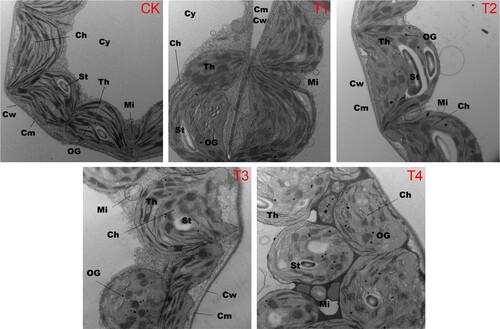
As providers of cellular energy, mitochondria underwent a series of changes with the addition of Cl– salinity. The mitochondria exhibited regular spherical or oval structures dispersed throughout the cytoplasm. When the Cl– concentration reached its maximum value (T4) in this study, the mitochondria remained full, with an abundant matrix, a complete double-layer membrane structure, and a ridge formed by the inner membrane depression. Under the T3 and T4 conditions, the mitochondria in tobacco leaves were compressed owing to the influence of chloroplasts; however, no obvious changes in structural characteristics were observed compared to CK, T1, and T2 ().
3.2. Chloride salinity increased MDA content and regulated antioxidant activity
The MDA content in tobacco leaves gradually increased with the supplement of Cl– salinity and a longer culture duration after treatment. Compared to the control, the growth percentages at the 7th, 14th, and 21st days after treatment under T4 conditions were 4.94%, 33.67%, and 42.77%, respectively. Furthermore, there was no significant difference in MDA content between T3 and T4 across the three different treatment periods, except at the 14th day after treatment. A similar phenomenon was also observed under CK, T1, and T2 across the three treatment periods. As the Cl– concentration increased, the MDA content exhibited a gradually increasing trend over time. At the 21st day after treatment, the MDA content under CK, T1, T2, T3, and T4 increased by 11.76%, 13.70%, 17.00%, 17.08%, and 27.71%, respectively, compared to that at the 7th day after treatment (A).
Figure 2. Physiological parameters of tobacco leaves grown in Hoagland nutrient solution under different Cl− salinity conditions after 7, 14, and 21 days. (A) Malondialdehyde (MDA) content; (B) Superoxide dismutase (SOD) activity; (C) Peroxidase (POD) activity; and (D) Catalase (CAT) activity. CK: control treatment; T1: 15 mg/L Cl− salinity; T2: 30 mg/L Cl− salinity; T3: 60 mg/L Cl− salinity; T4: 120 mg/L Cl− salinity. Data are shown as the means ± SD (n = 3), with different letters indicating significant differences at P < 0.05 according to the LSD test.
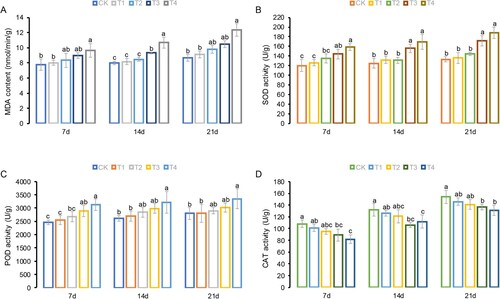
The activities of antioxidant enzymes, including SOD, POD, and CAT, in tobacco leaves were also affected by Cl– salinity. Specifically, higher Cl– salinity increased the activities of POD and SOD but decreased that of CAT (B–D). At the 21st day after treatment, under T4, Cl– salinity increased POD and SOD activities by 19.96% and 31.35%, respectively, compared to CK and reduced CAT by 14.94%. As the culture duration increased, the activities of POD, SOD, and CAT in the tobacco leaves constantly accelerated. In particular, changes in the activities of POD, SOD, and CAT under the CK, T1, and T2 treatments were relatively minor, whereas changes in activity under the T3 and T4 treatments were substantially greater. In addition, during the three growth stages, there were significant differences in POD, SOD, and CAT activities between T3/T4 and CK, whereas no significant differences were observed among CK, T1, and T2.
3.3. Summary of RNA-Seq data
A total of six samples refer to two treatments (CK and T4, the treatment with highest chloride accumulation) and three biological replicates at the 14th day after treatment, were prepared for RNA-seq owing to large differences in leaf structure, MDA content, and antioxidant enzyme activities. In total, 51.58 gigabytes (Gb) of raw reads were generated, with an average of 8.60 Gb for each sequenced sample (see Table S1). After filtering the low-quality reads, approximately 7.36 Gb of clean reads were obtained per sample. The Q20 and Q30 for clean data were above 99% and 96%, respectively, indicating that the RNA-seq data was reliable. Regarding the base distribution, the GC content for each sample was approximately 43.58%. When aligning clean reads to the tobacco reference genome Nitab_v1.0_2017, an average of 87.53% of clean reads were successfully mapped.
A total of 26,981 unique genes were identified and mapped to 24 tobacco chromosomes. Remarkably, the highest number of genes was distributed on chromosome Nt17, followed by Nt19. Additionally, some genes were specifically expressed in plants that had received specific treatments, with 1046 genes (3.88%) in CK samples and 1093 genes (4.05%) in T3 samples. To investigate the reproducibility of biological replicates for each treatment, a correlation analysis was performed based on the fragments per kilobase per million mapped reads (FPKM) values of global genes across all RNA-seq data. High reproducibility was observed, with correlation coefficients ranging from 0.87 to 0.98. In addition, the hierarchical cluster diagram and principal component analysis (PCA) revealed that there were two distinct clusters under different treatments CK and T3 (see Figure S1A), and the replicates of each treatment clustered together (see Figure S1B), indicating the high quality and reliability of the RNA-seq data.
3.4. Differentially expressed genes in response to chloride salinity
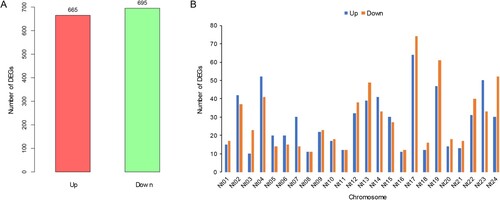
To elucidate the genes and pathways involved in high chloride accumulation, differentially expressed genes (DEGs) were screened using the following criteria: false discovery rate (FDR) < 0.05 and |log2 fold change| > 1. In comparison with CK, a total of 1360 DEGs were identified in response to high chloride accumulation, accounting for approximately 5% of total genes. Of these, 665 were up-regulated and 695 were down-regulated (A). Similar to the total gene distribution, the highest numbers of up-regulated and down-regulated genes were mapped to chromosomes Nt17 and Nt19. Specifically, there were 138 (64 up-regulated and 74 down-regulated) and 108 (47 up-regulated and 61 down-regulated) DEGs on Nt17 and Nt19, respectively. On most chromosomes, the number of up-regulated genes was lower than that of down-regulated genes, specifically chromosomes Nt01, Nt03, Nt09, Nt10, Nt12, Nt13, Nt16, Nt17, Nt18, Nt19, Nt20, Nt21, Nt22, and Nt24. With the exception of Nt08 and Nt11, the number of up-regulated genes on the remaining chromosomes was higher than the number of down-regulated genes (B).
Figure 3. The number (A) and distribution (B) of differentially expressed genes (DEGs) on chromosomes.
3.5. GO enrichment and KEGG analysis
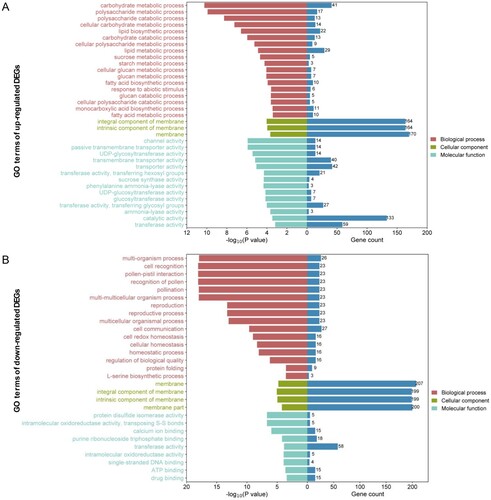
To explore the putative regulatory mechanisms of gene expression associated with high chloride accumulation, gene ontology (GO) and Kyoto Encyclopedia of Genes and Genomes (KEGG) enrichment analyses were conducted to functionally annotate the DEGs and identify regulatory pathways. GO analysis revealed that the DEGs were significantly enriched in 64 GO terms. Specifically, there were 18, 3, and 14 up-regulated DEGs and 16, 4, and 14 down-regulated DEGs associated with biological processes (BP), cellular components (CC), and molecular functions (MF), respectively (, Table S2). Among them, the up-regulated and down-regulated DEGs shared common CC terms, including membrane (GO:0016020), integral component of membrane (GO:0016021), intrinsic component of membrane (GO:0031224), and the common BP term of transferase activity (GO:0016740). For up-regulated DEGs, the enriched BP GO terms included metabolic processes involving carbohydrates, polysaccharides, lipids, sucrose, starch, glucan, and fatty acid and biosynthetic processes involving fatty acid and monocarboxylic acid and response to abiotic stimuli. Enriched MF GO terms were associated with channel, transporter, catalytic, sugar synthase, and phenylalanine ammonia-lyase activities (A). However, for the down-regulated DEGs, the enriched BP GO terms included multi-organism processes, cell recognition or communication, reproduction, cell homeostasis, protein folding, and L-serine biosynthetic processes, whereas the MF GO terms were enriched for binding ATP, calcium ion, purine ribonucleoside triphosphate, single-stranded DNA, and oxidoreductase activity (B).
Figure 4. The Gene Ontology (GO) enrichment analysis of up-regulated (A) and down-regulated (B) DEGs. The horizontal axis represents the –log10 (P value) and number of genes of terms related to biological processes, cellular components, and molecular functions. The vertical axis shows the GO term names. The number of genes for each term is shown on the right in blue on the histogram.
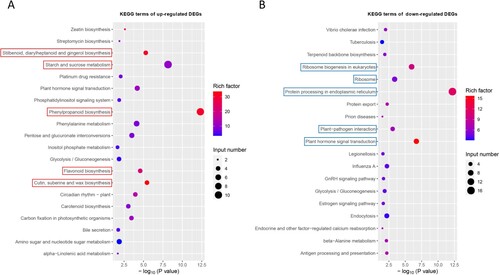
In the KEGG enrichment analysis, we found that the up-regulated and down-regulated DEGs were enriched in different pathways (, Table S3). The top five pathways for the up-regulated genes were stilbenoid, diarylheptanoid, and gingerol biosynthesis (ko00945); starch and sucrose metabolism (ko00500); phenylpropanoid biosynthesis (ko00940); flavonoid biosynthesis (ko00941); and cutin, suberin, and wax biosynthesis (ko00073) (A). In contrast, the top five enriched pathways for the down-regulated genes were ribosome biogenesis in eukaryotes (ko03008), ribosome (ko03010), protein processing in the endoplasmic reticulum (ko04141), plant–pathogen interaction (ko04626), and plant hormone signal transduction (ko04075) (B). In addition, the up-regulated and down-regulated DEGs shared two common KEGG pathways: plant hormone signal transduction (ko04075) and glycolysis/gluconeogenesis (ko00010).
Figure 5. The Kyoto Encyclopedia of Genes and Genomes (KEGG) pathway enrichment analysis of up-regulated (A) and down-regulated (B) DEGs. The red and blue rectangle boxes show the top five KEGG pathways based on the –log10 (P value).
3.6. Validation of RNA-seq by qRT-PCR analysis
To estimate the accuracy of the sequencing data, 14 genes, including six up-regulated and eight down-regulated DEGs, were randomly selected and analyzed using quantitative real-time PCR (qRT-PCR). These genes participate in plant hormone signal transduction, phenylalanine metabolism, starch and sucrose metabolism, oxidation–reduction processes, nucleotide binding, and methyltransferase activity. The correlation between the qRT-PCR results and RNA-seq data was reflected by a strong correlation coefficient of 0.9511, demonstrating the reliability and accuracy of the RNA-seq data in the present study (see Figure S2).
4. Discussion
Chloride is an essential nutrient element in tobacco, as it not only participates in cell osmotic regulation and protoplasm protection but also improves tissue water balance, whole-plant water relations, photosynthesis performance, water use efficiency, plant growth, dry biomass, and nitrogen use efficiency when accumulated to macronutrient concentrations (Franco-Navarro et al. Citation2016; Franco-Navarro et al. Citation2019; Maron Citation2019; Rosales et al. Citation2020). However, tobacco is chloride-sensitive; therefore, under high Cl– concentrations, excessive Cl− accumulation in aboveground tissues is detrimental to growth and development and can reduce the quality of tobacco leaves. Previous research has focused on physiological, biochemical, and genetic responses in tobacco plants exposed to 12, 24, and 48 h of Cl− salinity (Wang et al. Citation2020). In this study, we investigated the cytological, physiological, and transcriptomic profiles of tobacco seedling leaves grown in Hoagland's solutions under four different Cl– salinities for 7, 14, and 21 days.
Microstructural changes in leaf cells can clearly reflect the ability of plants to adapt to the environment, especially chloroplasts, the site of photosynthesis in plants, which are the most sensitive to salt (Sáez et al. Citation2012). Previous studies have shown that the critical tissue Cl– concentration for toxicity in chloride-sensitive crops is approximately 4–7 mg/g DW (White and Broadley Citation2001; Wang et al. Citation2020). In this study, chloroplast structures remained relatively intact at a Cl– concentration below 30 mg/L. When the Cl– concentration exceeded 60 mg/L, a gap gradually appeared between chloroplasts and the cell wall. Furthermore, the thylakoid lamellae exhibited local fusion and disintegration when the Cl– concentration reached 120 mg/L (). Moreover, with the increase in Cl– concentration, we observed a gradual increase in osmophilic granules on the chloroplast surface, which was consistent with previous research (Butler and Simon Citation1971; Hameed et al. Citation2021). Because the thylakoid membrane is responsible for chloroplast light energy absorption, transfer, and conversion, an increase in intracellular Cl– can reduce the stacking capacity of thylakoid membranes and the proportion of stacked thylakoid membranes (Yang et al. Citation2020). Moreover, photosynthetic activity and chlorophyll fluorescence parameters are significantly reduced by Cl– salinity (Wang et al. Citation2020; Pan et al. Citation2021). Similarly, the expression of genes related to the photosynthetic machinery in chloroplasts was significantly affected by Cl– salinity (C). In addition, the GO results showed that DEGs were enriched in the membrane (GO:0016020), integral component of the membrane (GO:0016021), and intrinsic component of the membrane (GO:0031224) (), suggesting that Cl– salinity stress had a significant effect on both chloroplast structure and function. For mitochondria, although the morphology was squeezed under high Cl– concentrations, there was no significant difference in the internal structure among the different treatments. However, the genes related to mitochondrial metabolism were differentially expressed (D).
During long-term evolution, plants have established appropriate enzymatic or non-enzymatic antioxidant defense pathways for ROS scavenging under optimal and unfavorable environmental conditions, thereby ensuring a balance between ROS production and elimination (Heiber et al. Citation2007; Das and Roychoudhury Citation2014). Under high Cl– conditions, excessive chlorine accumulation results in ionic imbalances, which increase ROS production (Wang et al. Citation2003; Shelke et al. Citation2019). As the first defense layer against damage from ROS, SOD is located in the chloroplasts, nuclei, mitochondria, and peroxisomes and mainly decomposes superoxide radicals (O2−) to hydrogen peroxide (H2O2). In addition, POD and CAT catalyze excessive H2O2 to reduce free radical damage (Fan et al. Citation2017; Hu et al. Citation2017). In this study, the activities of SOD and POD gradually increased with the increase in Cl– concentration (B and C), indicating that higher chloride accumulation promoted ROS production, thereby leading to increased antioxidant enzyme activity. However, when the Cl– salinity reached 120 mg/L, although the activities of SOD and POD remained at their maximum, ROS accumulation in tobacco leaves exceeded their scavenging capacity. Consequently, the levels of MDA, which is the most widely used indicator of oxidative damage in cells and tissues, also increased to peak values (Grotto et al. Citation2009; Chauhan et al. Citation2022). Moreover, under abiotic stress conditions (i.e. drought, heavy metals, salinity, high/low temperature, and ultraviolet radiation), plants typically increase the synthesis of polyphenols, such as phenolic acids and flavonoids, which help plants scavenge harmful ROS (Du et al. Citation2010; Sharma et al. Citation2019; Wang et al. Citation2020). Similarly, the KEGG results revealed that up-regulated DEGs were significantly enriched in the phenylpropanoid pathway, including phenylalanine metabolism (ko00360), phenylpropanoid biosynthesis (ko00940), and flavonoid biosynthesis (ko00941) (, B, and S3A), which is consistent with the results of previous studies (Wang et al. Citation2020). Additionally, we observed significant changes in the expression levels of genes involved in redox homeostasis under higher chloride accumulation (see Figure S3B).
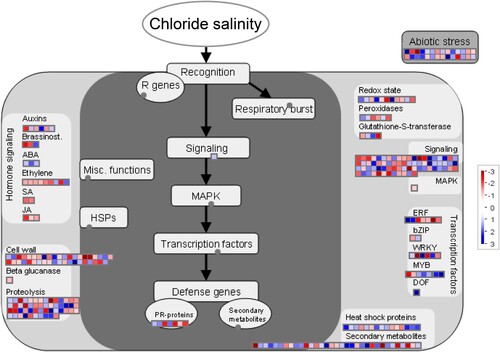
Although advances have been made in elucidating Cl– homeostasis mechanisms in plants using different methods and techniques, the molecular mechanisms underpinning this Cl– salinity in tobacco have been poorly defined until recently. In this study, the comprehensive tool MapMan was used to perform pathway-based analysis to associate biological functions with genes differentially expressed in response to high chloride accumulation ( and ). Consistent with the GO analysis, the DEGs were mainly associated with the cell wall, lipids, secondary metabolism, minor CHO, starch, sucrose, and light reactions (A). Previous research has shown that soluble sugars generated by starch hydrolysis are sensitive to changes in environmental stress and can maintain the osmotic balance, thus resulting in salt tolerance (Kumari et al. Citation2017). In this study, the GO and KEGG results revealed that up-regulated DEGs were significantly enriched in the sucrose metabolic process (GO:0005985), starch metabolic process (GO:0005982), and starch and sucrose metabolism pathway (ko00500) ( and S4A), which was consistent with the findings of a previous study showing that Cl– salinity decreased starch content and increased the content of soluble sugar in tobacco (Wang et al. Citation2020). Moreover, genes related to phytohormone signaling, including auxin, brassinosteroid (BR), abscisic acid (ABA), ethylene (ETH), salicylic acid (SA), and jasmonic acid (JA), were also affected by the Cl– salinity treatment, and the expression of SA and JA signaling genes was significantly up-regulated (, Table S2). Plant hormones play a vital role in mitigating diverse abiotic stresses, including salinity stress (Ryu and Cho Citation2015; Verma et al. Citation2016). In addition, when exposed to Cl– salinity, tobacco may recruit genes for recognition and signal transduction and subsequently induce transcription factor (TFs) (i.e. ERF, bZIP, WRKY, MYB, and DOF) and the mitogen-activated protein kinase (MAPK) pathway ( and S4B). Previous studies have shown that AP2/ERF, WRKY, bZIP, MYB, and DOF transcription factors play important roles in plant responses to salt stress and mediate the diversity of signal transduction processes induced by abiotic stress (Kajal et al. Citation2024). In this study, transcription factors such as ARF, AP2, bZIP, MADS, MYB, NAC, TCP, and SBP were differentially expressed in response to high chloride accumulation after treatment of Cl– salinity (see Figure S4B). Furthermore, MAPK cascades play key roles in the transduction of hormone signals and biotic and abiotic stresses (He et al. Citation2020). Overall, our findings provide new insights into global changes in gene expression patterns in biological pathways responsive to high chloride accumulation with Cl– salinity treatment in tobacco plants, and the DEGs identified in this study can provide alternative target genes for cultivating new salt-tolerant plant varieties using molecular breeding techniques.
Figure 6. MapMan visualization of differential gene expression changes in tobacco leaves induced by chloride salinity. The DEGs for metabolism overview (A), secondary metabolism (B), chloroplast (C), and mitochondrial e-transport (D) were imported and visualized using MapMan. Blue represents the up-regulation of differentially expressed genes (Log2 fold changes) relative to the control under Cl– salinity treatment, and red represents down-regulation.
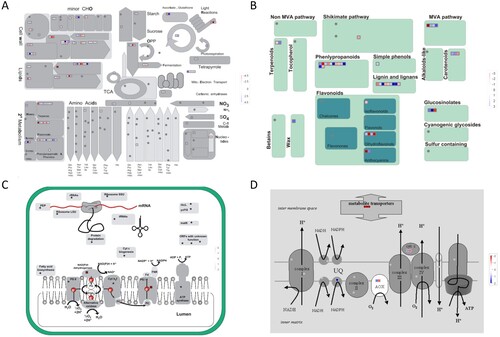
Figure 7. MapMan-based stress pathways of DEGs in response to chloride salinity in tobacco seedling leaves. Blue represents the up-regulation of DEGs (log2 fold changes) relative to the control under Cl– salinity treatment, and red represents down-regulation.
5. Conclusion
Tobacco is an important plant model for studying the mechanisms underlying the effects of high chloride accumulation. In this study, we revealed that the structural characteristics of chloroplasts in tobacco leaves were significantly destroyed under high Cl– salinity conditions, while the mitochondrial structure was relatively less affected. Furthermore, the MDA content and activities of SOD, POD, and CAT were significantly altered by the Cl– salinity treatment. Moreover, RNA-seq analysis of tobacco leaves exposed to Cl– salinity revealed global changes in gene transcription levels. 665 and 695 differentially expressed genes (DEGs) were up-regulated and down-regulated, respectively, compared with control after 14-day exposure to Cl– salinity. Furthermore, the up-regulated DEGs were enriched in starch/sucrose metabolism, phenylpropanoid and flavonoid biosynthesis, whereas the down-regulated DEGs were related to ribosome biogenesis, protein processing in the endoplasmic reticulum, and plant hormone signal transduction. Overall, the obtained results are valuable for further research on the molecular mechanisms underlying the tobacco response to high chloride accumulation and for enhancing salt-tolerant tobacco varieties.
Author contributions
Conceived and designed the experiments: Yunjie Wu, Xiefeng Ye; Performed the experiments: Yunjie Wu, Jialing Lu, Xudong Wang, Yuanyuan Li; Analyzed the data and wrote the original draft: Yunjie Wu, Jialing Lu; Funding acquisition and editing the original draft: Zhiyu Feng, Xiefeng Ye. All authors contributed to the article and agreed to the submitted version of the manuscript.
Supplemental Material
Download MS Excel (33.3 KB)Acknowledgments
This work was supported by the Key Laboratory of Tobacco Cultivation in Tobacco Industry under Grant number 30800665 and Yunnan Fundamental Research Projects under Grant number 202101AU070135.
Disclosure statement
No potential conflict of interest was reported by the author(s).
Data availability statement
All RNA-Seq data were deposited in the NCBI Sequence Read Archive (SRA) under the accession number PRJNA1045972.
Additional information
Funding
References
- Anders S, Pyl PT, Huber W. 2015. HTSeq–a Python framework to work with high-throughput sequencing data. Bioinformatics. 31(2):166–169. doi:10.1093/bioinformatics/btu638.
- Bolger AM, Lohse M, Usadel B. 2014. Trimmomatic: a flexible trimmer for Illumina sequence data. Bioinformatics. 30(15):2114–2120. doi:10.1093/bioinformatics/btu170.
- Broadley M, Brown P, Cakmak I, Rengel Z, Zhao F. 2012. Chapter 7 – Function of nutrients: micronutrients. In: Marschner P, editor. Marschner's mineral nutrition of higher plants (third edition). San Diego: Academic Press; p. 191–248.
- Broyer TC, Carlton AB, Johnson CM, Stout PR. 1954. Chlorine—a micronutrient element for higher plants 1. Plant Physiol. 29(6):526–532. doi:10.1104/pp.29.6.526.
- Burdach Z, Kurtyka R, Siemieniuk A, Karcz W. 2014. Role of chloride ions in the promotion of auxin-induced growth of maize coleoptile segments. Ann Bot. 114(5):1023–1034. doi:10.1093/aob/mcu170.
- Butler RD, Simon EW. 1971. Ultrastructural aspects of senescence in plants. Adv Gerontol Res. 3:73–129.
- Chauhan J, Srivastava JP, Singhal RK, Soufan W, Dadarwal BK, Mishra UN, Anuragi H, Rahman MA, Sakran MI, Brestic M, et al. 2022. Alterations of oxidative stress indicators, antioxidant enzymes, soluble sugars, and amino acids in mustard [Brassica juncea (L.) Czern and Coss.] in response to varying sowing time, and field temperature. Front Plant Sci. 13:875009. doi:10.3389/fpls.2022.875009.
- Chen Z, Cuin TA, Zhou M, Twomey A, Naidu BP, Shabala S. 2007. Compatible solute accumulation and stress-mitigating effects in barley genotypes contrasting in their salt tolerance. J Exp Bot. 58(15–16):4245–4255. doi:10.1093/jxb/erm284.
- Churchill KA, Sze H. 1984. Anion-sensitive, H+-pumping ATPase of oat roots 1: direct effects of Cl−, NO3−, and a disulfonic stilbene. Plant Physiol. 76(2):490–497. doi:10.1104/pp.76.2.490.
- Colmenero-Flores JM, Franco-Navarro JD, Cubero-Font P, Peinado-Torrubia P, Rosales MA. 2019. Chloride as a beneficial macronutrient in higher plants: new roles and regulation. Int J Mol Sci. 20(19):4686. doi:10.3390/ijms20194686.
- Das K, Roychoudhury A. 2014. Reactive oxygen species (ROS) and response of antioxidants as ROS-scavengers during environmental stress in plants. Front Environ Sci. 2:53.
- Du CX, Fan HF, Guo SR, Tezuka T, Li J. 2010. Proteomic analysis of cucumber seedling roots subjected to salt stress. Phytochemistry. 71(13):1450–1459. doi:10.1016/j.phytochem.2010.05.020.
- Edwards KD, Fernandez-Pozo N, Drake-Stowe K, Humphry M, Evans AD, Bombarely A, Allen F, Hurst R, White B, Kernodle SP, et al. 2017. A reference genome for Nicotiana tabacum enables map-based cloning of homeologous loci implicated in nitrogen utilization efficiency. BMC Genomics. 18(1):448. doi:10.1186/s12864-017-3791-6.
- Fan K, Wang H, Xi J, Liu Q, Meng X, Duan D, Gao L, Yan X. 2017. Optimization of Fe3O4 nanozyme activity via single amino acid modification mimicking an enzyme active site. Chem Commun. 53(2):424–427. doi:10.1039/C6CC08542C.
- Flowers TJ. 1988. Chloride as a nutrient and as an osmoticum. Adv Plant Nutr. 3:55–78.
- Franco-Navarro JD, Brumós J, Rosales MA, Cubero-Font P, Talón M, Colmenero-Flores JM. 2016. Chloride regulates leaf cell size and water relations in tobacco plants. J Exp Bot. 67(3):873–891. doi:10.1093/jxb/erv502.
- Franco-Navarro JD, Rosales MA, Cubero-Font P, Calvo P, Álvarez R, Diaz-Espejo A, Colmenero-Flores JM. 2019. Chloride as a macronutrient increases water-use efficiency by anatomically driven reduced stomatal conductance and increased mesophyll diffusion to CO2. Plant J. 99(5):815–831. doi:10.1111/tpj.14423.
- Grotto D, Maria LS, Valentini J, Paniz C, Schmitt G, Garcia SC, Pomblum VJ, Rocha JB, Farina M. 2009. Importance of the lipid peroxidation biomarkers and methodological aspects FOR malondialdehyde quantification. Química Nova. 32(1):169–174. doi:10.1590/S0100-40422009000100032.
- Guo W, Zuo Z, Cheng X, Sun J, Li H, Li L, Qiu J-L. 2014. The chloride channel family gene CLCd negatively regulates pathogen-associated molecular pattern (PAMP)-triggered immunity in Arabidopsis. J Exp Bot. 65(4):1205–1215. doi:10.1093/jxb/ert484.
- Hameed A, Ahmed MZ, Hussain T, Aziz I, Ahmad N, Gul B, Nielsen BL. 2021. Effects of salinity stress on chloroplast structure and function. Cells. 10(8):2023. doi:10.3390/cells10082023.
- He X, Wang C, Wang H, Li L, Wang C. 2020. The function of MAPK cascades in response to various stresses in horticultural plants. Front Plant Sci. 11:952. doi:10.3389/fpls.2020.00952.
- Heiber I, Ströher E, Raatz B, Busse I, Kahmann U, Bevan MW, Dietz KJ, Baier M. 2007. The redox imbalanced mutants of Arabidopsis differentiate signaling pathways for redox regulation of chloroplast antioxidant enzymes. Plant Physiol. 143(4):1774–1788. doi:10.1104/pp.106.093328.
- Herdean A, Nziengui H, Zsiros O, Solymosi K, Garab G, Lundin B, Spetea C. 2016a. The arabidopsis thylakoid chloride channel AtCLCe functions in chloride homeostasis and regulation of photosynthetic electron transport. Front Plant Sci. 7:115. doi:10.3389/fpls.2016.00115.
- Herdean A, Teardo E, Nilsson AK, Pfeil BE, Johansson ON, Ünnep R, Nagy G, Zsiros O, Dana S, Solymosi K, et al. 2016b. A voltage-dependent chloride channel fine-tunes photosynthesis in plants. Nat Commun. 7(1):11654. doi:10.1038/ncomms11654.
- Homann PH. 1987. The relation between the chloride status of the photosynthetic water splitting complex and the inhibitory effectiveness of amines. In: Excitation Energy and Electron Transfer in Photosynthesis: Dedicated to Warren L Butler. p. 351–357. doi:10.1007/978-94-009-3527-3_39.
- Hu M, Korschelt K, Daniel P, Landfester K, Tremel W, Bannwarth MB. 2017. Fibrous nanozyme dressings with catalase-like activity for H2O2 reduction to promote wound healing. ACS Appl Mater Interfaces. 9(43):38024–38031. doi:10.1021/acsami.7b12212.
- Kajal OR, Lohani P, Deshmukh R, Salvi P. 2024. Engineering the transcriptional regulatory network to improve abiotic stress tolerance in crop plants: taming the tough time. J Plant Growth Regul. 43:25–37. doi:10.1007/s00344-023-11057-1.
- Kumari J, Udawat P, Dubey AK, Haque MI, Rathore MS, Jha B. 2017. Overexpression of SbSI-1, a nuclear protein from Salicornia brachiata confers drought and salt stress tolerance and maintains photosynthetic efficiency in transgenic tobacco. Front Plant Sci. 8:1215. doi:10.3389/fpls.2017.01215.
- Langdon WB. 2015. Performance of genetic programming optimised Bowtie2 on genome comparison and analytic testing (GCAT) benchmarks. BioData Min. 8(1):1. doi:10.1186/s13040-014-0034-0.
- Livak KJ, Schmittgen TD. 2001. Analysis of relative gene expression data using real-time quantitative PCR and the 2(-Delta Delta C(T)) Method. Methods. 25(4):402–408. doi:10.1006/meth.2001.1262.
- Love MI, Huber W, Anders S. 2014. Moderated estimation of fold change and dispersion for RNA-seq data with DESeq2. Genome Biol. 15(12):550. doi:10.1186/s13059-014-0550-8.
- Ma J, Wang J, Yao P, Ye H, Yu H, Wang P, Li Y, Ye X. 2019. Effects of salt stress on subcellular structure and physiological and biochemical indexes of flue-cured tobacco leaves. Acta Geologica Sinica - English Edition. 93(5):44–47. doi:10.1111/1755-6724.14240.
- Maron L. 2019. From foe to friend: the role of chloride as a beneficial macronutrient. Plant J. 99(5):813–814. doi:10.1111/tpj.14498.
- Marschner H. 2012. Marschner's mineral nutrition of higher plants. Salt Lake City (UT): Academic Press.
- Metzler DE. 2003. Biochemistry (2 Volume Set): The chemical reactions of living cells, Vol 1. Salt Lake City (UT): Academic Press.
- Pan T, Liu M, Kreslavski VD, Zharmukhamedov SK, Nie C, Yu M, Kuznetsov VV, Allakhverdiev SI, Shabala S. 2021. Non-stomatal limitation of photosynthesis by soil salinity. Crit Rev Environ Sci Technol. 51(8):791–825. doi:10.1080/10643389.2020.1735231.
- Pokhrel R, McConnell IL, Brudvig GW. 2011. Chloride regulation of enzyme turnover: application to the role of chloride in photosystem II. Biochemistry. 50(14):2725–2734. doi:10.1021/bi2000388.
- Raven JA. 2016. Chloride: essential micronutrient and multifunctional beneficial ion. J Exp Bot. 68(3):359–367.
- Rognes SE. 1980. Anion regulation of lupin asparagine synthetase: Chloride activation of the glutamine-utilizing reactions. Phytochemistry. 19(11):2287–2293. doi:10.1016/S0031-9422(00)91013-6.
- Rosales MA, Franco-Navarro JD, Peinado-Torrubia P, Díaz-Rueda P, Álvarez R, Colmenero-Flores JM. 2020. Chloride improves nitrate utilization and NUE in plants. Front Plant Sci. 11:442. doi:10.3389/fpls.2020.00442.
- Ryu H, Cho Y-G. 2015. Plant hormones in salt stress tolerance. J Plant Biol. 58(3):147–155. doi:10.1007/s12374-015-0103-z.
- Sáez PL, Bravo LA, Sáez KL, Sánchez-Olate M, Latsague MI, Ríos DG. 2012. Photosynthetic and leaf anatomical characteristics of Castanea sativa: a comparison between in vitro and nursery plants. Biologia Plantarum. 56(1):15–24. doi:10.1007/s10535-012-0010-9.
- Schmidt GW, Delaney SK. 2010. Stable internal reference genes for normalization of real-time RT-PCR in tobacco (Nicotiana tabacum) during development and abiotic stress. Mol Genet Genomics. 283(3):233–241. doi:10.1007/s00438-010-0511-1.
- Sharma A, Shahzad B, Rehman A, Bhardwaj R, Landi M, Zheng B. 2019. Response of phenylpropanoid pathway and the role of polyphenols in plants under abiotic stress. Molecules. 24(13):2452. doi:10.3390/molecules24132452.
- Shelke D, Nikalje G, Nikam T, Maheshwari P, Punita D, Rao K, Kavi Kishor P, Suprasanna P. 2019. Chloride (Cl−) uptake, transport, and regulation in plant salt tolerance. In: Roychoudhury A, Tripathi D, editors. Molecular plant abiotic stress. Chichester (UK): John Wiley & Sons, Ltd; p. 241–268.
- Sun H, Sun X, Wang H, Ma X. 2020. Advances in salt tolerance molecular mechanism in tobacco plants. Hereditas. 157(1):5. doi:10.1186/s41065-020-00118-0.
- Trapnell C, Roberts A, Goff L, Pertea G, Kim D, Kelley DR, Pimentel H, Salzberg SL, Rinn JL, Pachter L. 2012. Differential gene and transcript expression analysis of RNA-seq experiments with TopHat and Cufflinks. Nat Protoc. 7(3):562–578. doi:10.1038/nprot.2012.016.
- Uchida R. 2000. Essential nutrients for plant growth: nutrient functions and deficiency symptoms. In: Plant Nutrient Management in Hawaii’s soils. Vol. 4. p. 31–55.
- Verma V, Ravindran P, Kumar PP. 2016. Plant hormone-mediated regulation of stress responses. BMC Plant Biol. 16:86. doi:10.1186/s12870-016-0771-y.
- Wang L, Xu JY, Jia W, Chen Z, Xu ZC. 2020. Chloride salinity in a chloride-sensitive plant: Focusing on photosynthesis, hormone synthesis and transduction in tobacco. Plant Physiol Biochem. 153:119–130. doi:10.1016/j.plaphy.2020.05.021.
- Wang W, Vinocur B, Altman A. 2003. Plant responses to drought, salinity and extreme temperatures: towards genetic engineering for stress tolerance. Planta. 218(1):1–14. doi:10.1007/s00425-003-1105-5.
- Wege S, Gilliham M, Henderson SW. 2017. Chloride: not simply a ‘cheap osmoticum’, but a beneficial plant macronutrient. J Exp Bot. 68(12):3057–3069. doi:10.1093/jxb/erx050.
- White PJ, Broadley MR. 2001. Chloride in soils and its uptake and movement within the plant: a review. Ann Bot. 88(6):967–988. doi:10.1006/anbo.2001.1540.
- Wu D, Cai S, Chen M, Ye L, Chen Z, Zhang H, Dai F, Wu F, Zhang G. 2013. Tissue metabolic responses to salt stress in wild and cultivated barley. PLoS One. 8(1):e55431. doi:10.1371/journal.pone.0055431.
- Xu G, Magen H, Tarchitzky J, Kafkafi U. 1999. Advances in chloride nutrition of plants. In: Sparks DL, editor. Advances in Agronomy. San Diego: Academic Press; p. 97–150.
- Yamagami M, Haga K, Napier RM, Iino M. 2004. Two distinct signaling pathways participate in auxin-induced swelling of pea epidermal protoplasts. Plant Physiol. 134(2):735–747. doi:10.1104/pp.103.031294.
- Yang W, Wang F, Liu L-N, Sui N. 2020. Responses of membranes and the photosynthetic apparatus to salt stress in cyanobacteria. Front Plant Sci. 11:713. doi:10.3389/fpls.2020.00713.
- Yu G, Wang LG, Han Y, He QY. 2012. clusterProfiler: an R package for comparing biological themes among gene clusters. OMICS J Integr Biol. 16(5):284–287. doi:10.1089/omi.2011.0118.