
ABSTRACT
We report a single-case intervention study of Alan, a child aged 10;04, who presented with spelling difficulty but good reading skills. Assessment of the potential cognitive functions underlying the spelling difficulty explored phonological abilities, visual memory and letter report. We also assessed print exposure and verbal memory. Results of analysis of spelling performance revealed an effect of word length on accuracy, and spelling errors involving omission, insertion, substitution and transposition of graphemes. Results of the literacy-related assessments indicated that Alan did not have a phonological or visual memory deficit, but he showed impaired performance in the letter-report task when asked to report all the letters in the five-item test array. On the basis of previous research, we hypothesised that Alan’s unexpectedly poor spelling was due to a graphemic buffer deficit. Two different interventions were employed: a lexical-orthographic programme, followed by one aimed at improving sublexical abilities. The results showed a significant increase in spelling accuracy after the lexical-orthographic intervention for the treated word set, and a small improvement for the untrained words that was significant at delayed post-intervention testing. The improvement was shown to persist over time. No improvement in spelling was observed after the sublexical intervention. The study emphasises the importance of a wide assessment in order to investigate cognitive processes underpinning spelling difficulty.
Introduction
Spelling difficulties are commonly associated with poor reading, or else they can be a problem associated with dyslexia that persists over time when a reading deficit has resolved (e.g., Kohnen, Nickels, Coltheart, & Brunsdon, Citation2008). However, spelling difficulty can exist as an isolated difficulty in competent readers who do not have any history of reading problems. The present study involves a 10-year-old child, Alan, with just such an ‘unexpected’ spelling difficulty. He exhibited a striking dissociation of above-average reading skill and impaired spelling. We report assessments that were aimed at identifying a potential underlying deficit, as well as the results from two intervention programmes that were administered with the aim of improving Alan’s spelling ability.
The dual-route model (Barry, Citation1994; Rapcsak, Henry, Teague, Carnahan, & Beeson, Citation2007) postulates two separate but interacting processes (see Tainturier & Rapp, Citation2001, for a review) by which words and nonwords or unknown words can be written: a lexical/semantic route and a nonlexical/sublexical route. Irregular words (such as yacht) that do not follow the conventional sound-letter correspondences need to be processed by the lexical route as whole words. A difficulty with lexical processes will hamper the establishment of orthographic-lexical representations. Surface dysgraphics make more errors in irregular than regular words (a regularity effect). They also spell nonwords relatively well in comparison with words, and make phonologically plausible errors spelling, e.g., <yacht> as <yot>. The second set of processes postulated in dual-route theory is responsible for the ability to spell unfamiliar words or nonwords (e.g., <wup>) that do not have any conceptual orthographical representation. A selective impairment in the acquisition of phoneme-grapheme rules is labelled phonological dysgraphia, which is characterised by better performance in words than nonwords and a word-frequency effect (Spencer, Citation1999).
Since different types of dysgraphia may arise from different deficits, the research into possible underlying causes of unexpected spelling difficulty has tended to focus on three main explanations, a mild phonological deficit, inefficient orthographic processing and a deficit of visual memory. We review the evidence for these before outlining the details of the present study. The ‘phonological core deficit’ hypothesis (Stanovich, Citation1986) has been the main explanation and focus of research for developmental literacy difficulties for several decades. Based on the hypothesis, researchers have used direct assessments of phonological abilities to investigate this explanation for poor spelling. Perin (Citation1983) used the Spoonerisms task, where testees are asked to transpose the initial phonemes of pairs of words, and reported poor performance in 14- and 15-year-old unexpectedly poor spellers. Burden (Citation1992) reported poor nonword reading skill in adult unexpectedly poor spellers. However, in the latter study Burden reported results of a post-hoc reading test that indicated that the good and poor spellers were not matched for reading ability. Masterson, Laxon, Lovejoy, and Morris (Citation2007) failed to find a significant difference in spoonerisms performance between good and poor spellers (university students) matched on reading comprehension skill. They also assessed accuracy and latency for picture naming, a task that has been used to assess phonological difficulties in the past, and failed to find a group difference. Holmes and Quinn (Citation2009) also failed to detect a group difference for either picture naming or phoneme counting with university students divided into good and poor spellers and matched on word reading skill.
In summary, there is evidence that a phonological difficulty is not the only factor explaining unexpectedly poor spelling. In addition, there are a number of studies describing unexpectedly poor spellers whose errors were characterised by phonologically plausible responses (such as <yacht>→<yot>). This type of error has been interpreted as due to a difficulty accessing whole-word (lexical) representations and subsequent recourse to use of sublexical or phonological processes. Frith (Citation1978, Citation1980) was the first to investigate potential reasons for unexpectedly poor spelling. Her participants were 12-year old good and poor spellers matched on word reading ability. She argued against the possibility that phonological difficulties might be the cause of unexpectedly poor spelling since the errors of the poor spellers were mainly phonologically appropriate. Masterson et al. (Citation2007) reported predominantly phonologically appropriate spelling errors for unexpectedly poor adult spellers, although the percentage of these (85%) was slightly less than in the good spellers (93%). Bruck and Waters (Citation1990) reported phonologically inappropriate spelling errors in eight-year-old unexpectedly poor spellers, however, the difference was found only when the classification system took account of positional constraints, and Holmes, Malone, and Redenbach (Citation2008) point out that this could be regarded as a form of orthographic rather than phonological knowledge. Holmes et al. reported the same rate of phonologically plausible errors for unexpectedly poor spellers and good spellers who were university students.
A second potential cause of unexpectedly poor spelling that has been investigated is a deficit of visual memory. Goulandris and Snowling (Citation1991) reported the case of JAS a 22-year-old student whose reading was assessed at just within the average range but whose spelling, especially of irregular words, was poor. JAS had relatively good phonological decoding skills as assessed by nonword reading, but she had a significant visual memory deficit. She had very poor performance in a task involving the reproduction of a sequence of unfamiliar symbols. Goulandris and Snowling suggested that poor visual memory in the case of JAS, might have been responsible for an inability to set up detailed orthographic representations. Romani, Ward, and Olson (Citation1999) tested AW, a 22-year-old university student with particuarly poor irregular word spelling but good reading skills. Phonological awareness, phonological short-term memory, visual spatial and episodic memory skills were all found to be good. However, AW performed poorly in tasks that involved reconstructing the order of a series of complex characters when these were presented sequentially. Romani et al. suggested that AW’s selective deficit of encoding serial order had led to the formation of orthographic representations that could support reading but not spelling.
A third alternative potential cause of unexpectedly poor spelling that has been explored is inefficient orthographic processing. This was first suggested by Frith’s (Citation1985) finding that adolescent unexpectedly poor spellers were worse than good spellers at detecting instances of silent e in a letter-cancellation task. Frith suggested that habitual reliance on partial cues in reading leads to the establishment of incomplete orthographic representations. Holmes and Castles (Citation2001) and Holmes et al. (Citation2008) provided support for this hypothesis with adult unexpectedly poor spellers, reporting poor performance in tasks that involved, for example, detecting letter transpositions in misordered words. Further support for the explanation was provided by Hanley, Hastie, and Kay (Citation1992) who reported the case of a 22-year-old man with surface dysgraphia. His word reading was generally accurate but lexical decision performance was poor. Finally, Masterson et al. (Citation2007) reported misclassification errors with nonwords in a lexical-decision task in unexpectedly poor adult spellers, as well as poor performance in letter report from briefly presented letter arrays.
A difficulty in letter report using briefly presented arrays has been reported in a subset of dyslexic children in a number of recent studies (e.g., Bosse, Tainturier, & Valdois, Citation2007; Valdois et al., Citation2003). It has been interpreted in terms of a difficulty in the processing of multiple elements in parallel, which leads to a disruption of the processing and memorisation of orthographic units (e.g., syllables and words) during the course of reading acquisition. Valdois et al. (Citation2003) used a paradigm where sequences of five consonants were briefly shown. In the whole report version, as in the task used by Masterson et al. with adults (Citation2007), participants were asked to report all the letters in the array, while in the partial report version a probe was presented after the letter sequence to indicate report of one letter in the array. This paradigm was used in the present study to allow comparison with results from previous studies with children.
In the literature on acquired dysgraphia, there have been several descriptions of patients with a selective spelling difficulty thought to be due to damage to the graphemic buffer (e.g., Caramazza, Miceli, Villa, & Romani, Citation1987; Hillis & Caramazza, Citation1989; Schiller, Greenhall, Shelton, & Caramazza, Citation2001). The graphemic buffer is the post-lexical store responsible for holding abstract grapheme identities and their order before peripheral output processes for spelling (Tainturier & Rapp, Citation2001). The patients’ spelling responses are characterised by transposition, substitution, insertion and deletion of graphemes, regardless of mode of output (handwritten, typewritten, etc.), and regardless of whether stimuli are words or nonwords. Errors increase in rate as a function of letter length, and they are not subject to lexical factors, such as word class or frequency. The fact that the errors made by the patients are not influenced by lexicality or lexical factors is attributed to the deficit arising post-lexically; the types of errors made and word-length effect are thought to reflect the degradation of graphemic representations of words in the graphemic buffer. The disorder was reported in 10 Hebrew-speaking participants with developmental spelling difficulty by Yachini and Friedmann (Citation2010). We discuss this type of dysgraphia since, as we shall see in the next sections, Alan’s spelling shared many of the same features, and so his difficulty may be due to a deficit of the graphemic buffer.
We employed a range of assessments in order to address the potential causes of unexpectedly poor spelling in Alan’s case. Phonological processing, visual memory and letter report were investigated. Two groups of comparison children were recruited who were matched to Alan in terms of chronological age and spelling ability. After reporting the results of the investigations, in the second part of the paper we report two training studies focusing on different aspects of spelling skill.
Case study
Case history
Alan was aged 10;04 at the start of the current study and was attending Year 5 of a mainstream primary school in London, UK. A teacher at the school referred Alan to us for a spelling difficulty. During assessment conducted when Alan was 9;10, before the present study, reading ability was assessed with the Wechsler Individual Achievement Test Second UK Edition for Teachers (Rust & Golombok, Citation2006), and was found to be at the 87th percentile (age equivalent = 14 years). Spelling ability was assessed at the same time as reading, with the Single Word Spelling Test (Sacre & Masterson, Citation2000). Alan’s age equivalent score was 8;10 years. School records reported a discontinuity in literacy learning skills: in Year 4 Alan did not reach the national standard level for writing, while a better performance was achieved during the following school year. No other information about spelling was available. Alan’s developmental history, according to parental report, was uneventful: milestones were met at appropriate ages. Alan’s mother described his handwriting as slow and effortful while she described him as an assiduous reader. Also, Alan was able to easily remember visual sequences in storybooks. A spelling problem in two older sisters was reported. No sensory/motor/behavioural difficulties were mentioned. The study received ethical approval from the Institute of Education, University of London and was carried out once informed parental written consent had been received.
Background assessments
The following background assessments were administered in a quiet room at Alan’s school over a three-week period at the beginning of the study. Non-verbal reasoning was assessed using the Matrix Analogies Test (Naglieri, Citation1985). Receptive vocabulary was assessed with the British Picture Vocabulary Scale, second edition (BPVSII; Dunn, Dunn, & Whetton, Citation1997), and arithmetic ability with the arithmetic subtest from the Wechsler Intelligence Scale for Children, Fourth UK Edition (WISC IVUK; Wechsler, Citation2004).
Spelling, single word reading, reading speed and reading comprehension were assessed with the Wechsler Individual Achievement Test Second UK Edition for Teachers (WIAT-IIUK—T; Rust & Golombok, Citation2006). The WIAT spelling task consists of a spelling-to-dictation task containing regular and irregular words. We carried out the testing, as with all the standardised assessments, according to manual directions. According to these, the starting point in the test is determined by chronological age. Items are read aloud by the tester, then provided in the context of a sentence, and then read aloud again. The test is interrupted after six consecutive errors. Self-corrections are noted as qualitative observations and counted as correct if the self-corrected response is correct. Alan made two self-corrections but both resulted in misspelt words.
Lexical and sublexical skills for reading were evaluated with the Diagnostic Test of Word Reading Processes (DTWRP; Forum for Research in Language and Literacy, Citation2012). This consists of three subtests of regular words, irregular words and nonwords, each with 30 items of increasing length and orthographic complexity. Alan’s results in the DTWRP and for the other standardised background assessments are given in .
Table 1. Scores in the background assessments (standard deviations in parentheses)
We investigated Alan’s exposure to print with two tasks, an Author Recognition Test and Title Recognition Test, as described in Rudra (Citation2005). The tests consist of 25 authors’ names/book titles chosen from books for children aged 9–11 years, intermixed with made-up book titles/author names. The total score is the difference between the items the child is able to recognise and those erroneously identified. The normative sample consisted of 21 females and 27 males (mean age in months = 119.3, SD = 9.5) (Rudra, Citation2005). Alan’s score for title recognition was in the average range (Alan’s score = 13, normative sample average: 13.8; SD = 4.1) while his score for author recognition was below that of the control group (Alan’s score = −1, normative sample average: 8.4; SD = 3.3).
Summary of results in background assessments
Alan scored highly for receptive vocabulary and non-verbal reasoning. The results for the different aspects of reading were all within the average range, and the score for reading comprehension was above average. In the Title Recognition Test, Alan’s score did not differ from that of the controls, however, in the Author Recognition Test his score was worse than that of the controls. This finding might be interpreted as a lack of attention to books’ authors as Alan was described as a keen reader by both his parents and his teacher. In contrast, Alan’s result for spelling showed a selective deficit, with a standard score of 81 in the WIAT spelling test (spelling age equivalent = 7;8). Alan’s spelling performance was explored in more detail with the results reported in the next section.
Further assessment of spelling
A list of 60 words (from Masterson et al., Citation2008), consisting of 45 regular words and 15 irregular words, was used in a spelling-to-dictation task. Items were read aloud by the tester, then provided in the context of a sentence to disambiguate the meaning, and then read aloud again. The word list of regular words contains simple (e.g., <day>) and complex (e.g., <ceiling>) spelling-rules (Venezky, Citation1970).
Twelve children from a school with the same intake as Alan’s school were recruited to serve as a chronological-age (CA) comparison group. The group consisted of seven girls and five boys (mean age in months = 124.33, SD = 1.56, range 122–126). A further 12 children were recruited to serve as a spelling-age (SA) comparison group. There were six girls and six boys (mean age in months = 92.25, SD = 1.36, range 90–94). The SA group had reading ages within six months of their chronological age (mean spelling age in months = 92.33, SD = 3.17, range = 88–96).
The comparison group children were tested with the standardised Matrix Analogies test, to assess non-verbal reasoning abilities, and the spelling subtask from the WIAT, for the purposes of matching. The two standardised tests were administered to the children individually. A summary of their results is in . The comparison children were also assessed in spelling-to-dictation of the 60-word list, and this task was group administered. For the group administration there were three adults in the room at the time of testing. Children were instructed to ask for repetition if they were not sure what the word was on each trial. The testers were vigilant in checking that children worked separately. Before moving on to the next item in the list, attention was given to ensure all children had finished their response. Accuracy in the 60-word list for Alan and for the two comparison groups is reported in .
Table 2. Number correct (and percentage correct) in spelling the 60-word list for Alan and the comparison groups
Modified t-tests were performed, following the procedure described in Crawford and Howell (Citation1998), to look for differences in Alan’s spelling scores in the 60-word list and those of the comparison groups. All comparisons involve one-tailed probabilities. There was a significant difference in accuracy in the 60-word list for Alan and the CA comparison group [t(11) = 2.12, p < .05], but not the SA comparison group [t(11) = 0.52, p = 0.31].
A qualitative analysis of spelling errors made in the 60-word list was conducted. Errors were classified as phonologically appropriate or inappropriate following Venezky’s (Citation1970) analysis of English spelling-sound rules. Alan’s errors and those of the SA comparison group are given in the Appendix. Results revealed that 56% of Alan’s errors were phonologically appropriate, while for the SA comparison group an average of 47% were phonologically appropriate. For the CA comparison group 57% of errors were phonologically appropriate. The phonologically inappropriate errors of Alan and the SA and CA comparison group children were classified into errors that seemed to involve omission, addition, substitution or transposition of graphemes, or a combination of these. A summary of the results of the analysis is given in . Some of the children’s errors involved both a phonologically appropriate and phonologically inappropriate error (for example, <monastery>→ <moustry>). The phonologically inappropriate segment in each of these mixed errors was classified according to omission, addition, substitution, transposition or a combination of these.
Table 3. Number of phonologically inappropriate spelling errors in the 60-word list in each error category for Alan and average number of phonologically inappropriate errors in each category for the SA and CA comparison children
Analyses were next conducted to examine the predictors of spelling accuracy in the 60-word list for Alan and individual children in the SA and CA comparison groups using logistic regression analysis. The dependent variable was accuracy (correct or incorrect) for each word. The predictor variables were logarithm of printed word frequency using frequency values from the Children's Printed Word Database (Masterson, Stuart, Dixon & Lovejoy, Citation2010) and word length in letters. The results for Alan and the SA and CA comparison groups are reported in . The findings revealed that for Alan, only word length was a significant predictor of accuracy. For four of the CA comparison children neither predictor was significant, but it should be noted that for some children in this group accuracy was near ceiling. For the SA comparison group, frequency was a significant predictor in eight of the 12 children, and only one child showed the same pattern as Alan of a pronounced effect of length and no significant effect of word frequency.
Table 4. Results of logistic regression analyses with accuracy in spelling the 60-word list as the dependent variable for Alan and the SA and CA comparison groups
Logistic regression analyses were carried out in order to better characterise Alan’s spelling profile. Two regression analyses were performed with results in the 60-word list. The dependent variable was Alan’s spelling accuracy (correct vs. incorrect) and the independent variables were (1) word regularity and (2) item difficulty expressed as the number of comparison group children who spelt the word correctly (after Angelelli, Marinelli, & Zoccolotti, Citation2010). The results are reported in . Item difficulty for the comparison group children was a significant predictor of Alan’s spelling accuracy in both analyses, while regularity was not a significant predictor in either analysis. The results confirm that Alan’s performance was impaired for both regular and irregular words.
Table 5. Results of logistic regression analyses with Alan’s accuracy in spelling the 60-word list as the dependent variable and regularity and item difficulty as predictor variables
In summary, the results from further assessment of spelling revealed that Alan’s spelling was poor for both regular and irregular words, indicating an undifferentiated difficulty with both lexical and sublexical spelling processes. The individual analyses for the comparison group children showed that for many word frequency and/or word length were significant predictors of spelling accuracy. Alan’s spelling accuracy was strongly influenced by word length. He showed a similar level of phonologically appropriate errors in his spelling (56%) to the comparison groups (57% for the CA and 47% for the SA groups). In the next section, we report Alan’s performance in experimental tasks assessing visual memory, phonological ability and letter report, since these have been associated with spelling deficits in previous studies.
Standardised and experimental tasks
To assess phonological abilities, the Spoonerisms subtask from the Phonological Assessment Battery (PhAB; Frederickson, Frith, & Reason, Citation1997) and the Blending subtask from the Comprehensive Test of Phonological Processing (CTOPP; Wagner, Torgesen, & Rashotte, Citation1999) were used. Rapid automatised naming was measured using the Pictures and Digits subtasks from the PhAB. Digit Span Forwards and Backwards from WISC IVUK (Wechsler, Citation2004) was used to assess verbal memory. The results are given in , and indicated a performance in the average range for all the phonological tasks.
Table 6. Phonological awareness, rapid naming and verbal memory assessment scores for Alan
Visual memory
The Memory for Designs and Pictures subtests from the Athena Test (Paraskevopoulos, Kalantzi-Azizi, & Giannitsas, Citation1999) were used to assess visual memory. In these, the child is asked to reproduce sequences of increasing length, using sets of tiles provided by the tester, following a five-second interval. A comparison group of six children (all boys) was recruited in order to provide comparative data against which to assess Alan’s performance in the tasks. Their mean age was 113.50 months, SD = 3.78, range 110–120. They were attending Year 5 of the same school as Alan. Four of the six children were monolingual English speakers, as was Alan. The remaining two children spoke English at home as their first language.
Two additional visual memory tasks were used, one with simultaneous and one with sequential presentation of stimuli. Both are described in Rudra (Citation2005). The normative sample consisted of 21 females and 27 males (mean age in months = 119.3, SD = 9.5) (Rudra, Citation2005). The Visual Simultaneous Memory Task was adapted from Hulme (Citation1981). We used 12 Greek letters (which were unfamiliar symbols for Alan) simultaneously presented in sequences of two, three or four items on the screen of a COMPAQ Presario 6000 laptop. There were three practice items. Each sequence was presented for 10 seconds with an inter-trial interval of one second. A test array was presented after a retention interval of one second for the first six trials and after 10 seconds for the next six trials. The test array contained the test items in different order plus two new items. Alan was asked to indicate the symbols in the correct order. The Visual Sequential Memory Task was a modified version of the task developed by Goulandris and Snowling (Citation1991). The same procedure described for the simultaneous task was adopted. However, in this version, the items were presented sequentially in a sequence of two, three or four symbols. Each character was presented for two seconds with an inter-trial interval of one second. This version was administered three weeks after the simultaneous version. The results for all four visual memory assessments are presented in .
Table 7. Accuracy (and percentage correct) in the visual memory tasks for Alan and the comparison group
Letter report
The following letter-report task was adapted from Bosse et al. (Citation2007). Visual Basic software was used to programme the task and it was presented on a Dell laptop computer. In the global report condition, Alan was asked to report a five-letter array shown on the computer screen on each trial. Ten consonants were used (T, P, F, L, M, D, S, R, H, B) to form 20 arrays. Each letter was used 10 times and appeared only twice in the same position. The letters in upper-case (Geneva 24) were shown in black on a white background, and were 1 cm distant from each other. Each array was presented for 200 msecs in the middle of the computer screen. Five practice trials were administered before commencing the main task. Two scores were recorded: the number of arrays correctly reported (maximum score = 20) and the number of letters correctly reported (maximum score = 100).
In the partial report condition, Alan was asked to report only a cued letter in the five-letter array. Fifty strings of five letters each were formed from the same consonants used in the whole report version of the task. The letters did not appear twice in the same sequence. At the offset of the array, a bar appeared for 50 msecs 1 cm below the letter to be reported. Each letter was used as a target only once. There were 10 practice trials. The score was the number of letters correctly reported (maximum score = 50).
Data for the task were reported for typically developing readers/spellers by Bosse et al. (Citation2007). This data was used as a comparative set of results against which to compare Alan’s performance. The sample consisted of 23 L1 English children (mean age in months = 125.7, SD = 7.7, range 114–139). The results for letter report are presented in . Modified t-tests were performed (Crawford & Howell, Citation1998) to look for differences in Alan’s visual span performance and that of the comparison group. All comparisons involve one-tailed probabilities. There was a significant difference in the number of letters accurately reported for Alan and the comparison group [t(22) = 3.08, p = .003]. For the number of five-letter strings accurately reported, Alan’s performance was marginally significant [t(22) = 1.65, p = .057] while there was no significant difference between Alan and controls in the partial report condition [t(22) = 0.24, p = .407].
Table 8. Accuracy (and percentage correct) in the letter-report task for Alan and the comparison group
Discussion of assessment results
The assessments of phonological awareness, rapid naming and verbal short-term memory revealed no evidence of deficits. In the assessments of visual memory, Alan’s results were good. In fact, his score for visual memory for pictures in the Athena Test was more than two standard deviations above that of the comparison group. His score in the simultaneous version of the visual memory task was at ceiling. In the sequential version of the task, his score was comparable to that of the control group reported by Rudra (Citation2005).
When letter report was assessed, in the global report condition Alan reported correctly just two arrays. For total number of letters reported in this condition he showed very poor performance. He was usually able to report the first three letters of the arrays but no more. Performance in partial report, however, was on a par with that of the comparison group children. A selective deficit in global but not partial letter-report performance has been reported previously in children with literacy difficulties. Valdois et al. (Citation2011) reported Martial, a nine-year-old boy with mixed dyslexia and surface dysgraphia who had impaired global report performance but not partial report, and Niolaki and Masterson (Citation2013) described a 12-year-old boy with a profile of surface dyslexia and dysgraphia who showed the same pattern.
Performance in the letter-report task had been interpreted as a measure of the ability to process multi-element arrays in parallel, and one potential reason put forward for poor performance has been imbalance of the distribution of attention (Dubois et al., Citation2010). If this were the cause, then performance in partial report should also be impaired, and degradation of the contents of the graphemic buffer is likely to be a more plausible candidate. The finding that Alan’s spelling accuracy was strongly influenced by word length further supports a deficit of the graphemic buffer as the locus of the difficulty. As noted in the Introduction, the graphemic buffer is the memory store that is responsible for retaining an abstract representation of graphemes. It has been suggested that the graphemic buffer is also involved in reading (e.g., Caramazza, Capasso, & Miceli, 1996), acting as a store of representations of graphemes and their order prior to input to word-recognition processes. The argument is based on reports of patients where the characteristics of the spelling impairment were mirrored in reading (e.g., Caramazza & Miceli, Citation1990; Tainturier & Rapp, Citation2003). We reflect on why reading might appear unaffected in Alan’s case in the Discussion. In the next section, we report the intervention carried out with Alan that aimed to improve his spelling ability.
Intervention study
In recent years, the number of single-case intervention studies for spelling difficulties in children has increased (Brunsdon, Coltheart, & Nickels, Citation2005; Kohnen, Nickels, Coltheart, et al., Citation2008; Stadie & van de Vijver, Citation2003), although more frequent are intervention studies for spelling associated with a reading deficit (Broom & Doctor, Citation1995a, Citation1995b; Brunsdon, Hannan, Coltheart, & Nickels, Citation2002; Judica, Luca, & Spinelli, Citation2002; Kohnen, Nickels, Brunsdon, & Coltheart, Citation2008; Kohnen, Nickels, & Coltheart, Citation2010). We carried out two intervention programmes with Alan, one that was targeted at the deficit we argued is located in the grapheme buffer, and one that was non-specific to his deficit. The techniques we used have been employed in previous studies with children with spelling difficulties.
Deficit-specific intervention
The first programme involved a copy-plus-copy-from memory technique that has been used in intervention studies with children with lexical spelling difficulties, with the aim of strengthening (or creating) orthographic representations (Brunsdon et al., Citation2005; Kohnen, Nickels, Coltheart, et al., Citation2008). Before these studies, it was found to be effective in treatment studies with acquired dysgraphic patients with graphemic buffer disorder (Aliminosa, McCloskey, Goodman-Shulman, & Sokol, Citation1993; de Partz, Citation1995; Rapp, Citation2005; Rapp & Kane, Citation2002). The technique is suitable for a graphemic buffer impairment as it involves training in holding written word representations in memory while they are transcribed, with the expectation that this should act to increase the capacity of the graphemic buffer to retain item and order information. Mitchum and Berndt (Citation1995) noted that one problem with studies that aim to improve the function of the graphemic buffer is that the treatment may have its effect on lexical representations in the orthographic output lexicon. There would thus seem to be an argument for the use of nonlexical materials in the type of intervention that we employed. However, in a previous intervention study with a dyslexic and dysgraphic child who, like Alan, had a selective deficit in the letter-report task, Niolaki and Masterson (Citation2013) reported no improvement in spelling (although improvement of word reading speed) following an intervention that involved report of letter arrays of increasing length. This was in spite of the fact that the training resulted in a level of performance in the letter-report task that was as good as that in control children.
Sage and Ellis (Citation2006), in an intervention study with a patient with graphemic buffer impairment, located the mechanism of improvement based on evidence for a bidirectional flow of activation between the graphemic buffer and the orthographic output lexicon (e.g., McCloskey, Macaruso, & Rapp, Citation2006; Miceli & Capasso, Citation2006). They found that untreated words that were orthographic neighbours of the treated words improved as a result of the spelling intervention they administered. They suggested that an increase in activation in a target’s neighbour in the lexicon (due to the intervention) allowed the target to receive support within the graphemic buffer due to cascading activation. Untreated words that were not orthographic neighbours of the treated words did not show improvement and so Sage and Ellis discounted the possibility that the intervention had led to an increase in the capacity of the graphemic buffer to retain orthographic sequences. However, the intervention had not involved writing. Techniques were, for example, finding missing letters or words in grids, and they suggested that these were more likely to boost lexical representations than increase the capacity of the graphemic buffer. In selecting the intervention for Alan, we considered it important to adopt an intervention that would be likely to produce generalisation of improvement and would be most likely to target increase in the capacity of the buffer. Since Rapp and Kane (Citation2002) and Rapp (Citation2005) reported generalisation effects with the copy-plus-copy-from-memory method, we chose this. It is also a technique that is similar to one commonly used in UK schools for spelling practice (often referred to as look-cover-write-check) and, if it were to prove successful, we thought it might be a technique that Alan would feel comfortable using after the intervention programme finished.
The intervention we used was found to produce improvement in trained words and also robust generalisation effects to untrained words in the studies of Brunsdon et al. (Citation2005) and Kohnen, Nickels, Coltheart et al. (Citation2008) with children with lexical spelling deficits. Khonen et al. noted that untrained words that were orthographically similar to trained words were more likely to show improvement than those that were orthographically dissimilar. In addition, untrained words with many orthographic neighbours, and those of high frequency, were the ones most likely to exhibit improvement. In line with the connectionist framework adopted by Sage and Ellis (Citation2006), they suggested that activation of trained words during the intervention leads to activation of lexical nodes of words that share letters with the trained words, and this can result in long-term strengthening of links between the grapheme level and the output lexicon for these items.
On the basis of previous findings with the copy-plus-copy-from-memory intervention, we felt that this was an appropriate impairment-specific technique. We aimed to look for improvement in trained words following the programme, but also (1) improvement in untrained words, and if this was observed, we aimed to examine whether (2) the untrained words that improved were higher in orthographic neighbours than untrained words that did not improve, and (3) whether they were also higher in frequency. Evidence of generalisation, on the basis of the theorising above, would indicate increased capacity of the graphemic buffer, and (2) and (3) would indicate strengthening of the network of connections between entries in the orthographic input lexicon and the graphemic buffer.
Two alternative methods for presentation of the words, previously used in studies with children with lexical spelling difficulties, were employed within this programme in case one might be more effective, perhaps due to motivational factors. The first involved the use of flashcards (Brunsdon et al., Citation2002, Citation2005; Kohnen, Nickels, Coltheart, et al., Citation2008; Stadie & van de Vijver, Citation2003), and the second, the use of flashcards plus a mnemonic cue (Brunsdon et al., Citation2002, Citation2005). In Brunsdon et al. (Citation2002), the mnemonic cue, a picture related semantically to the target word, was suggested by the researcher because the child, TJ, found this technique very difficult. For example, for the target word <through>, Brunsdon drew a tunnel with a child’s head at one end and feet at the other, and the word <through> written in the middle of the picture. In the present study, for each word incorrectly spelt, a mnemonic cue was devised that was both semantically related to the word and also related to the misspelt letter(s), as described in the intervention study carried out with an acquired surface dysgraphic patient by Partz, Seron, and Linden (Citation1992). Alan was invited to find an appropriate semantically related picture and help was provided by the researcher if needed. An example item includes <mosquito>, where a snake was drawn in place of the letter <s> in the target word on the flashcard (the semantic relationship was that snakes eat mosquitoes, and <s> was the letter that Alan had left out when spelling this word). This technique is considered to involve increasing the connections between semantics and the orthographic output lexicon, and although this was not considered to be the locus of the deficit in Alan’s case, we considered the technique might increase his sense of ownership over the intervention materials and thus encourage his participation. We explored the relative effectiveness of the flashcard and flashcard plus mnemonic techniques as well as the potential generalisation effects outlined above.
Non-specific intervention
The second intervention programme focused on sublexical processes by teaching spelling rules (Broom & Doctor, Citation1995b; Kohnen, Nickels, Brunsdon, et al., Citation2008, Citation2010). For example, Kohnen et al. (Citation2010) carried out a sublexical spelling training with a young man, RFL, with mixed dysgraphia. Kohnen et al. (Citation2010) used the minimal pairs strategy to teach RFL the rule-of-E. Each target word (e.g., <cute>) was presented with a contrasting word (<cut>), which did not include the rule-of-E. The attention of RFL was drawn to the contrast by saying “This is the word /kɒp/. You can hear the letter sound in it, the /ɒ/. Listen: /k/-/ɒ/-/p/”. In case there was no existing contrast word, a nonword without rule-of-E was used (e.g., target word <clone>, contrast nonword <clon>). Two groups of items, trained and untrained, were employed. Regarding the trained words with trained rule-of-E, they found a direct improvement at the end of the intervention which lasted over time, while there was no improvement for untrained words with trained rule-of-E. Kohnen et al. found no generalisation effect to words with untrained rule-of-E.
In spite of Alan’s good performance in phonological tasks, we carried out the sublexical intervention as well as the lexical-orthographic intervention, following Rowse and Wilshire (Citation2007). They found a non-specific improvement in lexical and sublexical reading skills after an intervention targeting grapheme-phoneme correspondences. The authors argue that administration of only one intervention leaves unanswered the question of whether another approach would have been equally effective.
Methods
Lexical-orthographic intervention
The lexical-orthographic intervention involved two baseline assessments, four weeks of intervention, an immediate post-intervention test and three follow-up assessments to investigate maintenance of any gains.
Two baseline measures of spelling were collected using a list of words from three different sources.Footnote1 The first consisted of 30 regular and 30 irregular words from the Diagnostic Test of Word Reading Processes, the second consisted of 30 regular and 30 irregular words from Coltheart and Leahy (Citation1996), and the third was the 60-word list from Masterson et al. (Citation2008) described earlier. Six words that were repeated among the three sets were presented only once, leaving a total of 174 words. The list was presented in two different weeks. Analysis of the results using McNemar’s test indicated no significant difference in Alan’s spelling accuracy across baseline 1 and baseline 2 (p = .556). Sixty-eight words misspelt in at least one of the two baselines were allocated to two sets: a treated and an untreated set. These were matched for printed word frequency [t(66) = 0.08, p = .468], word length [t(66) = 0.06, p = .475], number of phonological neighbours [t(66) = 0.35, p = .363], number of orthographic neighbours [t(66) = 0.25, p = .806], regularity [t(66) = 1.46, p = .16] and least transparent phoneme-grapheme probabilityFootnote2 [t(66) = 0.06, p = .478]. The treated word set was then split into two subsets; one was allocated to the mnemonic training condition and the other to the flashcard training condition. The words in the two subsets were again matched on the psycholinguistic variables, printed word frequency [t(32) = 1.37, p = .09], word length [t(32) = 1.10, p = .141], number of phonological neighbours [t(32) = 1.15, p = .131], number of orthographic neighbours (with Welch correction) [t(24) = 0.97, p = .342], regularity [t(32) = 0.68, p = .25] and least transparent phoneme-grapheme probability [t(32) = 0.53, p = .299].
Procedure
The weekly training sessions, each lasting one hour, were carried out in a quiet room at Alan’s school. Each target word was trained only once. Two procedures were employed: a flashcard and a mnemonic strategy. Stimuli consisting of flashcards with the target word in lower case (Arial font, size 48), were read aloud first by the examiner and then by Alan, after discussion of the word’s meaning. Alan was asked to copy the word. The target word was then removed from Alan’s view and he was asked to write the word after a 10-second delay. If the spelling was correct, the examiner moved on to the next card, otherwise the target word was presented again. Alan was given feedback as to whether the response was correct or not. Finally, he was asked to write a sentence including the target word.
In the mnemonic condition, Alan was asked to write the word and then the misspelt part was highlighted.Footnote3 Alan was invited to find an image semantically related both to the letters misspelt and the word meaning. In the case of abstract words (such as treacherous) or if Alan struggled to find an appropriate image, suggestions were provided. The target word was then written twice, once with the mnemonic cue and once without. Alan carried out home practice. His parents were instructed in the procedures and were enthusiastic about supporting the intervention. They were provided with detailed written instructions each week and were invited to work with Alan every day for about 20–30 minutes on the treated word sets. At the beginning of the subsequent weekly session with the researcher, several activities with the target words were offered in order to check whether Alan had practised the words (e.g., crosswords, picture-word matching, spelling-to-dictation, sentences to be filled).
Results
Comparisons were made of treated and untreated words for baseline and post-intervention spelling accuracy, employing the highest baseline result. Results are given in and in .
Figure 1. Number of treated and untreated words spelt correctly at pre- and post-test for the lexical intervention.
Table 9. Number of correctly spelt (and percentage correct) treated and untreated words before and after the lexical intervention
McNemar’s test was used to compare Alan’s spelling accuracy at baseline with post-intervention scores. All comparisons involve one-tailed probabilities. At the end of the intervention (Post-test 1), the number of treated words spelt correctly (27/34) showed a highly significant improvement (p = .001). The difference in accuracy at pre- and post-intervention for the untreated words was marginally significant (p = .055). The untrained words correctly spelt (12/34) after the intervention were mostly those spelt correctly at one of the two baseline assessments (Z = 3.04, p < .001) (Weekes & Coltheart, Citation1996). For the treated words, those correctly spelt at the end of the intervention were not necessarily those spelt correctly at one of the two baseline measures (Z = 0.24, p = .407). Two untreated words (<sacrifice> and <concentrate>) were spelt correctly for the first time. There was no evidence of difference in effectiveness of the flashcard and mnemonic intervention techniques (Mann-Whitney test, p = .338).
Alan’s result in the WIAT spelling test after the intervention (shown in ) was in the average range. His result for single-word reading was unchanged from that obtained pre-intervention and this was also the case for his score in the Arithmetic subtest of the WISC-IV.
Table 10. Alan’s standard scores and percentiles for spelling, reading and arithmetic before and after the lexical intervention
At the four-week post-intervention assessment (Post-test 2), a total of 26/34 treated words were spelt correctly and no significant difference between Post-test 1 and Post-test 2 was found (p = .50), indicating maintenance of gains. The number of words correctly spelt in the untreated set (14/34) did not change (p = .50). At Post-test 3, 13 weeks after the end of the intervention, 28/34 words were spelt correctly in the treated set (p = .363) and 17/34 in the untreated set (p = .145), again indicating maintenance of improvement.
At 20 weeks after the intervention, the treated and untreated sets were re-administered (Post-test 4). Inspection of the data revealed that the number of treated words spelt correctly (24/34) decreased although the difference from Post-test 3 was not significant (p = .063). At a qualitative level, Alan misspelt some words (e.g., <stomach> → <stomace>, <yacht> → <yatch>, <tortoise> → <tortice>) that he was able to spell immediately at the end of the intervention. In the untrained set, the number of words spelt correctly (17/34) was equal to the number spelt correctly at Post-test 3 (p = .50), and was significantly different from the baseline measure (p = .001).
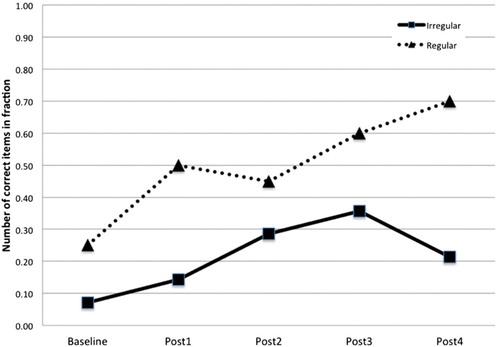
Analyses comparing accuracy for regular and irregular words at the different time points were carried out.Footnote4 For the treated items, accuracy for regular and irregular words did not differ at baseline (Mann-Whitney Z = 1.00, p = .16). At Post-test 1, there was a marginally significant difference in favour of regular words (Mann-Whitney Z = 1.60, p = .06). At Post-test 2, the difference was significant (Z = 1.86, p < .05) and at Post-test 3 the difference was again marginal (Z = 1.32, p = .09), while at Post-test 4 the difference in favour of regular words was robust (Z = 2.35, p < .01). A plot of the results is given in .
Figure 2. Number of treated irregular and regular words spelt correctly at pre- and post-test for the lexical intervention.
With regard to the untreated items, accuracy for regular and irregular words did not differ at baseline (Z = 1.32, p = .09). At Post-test 1, the difference in favour of regular words was significant (Z = 2.11, p < .05). At Post-test 2 and Post-test 3, the difference was not significant (Z = 0.96, p = .17; Z = 1.37, p = .08, respectively). At Post-test 4, the number of regular words spelt correctly was significantly higher than the number of irregular words spelt correctly (Z = 2.75, p < .01). The results are plotted in .
Figure 3. Number of untreated irregular and regular words spelt correctly at pre- and post-test for the lexical intervention.
Since some improvement was found for the untreated words, we examined whether printed word frequency and number of orthographic neighbours predicted generalisation as had been found in the study of Kohnen, Nickels, Coltheart, et al. (Citation2008). Two separate logistic regression analyses were carried out in which accuracy at Post-test 1 and at Post-test 4 was the dependent variable. The predictor variables were log transformation of printed word frequency and number of orthographic neighbours. Results (shown in ) revealed that at Post-test 1, word frequency was a marginally significant predictor of accuracy and at Post-test 4, word frequency was a significant predictor of spelling accuracy for the untreated words.
Table 11. Results of logistic regression analyses with Alan’s accuracy with the untreated words as the dependent variable and printed word frequency and number of orthographic neighbours as predictor variables
Summary
A significant improvement in spelling accuracy was found immediately after the lexical-orthographic intervention. The number of treated words correctly spelt at post-intervention assessments revealed that the gains remained relatively stable over time. In the final follow-up assessment, the number of treated words spelt correctly decreased but it was still high in comparison to the baseline assessment. There was also an increase in accuracy for untreated words, and words spelt correctly were those that Alan spelt correctly in one of the two baseline assessments. In the final follow-up assessment, he spelt correctly three new untreated words (<choir>, <middle> and <deer>).
No difference in effectiveness for the flashcard and flashcard plus mnemonic techniques was found. A lack of difference between the two methods was also reported by Brunsdon et al. (Citation2002) and Brunsdon et al. (Citation2005). Alan reported that he found the flashcard technique more helpful than the mnemonic technique. On this point, we would add that Alan’s parents were asked to follow the instructions provided weekly, although it may be possible that there was a difference in the way they conducted the two types of treatment technique. We discuss this limitation in the Discussion section.
Sublexical intervention
The sublexical intervention began two weeks after the final assessment for the lexical intervention. It included two baseline assessments, four weeks of intervention, an immediate post-intervention test and two follow-up assessments. Two baseline measures of nonword spelling were carried out. We used a total of 60 nonwords (30 from the Diagnostic Test of Word Reading Processes and 30 from Coltheart & Leahy, Citation1996). Phonologically plausible errors (e.g., <stroise> spelt as <stroys>) were scored as correct responses. There was no significant difference across the two baseline assessments (McNemar’s test; p = .227).
Procedure
The intervention was carried out in a quiet room at Alan’s school. He was seen twice a week for one hour each session. On the basis of Alan’s teacher’s suggestions and the spelling errors in his written work, we selected four spelling rules to treat in the intervention: /or/ → <augh>, <ough>, <aw>, <au>, <our<, <or>, <ore>; /k/ and /s/ → <c>; /i/ and /e/ → <ea>, and /k/ → <c>, <cc>, <ck>, <k>. At the beginning of the session, the examiner wrote ‘/or/ sound’ on a piece of paper while saying that many English words had the target sound, following the procedure described in Kohnen, Nickels, Brunsdon, et al. (Citation2008). Then, Alan was encouraged to find a word with that sound (as in Broom & Doctor, Citation1995b). Successively, the examiner suggested other graphemes with the ‘/or/ sound’, through presenting 10 high-frequency words. For each word, Alan was invited to find an analogous word with the target sound and to write it down on the same piece of paper. Feedback was given if the word did not have the same sound or if the spelling was incorrect. At the end of each session, Alan was provided a description of the specific spelling rule covered (instead of stating the spelling rule at the beginning as in Kohnen, Nickels, Brunsdon, et al., Citation2008) plus exercises for home practice that included the words used during the training session. During the first half hour of the next session with the researcher, homework was checked and different exercises (e.g., crossword, sentence completion, spelling-to-dictation) were carried out. Then the examiner explained the next spelling rule following the same procedure.
Results
All comparisons between baseline and post-intervention results employed the highest baseline result (baseline 2). McNemar’s test was used to compare Alan’s spelling accuracy at baseline with post-intervention scores. All comparisons involve one-tailed probabilities. Results are given in . No significant difference was found in spelling accuracy between the baseline measures 1 and 2 (p = .50). At the end of the intervention (Post-test 1), we asked Alan to again spell the 60 nonwords from the baseline assessment. A total of 31/60 nonwords were correctly spelt, indicating a decline when compared to pre-treatment baseline performance, though the difference was not significant (p = .324). After eight weeks, at the second post-intervention assessment, the number of nonwords correctly spelt (34/60) was similar to that at baseline 2. At 14 weeks post treatment (Post-test 3), a total of 37/60 nonwords were spelt correctly and the difference with Post-test 2 was not significant (p = .304). There was no significant difference between spelling accuracy at Post-test 3 and at the pre-intervention assessment (p = .324).
Table 12. Number correct (and percentage correct) in spelling the nonwords before and after the sublexical intervention
Summary
We did not find a substantial difference in Alan’s spelling accuracy for nonwords after the sublexical intervention. Following a decrease in the number of nonwords spelt correctly at Post-test 1, Alan’s spelling accuracy showed an increase at the final post-intervention assessment, though the difference between the final post-test score and the baseline score was not significant.
General discussion
We described the case of Alan, a 10-year-old poor speller who had good reading skills. We explored potential underlying reasons for unexpectedly poor spelling through analysis of spelling performance and assessments of phonological ability, visual memory and letter report. There was no evidence of difficulty in tasks addressing phonological abilities, in line with the results of some previous studies of unexpectedly poor spellers (Holmes & Quinn, Citation2009; Masterson et al., Citation2007). Qualitative analysis of Alan’s spelling errors revealed 56% were phonologically plausible, in line with the rates found in spelling-age and chronological-age comparison groups. This is again in line with results for unexpectedly poor spellers in a number of previous studies (e.g., Frith, Citation1980; Holmes & Quinn, Citation2009), and in support of the indication that Alan’s phonological skills were unimpaired.
When Alan’s visual memory was assessed there was no indication of any difficulty and, in fact, his scores were higher than those reported for control children for memory for designs and visual simultaneous memory. Thus, a visual memory deficit does not seem to have been the underlying difficulty in Alan’s case, as it seems to have been for the adult poor spellers reported by Goulandris and Snowling (Citation1991) and Romani et al. (Citation1999).
Of the three potential underlying abilities that we explored, the one that did indicate a difficulty was letter report. When asked to report all the letters in a briefly presented array, Alan’s score was more than two standard deviations below the mean reported for a same-age comparison group, and he was usually able to report only the first few letters in the array. It is unlikely that this difficulty was due to a problem in verbal short-term memory since the assessment of digit span revealed no evidence of impairment. Alan’s result is in line with that reported for adult unexpectedly poor spellers by Masterson et al. (Citation2007). Analyses looking at whether word frequency or length in letters predicted Alan’s spelling accuracy for words showed that word length was highly significant. The findings together indicate that the locus of the spelling difficulty could be a deficit of the graphemic buffer.
We need to consider why a deficit of the graphemic buffer might affect spelling but leave reading unaffected. There is evidence (e.g., Bowey & Rutherford, Citation2007; Goff, Pratt, & Ong, Citation2005; Ouellette, Citation2006; Ricketts, Nation, & Bishop, Citation2007) that top-down language processes can facilitate word recognition. Assessment of Alan’s receptive vocabulary revealed a standard score of 133 which is in the very high range, and it is possible that his good word reading is achieved by combining partial orthographic information with lexical-semantic knowledge. Other potential reasons for a selective difficulty with spelling have been put forward with regard to acquired graphemic buffer deficit. For example, Hanley and Kay (Citation1998) suggested that a graphemic buffer deficit might only affect reading when the impairment is relatively severe. Comparison across other developmental cases will allow alternative explanations to be tested.
Alan took part in two intervention programmes. In the first, a copy-plus-copy-from memory method was employed with the misspelt words from two baseline assessments. We noted that this method might be expected to be effective in the case of a graphemic buffer deficit since it involves practice in the detailed inspection and retention over time of letter strings, and this may lead to improvement in the ability to spatially code and temporarily store graphemes. We employed flashcard and flashcard with mnemonic cue techniques previously adopted for intervention studies with children (Brunsdon et al., Citation2002, Citation2005; Kohnen, Nickels, Coltheart, et al., Citation2008). In line with previous findings (Brunsdon et al., Citation2002), we did not find an advantage for one technique over the other. However, it is possible that Alan’s parents conducted the home practice in a different way to comply with his preference for the flashcard method. This limitation of the present study could be overcome in future studies by using recording of practice sessions. The results of the first intervention showed a significant improvement for treated words after the intervention and the number of treated words correctly spelt remained high through three post-intervention assessments. It declined in the last post-test assessment, although it was still high in comparison to the pre-intervention baseline result. For words not in the training set, improvement in spelling accuracy was found at the first post-test and at delayed post-testing the improvement was highly significant.
In the investigation of possible factors influencing generalisation, word frequency was found to be a significant predictor of spelling accuracy for the untrained word set. As noted earlier, Kohnen, Nickels, Coltheart, et al. (Citation2008) found printed word frequency and number of orthographic neighbours to predict accuracy of untreated items in their study with a child with lexical spelling difficulty. In the present study, number of orthographic neighbours was not a significant predictor of spelling accuracy. We note that the untrained word set in Khonen et al.’s study consisted of monosyllabic words, which have many more neighbours than the combination of monosyllabic and polysyllabic words that were in Alan’s untrained word set (he was older and had a less severe spelling difficulty than the child in Khonen et al.’s study and so target words were longer and more complex). There was therefore less likelihood of detecting an effect of orthographic neighbourhood size in our study. Khonen et al. offered an explanation for the finding of an effect of word frequency for untrained words in terms of faster strengthening times for high-frequency words during training in a network with bidirectional links between the graphemic buffer and lexicon. However, the authors also noted that the frequency effect for untrained words might simply be due to more opportunities for these words to be encountered (so that more information can be acquired about them) during the course of the intervention. It is not possible to ascertain which explanation might be the correct one for the word-frequency effect that we found for the untrained words at the moment.
With regard to the trained words, regular word accuracy showed a significant improvement as revealed at the first post-test assessment, and accuracy remained stable over the following post-intervention assessments. On the other hand, irregular word accuracy showed an unstable trend: improvement was found at Post-test 1 then there was a slight decrease at Post-test 2, and an increase at Post-test 3. At Post-test 4, there was again a decrease in performance, although the number of irregularly words spelt correctly remained significantly higher than at baseline. It is possible that the intervention strengthened sublexical processes, and this might explain the higher number of regular words than irregular words spelt correctly in the post-test assessments. Brunsdon et al. (Citation2002) found a similar improvement in some aspects of sublexical skills after a lexical treatment programme conducted with TJ, a child with mixed dyslexia. High-frequency regular and irregular words were used in the intervention that involved repeated reading of words presented on flashcards. At the end of the programme, TJ was able to notice congruences of grapheme-phoneme correspondences (e.g., <should> is read like ‘would’ and ‘could’) within the target words, although nonword reading remained impaired. The authors suggested that the training might not exclude the learning of spelling rules.
Analysis of the pre- and post-intervention results for the sublexical treatment revealed a decrease in the number of nonwords spelt correctly at Post-test 1, with a later increase at the last follow-up assessment, which did not differ significantly from the result found at the pre-intervention assessment. The findings from the sublexical intervention support the view that an intervention targeting the deficit will be more effective. However, the outcome may have been due to the sublexical intervention being administered second, or to the intervention technique used not being effective. Unfortunately, we cannot tell if the sublexical intervention may have been more effective if it had been conducted first. It seems important to explore this possibility in future studies.
Although the results from the lexical-orthographic intervention seemed to result in improvement in Alan’s spelling, including the assessment in the standardised spelling test that indicated that his post-intervention score was in the average range, we did not re-test Alan in the letter-report task, which would have provided confirmation that the training had improved his ability to retain sequences of graphemes in memory. It will be informative to investigate the conditions under which intervention for a spelling deficit is effective in further cases who, like Alan, have pronounced spelling difficulty but seemingly unimpaired reading ability.
A further limitation of the present study is that we did not test for a full range of potential cognitive deficits, in particular, with specific tasks to address attentional processes (e.g., tasks using visual and auditory stimuli; Facoetti et al., Citation2010). However, we suggest that the findings indicate that Alan’s spelling difficulty may have been due to a graphemic buffer deficit, and that intervention using the copying technique resulted in an improvement in spelling that was maintained over time. The findings emphasise the importance of investigating a range of potential deficits in unexpectedly poor spellers, and also underline that there are still many unexplored issues relating to the mechanisms underlying improvement in literacy intervention studies.
Acknowledgments
The authors are grateful to Alan and his family for their collaboration, and to the staff and pupils at the schools for their support and participation.
Notes
1We calculated the percentage of misspelt words in baseline 1 for all the three word lists. Alan made 50% of phonologically inappropriate errors including addition (7%), omission (26%), substitution (11%), transposition (11%), addition/transposition (4%), addition/omission (7%), transposition/omission (4%), substitution/omission (15%), addition/substitution (11%), substitution/addition/transposition (4%).
2Least transparent phoneme-grapheme probability values were provided by Spencer (personal communication). Phoneme-grapheme (PG) probability refers to the probability that a particular phoneme is represented by a specific grapheme (e.g., the sound /eI/ has a probability of being represented by the digraph <ei> which is lower than the probability of being represented by the digraph <ay>). The measure used refers to the lowest PG probability in a particular word and was found by Spencer (Citation1999) to be the most significant predictor of a range of PG measures of children’s spelling accuracy.
3In one intervention session, Alan wrote correctly the target word. The misspelt word in one of the two baselines was then taken.
4We considered it important to check whether the difference in improvement in regular and irregular words might be due to a difference in letter length across the word categories (since we had previously established that Alan’s spelling accuracy is affected by letter length). However, no significant correlation between regularity and word length for the untreated or treated words was found (r = .183, p > .05, r = −.112, p > .05, respectively).
References
- Aliminosa, D., McCloskey, M., Goodman-Shulman, R., & Sokol, S. M. (1993). Remediation of acquired dysgraphia as a technique for testing interpretations of deficits. Aphasiology, 7, 55–69. doi: 10.1080/02687039308249499
- Angelelli, P., Marinelli, C. V., & Zoccolotti, P. (2010). Single or dual orthographic representations for reading and spelling? A study of Italian dyslexic–dysgraphic and normal children. Cognitive Neuropsychology, 27, 305–333. doi: 10.1080/02643294.2010.543539
- Barry, C. (1994). Spelling routes (or Roots or Rutes). In G. D. Brown & N. C. Ellis (Eds.), Handbook of spelling: Theory, process and intervention (pp. 27–49). John Wiley & Sons Ltd: Chichester, England.
- Bosse, M.-L., Tainturier, M. J., & Valdois, S. (2007). Developmental dyslexia: The visual attention span deficit hypothesis. Cognition, 104, 198–230. doi: 10.1016/j.cognition.2006.05.009
- Bowey, J. A., & Rutherford, J. (2007). Imbalanced word-reading profiles in eighth-graders. Journal of Experimental Child Psychology, 96, 169–196. doi: 10.1016/j.jecp.2006.11.001
- Broom, Y. M., & Doctor, E. A. (1995a). Developmental surface dyslexia: A case study of the efficacy of a remediation programme. Cognitive Neuropsychology, 12, 69–110. doi: 10.1080/02643299508251992
- Broom, Y. M., & Doctor, E. A. (1995b). Developmental phonological dyslexia: A case study of the efficacy of a remediation programme. Cognitive Neuropsychology, 12, 725–766. doi: 10.1080/02643299508251400
- Bruck, M., & Waters, G. (1990). Effects of reading skill on component spelling skills. Applied Psycholinguistics, 11, 425–437. doi: 10.1017/S0142716400009668
- Brunsdon, R., Coltheart, M., & Nickels, L. (2005). Treatment of irregular word spelling in developmental surface dysgraphia. Cognitive Neuropsychology, 22, 213–251. doi: 10.1080/02643290442000077
- Brunsdon, R. K., Hannan, T. J., Coltheart, M., & Nickels, L. (2002). Treatment of lexical processing in mixed dyslexia: A case study. Neuropsychological Rehabilitation, 12, 385–418. doi: 10.1080/09602010244000174
- Burden, V. (1992). Why are some “normal” readers such poor spellers? In C. M. Sterling & C. Robson (Eds.), Psychology, spelling and education (pp. 200–214). Clevedon, UK: Multilingual Matters.
- Caramazza, A., & Miceli, G. (1990). The structure of graphemic representations. Cognition, 37, 243–297. doi: 10.1016/0010-0277(90)90047-N
- Caramazza, A., Miceli, G., Villa, G., & Romani, C. (1987). The role of the graphemic buffer in spelling: Evidence from a case of acquired dysgraphia. Cognition, 26, 59–85. doi: 10.1016/0010-0277(87)90014-X
- Coltheart, M., & Leahy, J. (1996). Assessment of lexical and nonlexical reading abilities in children: Some normative data. Australian Journal of Psychology, 48, 136–140. doi: 10.1080/00049539608259520
- Crawford, J. R., & Howell, D. C. (1998). Comparing an individual’s test score against norms derived from small samples. The Clinical Neuropsychologist (Neuropsychology, Development and Cognition: Section D) 12, 482–486. doi: 10.1076/clin.12.4.482.7241
- Dubois, M., Kyllingsbæk, S., Prado, C., Musca, S. C., Peiffer, E., Lassus-Sangosse, D., & Valdois, S. (2010). Fractionating the multi-character processing deficit in developmental dyslexia: Evidence from two case studies. Cortex, 46, 717–738. doi: 10.1016/j.cortex.2009.11.002
- Dunn, L., Dunn, M. & Whetton, C. (1997). The British picture vocabulary scale (BPVS) (2nd ed.) London: GL Assessment.
- Facoetti, A., Trussardi, A. N., Ruffino, M., Lorusso, M. L., Cattaneo, C., Galli, R., … Zorzi, M. (2010). Multisensory spatial attention deficits are predictive of phonological decoding skills in developmental dyslexia. Journal of Cognitive Neuroscience, 22, 1011–1025. doi: 10.1162/jocn.2009.21232
- Frederickson, N., Frith, U., & Reason, R. (1997). Phonological assessment battery. London: GL Assessment.
- Forum for Research in Language and Literacy Group. (2012). Diagnostic test of word reading processes. London: GL Assessment.
- Frith, U. (1978). From print to meaning and from print to sound, or how to read without knowing how to spell. Visible Language, 12, 43–54.
- Frith, U. (1980). Unexpected spelling problems. In U. Frith (Ed.), Cognitive processes in spelling (pp. 495–515). New York, NY: Academic Press.
- Frith, U. (1985). Beneath the surface of developmental dyslexia. In K. Patterson, J. Marshall, & M. Coltheart (Eds.), Surface Dyslexia, Neuropsychological and Cognitive Studies of Phonological Reading (pp. 301–330). London: Erlbaum.
- Goff, D.A., Pratt, C., & Ong, B. (2005). The relations between children’s reading comprehension, working memory, language skills, and components of reading decoding in a normal sample. Reading and Writing, 18, 583–616. doi: 10.1007/s11145-004-7109-0
- Goulandris, N. K., & Snowling, M. (1991). Visual memory deficits: A plausible cause of developmental dyslexia? Evidence from a single case study. Cognitive Neuropsychology, 8, 127–154. doi: 10.1080/02643299108253369
- Hanley, J. R., & Kay, J. (1998). Note: Does the graphemic buffer play a role in reading? Cognitive Neuropsychology, 15, 313–318. doi: 10.1080/026432998381195
- Hanley, J. R., Hastie, K., & Kay, J. (1992). Developmental surface dyslexia and dysgraphia: An orthographic processing impairment. The Quarterly Journal of Experimental Psychology Section A, 44, 285–319. doi: 10.1080/02724989243000046
- Hillis, A.E., & Caramazza, A. (1989). The graphemic buffer and attentional mechanisms. Brain and Language, 36, 208–235. doi: 10.1016/0093-934X(89)90062-X
- Holmes, V., & Castles, A. (2001). Unexpectedly poor spelling in university students. Scientific Studies of Reading, 5, 319–350. doi: 10.1207/S1532799XSSR0504_02
- Holmes, V. M., Malone, A. M., & Redenbach, H. (2008). Orthographic processing and visual sequential memory in unexpectedly poor spellers. Journal of Research in Reading, 31, 136–156. doi: 10.1111/j.1467-9817.2007.00364.x
- Holmes, V. M., & Quinn, L. (2009). Unexpectedly poor spelling and phonological-processing skill. Scientific Studies of Reading, 13 (4), 295–317. doi: 10.1080/10888430903001225
- Hulme, C. (1981). Reading retardation and multi-sensory teaching. London: Routledge.
- Judica, A., Luca, M. D., & Spinelli, D. (2002). Training of developmental surface dyslexia improves reading performance and shortens eye fixation duration in reading. Neuropsychological Rehabilitation, 12, 177–197. doi: 10.1080/09602010244000002
- Kohnen, S., Nickels, L., Brunsdon, R., & Coltheart, M. (2008). Patterns of generalisation after treating sub-lexical spelling deficits in a child with mixed dysgraphia. Journal of Research in Reading, 31, 157–177. doi: 10.1111/j.1467-9817.2007.00366.x
- Kohnen, S., Nickels, L., & Coltheart, M. (2010). Training “rule-of-〈E〉”: Further investigation of a previously successful intervention for a spelling rule in developmental mixed dysgraphia. Journal of Research in Reading, 33, 392–413. doi: 10.1111/j.1467-9817.2009.01425.x
- Kohnen, S., Nickels, L., Coltheart, M., & Brunsdon, R. (2008). Predicting generalization in the training of irregular-word spelling: Treating lexical spelling deficits in a child. Cognitive Neuropsychology, 25, 343–375. doi: 10.1080/02643290802003000
- Masterson, J., Colombo, L., Spencer, K., Ftika, K., Quinn, L., & Syntili, A. (2008). Factors affecting the spelling performance of English-, Greek- and Italian-speaking children in grade 1/2. Paper presented at Writing Systems: Analysis, acquisition and use. Institute of Education, University of London.
- Masterson, J., Laxon, V., Lovejoy, S., & Morris, V. (2007). Phonological skill, lexical decision and letter report performance in good and poor adult spellers. Journal of Research in Reading, 30, 429–442. doi: 10.1111/j.1467-9817.2007.00347.x
- Masterson, J., Stuart, M., Dixon, M., & Lovejoy, S. (2010). Children's printed word database: Continuities and changes over time in children's early reading vocabulary. British Journal of Psychology, 101(2), 221–242.
- McCloskey, M., Macaruso, P., & Rapp, B. (2006). Grapheme-to-lexeme feedback in the spelling system: Evidence from a dysgraphic patient. Cognitive Neuropsychology, 23, 278–307. doi: 10.1080/02643290442000518
- Miceli, G., & Capasso, R. (2006). Spelling and dysgraphia. Cognitive Neuropsychology, 23, 110–134. doi: 10.1080/02643290500202730
- Mitchum, C., & Berndt, R. S. (1995). The cognitive neuropsychological approach to treatment of language disorders. Neuropsychological Rehabilitation, 5, 1–16. doi: 10.1080/09602019508520173
- Naglieri, J. A. (1985). Matrix analogies test short form. The Psychological Corporation: San Antonio, TX.
- Niolaki, G. Z., & Masterson, J. (2013). Intervention for a multi-character processing deficit in a Greek-speaking child with surface dyslexia. Cognitive Neuropsychology, 30, 208–232. doi: 10.1080/02643294.2013.842892
- Ouellette, G. P. (2006). What’s meaning got to do with it: The role of vocabulary in word reading and reading comprehension. Journal of Educational Psychology, 98, 554–566. doi: 10.1037/0022-0663.98.3.554
- Paraskevopoulos, I. N., Kalantzi-Azizi, A., & Giannitsas, N. D. (1999). Αθηνά τεστ διάγνωσης δυσκολιών μάθησης – Athena test: Diagnosis of learning difficulties. Athens: Ellinika Grammata.
- de Partz, M.-P. (1995). Deficit of the graphemic buffer: Effects of a written lexical segmentation strategy. Neuropsychological Rehabilitation, 5, 129–147. doi: 10.1080/09602019508520178
- de Partz, M.-P., Seron, X., & Linden, M. V. D. (1992). Re-education of a surface dysgraphia with a visual imagery strategy. Cognitive Neuropsychology, 9, 369–401. doi: 10.1080/02643299208252065
- Perin, D. (1983). Phonemic segmentation and spelling. British Journal of Psychology, 74, 129–144. doi: 10.1111/j.2044-8295.1983.tb01849.x
- Ricketts, J., Nation, K., & Bishop, D. V. M. (2007). Vocabulary is important for some, but not all reading skills. Scientific Studies of Reading, 11, 235–257. doi: 10.1080/10888430701344306
- Rapcsak, S. Z., Henry, M. L., Teague, S. L., Carnahan, S. D., & Beeson, P. M. (2007). Do dual-route models accurately predict reading and spelling performance in individuals with acquired alexia and agraphia? Neuropsychologia, 45, 2519–2524. doi: 10.1016/j.neuropsychologia.2007.03.019
- Rapp, B. (2005). The relationship between treatment outcomes and the underlying cognitive deficit: Evidence from the remediation of acquired dysgraphia. Aphasiology, 19, 994–1008. doi: 10.1080/02687030544000209
- Rapp, B., & Kane, A. (2002). Remediation of deficits affecting different components of the spelling process. Aphasiology, 16, 439–454. doi: 10.1080/02687030244000301
- Romani, C., Ward, J., & Olson, A. (1999). Developmental surface dysgraphia: What is the underlying cognitive impairment? The Quarterly Journal of Experimental Psychology Section A, 52, 97–128. doi: 10.1080/713755804
- Rowse, H. J., & Wilshire, C. E. (2007). Comparison of phonological and whole-word treatments for two contrasting cases of developmental dyslexia. Cognitive Neuropsychology, 24, 817–842. doi: 10.1080/02643290701764207
- Rudra, A. (2005). Cognitive correlates of poor and advanced reading abilities in children. Unpublished PhD Thesis, University of Essex.
- Rust, J., & Golombok, S. (2006). Wechsler individual achievement test second UK edition for teachers. London: Harcourt Assessment.
- Sacre, L., & Masterson, J. (2000). Single word spelling test. London: NfER-Nelson.
- Sage, K., & Ellis, A. (2006). Using orthographic neighbours to treat a case of graphemic buffer disorder. Aphasiology, 20, 851–870. doi: 10.1080/02687030600738945
- Schiller, N. O., Greenhall, J. A., Shelton, J. R., & Caramazza, A. (2001). Serial order effects in spelling errors: Evidence from two dysgraphic patients. Neurocase, 7, 1–14. doi: 10.1093/neucas/7.1.1
- Spencer, K. (1999). Predicting word-spelling difficulty in 7-to 11-year-olds. Journal of Research in Reading, 22, 283–292. doi: 10.1111/1467-9817.00091
- Stadie, N., & van de Vijver, R. (2003). A linguistic and neuropsychological approach to remediation in a German case of developmental dysgraphia. Annals of Dyslexia, 53, 280–299. doi: 10.1007/s11881-003-0013-5
- Stanovich, K. E. (1986). Matthew effects in reading: Some consequences of individual differences in the acquisition of literacy. Reading Research Quarterly, 21(4), 360–407. doi: 10.1598/RRQ.21.4.1
- Tainturier, M. J., & Rapp, B. (2003). Is a single graphemic buffer used in reading and spelling? Aphasiology, 17, 537–562. doi: 10.1080/02687030344000021
- Tainturier, M. J., & Rapp, B. (2001). The spelling process. In B. Rapp (Ed.), What deficits reveal about the human mind/brain: A handbook of cognitive neuropsychology (pp. 1–27). Philadelphia: Psychology Press.
- Valdois, S., Bidet-Ildei, C., Lassus-Sangosse, D., Reilhac, C., N'guyen-Morel, M.-A., Guinet, E., & Orliaguet, J.-P. (2011). A visual processing but no phonological disorder in a child with mixed dyslexia. Cortex, 47, 1197–1218. doi: 10.1016/j.cortex.2011.05.011
- Valdois, S., Bosse, M.-L., Ans, B., Carbonnel, S., Zorman, M., David, D., & Pellat, J. (2003). Phonological and visual processing deficits can dissociate in developmental dyslexia: Evidence from two case studies. Reading and Writing, 16, 541–572. doi: 10.1023/A:1025501406971
- Venezky, R. (1970). The structure of English orthography. Walter de Gruyter: Berlin.
- Wagner, R. K., Torgesen, J. K., & Rashotte, C. (1999). Comprehensive test of phonological processing. Austin: TX: PRO-ED.
- Wechsler, D. (2004). Wechsler intelligence scale for children fourth UK edition. Pearson Publishers: London.
- Weekes, B., & Coltheart, M. (1996). Surface dyslexia and surface dysgraphia: Treatment studies and their theoretical implications. Cognitive Neuropsychology, 13, 277–315. doi: 10.1080/026432996382033
- Yachini, M., & Friedmann, N. (2010). Developmental graphemic buffer dysgraphia. Procedia Social and Behavioral Sciences, 6, 148–149. doi: 10.1016/j.sbspro.2010.08.073
APPENDIX
Alan’s spelling errors in the 60-word list
Spelling errors made by the spelling-age comparison group in the 60-word list