
ABSTRACT
Electrostatic repulsion hydrophilic interaction chromatography (ERLIC) coupled with mass spectrometry (MS) is a technique that is increasingly being used as a trapping/enrichment tool for glycopeptides/phosphorylated peptides or sample fractionation in proteomics research. Here, we describe a novel ERLIC-MS/MS-based peptide mapping method that was successfully used for the characterization of denosumab, in particular the analysis of sequence coverage, terminal peptides, methionine oxidation, asparagine deamidation and glycopeptides. Compared to reversed phase liquid chromatography (RPLC)-MS/MS methods, ERLIC demonstrated unique advantages in the retention of small peptides, resulting in 100% sequence coverage for both the light and heavy chains. It also demonstrated superior performance in the separation and characterization of asparagine deamidated peptides, which is known to be challenging by RPLC-MS/MS. The developed method can be used alone for peptide mapping-based characterization of monoclonal antibodies, or as an orthogonal method to complement the RPLC-MS/MS method. This study extends the applications of ERLIC from that of a trapping/fractioning column to biologic therapeutics characterization. The ERLIC-MS/MS method can enhance biologic therapeutics analysis with more reliability and confidence for bottom-up peptide mapping-based characterization.
Introduction
Monoclonal antibodies are a burgeoning class of therapeutics in development by the biopharmaceutical industry. Since the first approval in 1986, nearly 60 antibodies were marketed globally by 2015.Citation1 In 2016 alone, FDA approved another seven therapeutic antibodies as new molecular entities, representing almost one third of the total new drugs approved in that year.Citation2 Monoclonal antibodies have been developed mainly for the treatment of inflammatory/autoimmune diseases and oncology indicationsCitation3 and, to a lesser extent, the treatment of other diseases such as infectious diseases and neurologic disorders.Citation4,Citation5 Coincident with further advances in immunotherapy technology and protein engineering, monoclonal antibodies are among the fastest growing class of therapeutics in the pharmaceutical industry.Citation6
Monoclonal antibodies contain hundreds of amino acids and changes in any one of them could potentially cause decreased efficacy or increased safety concerns. Unlike traditional small molecule drugs, antibodies are much larger (~ 150 k Da) and are subject to a broad range of enzymatic and non-enzymatic reactions during cell culture production, purification and storage processes, potentially resulting in protein variants. The most common variants include N-terminal pyroglutamate (pE) formation, methionine (M) oxidation, asparagine (N) deamidation, aspartic (D) isomerization, C-terminal lysine (K) truncation and glycosylation.Citation7 In addition, post-translational modifications occur naturally in biological systems, resulting in a heterogeneous mixture of antibody variants rather than a single pure species. Some of these variants have been reported to cause reduced efficacy or side effects.Citation8 During manufacturing process development, examples of sequence mutations and terminal peptide truncation have been reported.Citation9 Thus, it is of high importance to develop robust analytical methods to accurately measure these variants in support of monoclonal antibody manufacturing and finished product characterization. Due to the complex structure and the sophisticated production processes of monoclonal antibodies, the development of analytical methods can be significantly more challenging for antibody therapeutics than for traditional small molecules. The most commonly used tools for the analysis of monoclonal antibodies are charged-based separation techniques, including capillary isoelectric focusing and ion exchange chromatography. Investigation of these separated charge variants generally requires a bottom-up peptide mapping-based approach that includes reversed-phase liquid chromatography coupled with tandem mass detection (RPLC-MS/MS).
Peptide mapping plays a pivotal role in monoclonal antibody characterization, providing, for example, information on post-translational modifications, sequence alterations. Coupled with a mass spectrometer, peptide mapping is the most commonly used characterization tool to further investigate the root causes for formation of different antibody charge variants. In peptide mapping, the monoclonal antibody is firstly digested by enzymes, like trypsin, into short peptides that are subsequently separated and identified by RPLC-MS/MS.Citation10 RPLC-MS/MS has been well established with high resolving capacity in terms of peptides separation, but there are still inherent limitations due to lack of a differentiating hydrophobicity/hydrophilicity. For example, the sequence coverage from single-enzyme RPLC-MS/MS experiments is generally less than 100% because small peptides from the antibody digest are hydrophilic and often elute with the mobile phase solution early in the chromatography, and are thus excluded from introduction into the mass spectrometer.Citation11 As a result, possible mutations or variants on these hydrophilic small peptides would potentially be missed when using RPLC-MS/MS-based characterization. Another challenge is the separation and characterization of asparagine deamidated and non-deamidated peptides, especially in the analysis of large peptides with more than one deamidation sites. These peptides usually have similar hydrophobicity and an overlapped mass spectra profile, and thus separation and discernment by both RPLC and MS for characterization is difficult.Citation12,Citation13 Considering the increasing important role of monoclonal antibodies and their analytical complexity, we aimed to develop a novel peptide mapping method for monoclonal antibody characterization, which could potentially be used as an orthogonal tool for various biologics and peptides characterization.
Electrostatic repulsion hydrophilic interaction chromatography (ERLIC) was first reported by Alpert in 2008.Citation14 Since then, it has become increasingly popular as a trapping/enrichment tool for glycopeptides/phosphorylated peptides or for sample fractionation in proteomics research.Citation15,16,Citation16 The retention mechanism of peptides on ERLIC is considered to be a combination of electrostatic repulsion/attraction and hydrophilic interactions (HILIC) (S2, Supporting Information). HILIC columns have been used for released glycans characterization and biologics formulation excipients characterization.Citation17,Citation18 On ERLIC, the column stationary phase is positively charged and repulses basic peptides back to the mobile phase. Meanwhile, the mobile phase contains a high percentage of organic solvents, resulting in a water layer formed on the stationary phase, which would retain the polar peptides through hydrophilic interaction. Direct separation of a few synthetic peptides was investigated by Alpert, which revealed that the separation methods can be greatly affected by pH, buffer concentrations and buffer types.Citation14 However, due to its complex retention mechanism and the use of non-volatile salts, ERLIC has not been used for direct peptide mapping-based antibody therapeutics characterization. Instead, to take advantage of the unique features of ERLIC, studies generally integrated RPLC with ERLC in a 2D-LC mode, in which ERLIC was either used in the first dimension for sample fractionation, or used in the second dimension to further analyze the purified fraction from RPLC.Citation16,Citation19–Citation21 Recently, a long-length ERLIC (LERLIC) material packed capillary column was used for targeted glutamine deamidation analysis in proteomic study, but with a relatively high run time (1200 min) to achieve satisfactory separation.Citation22 This long run time could potentially introduce method artifacts and dilute the loaded sample, resulting in lower sensitivity. The custom-made capillary column is not be amenable to high-throughput analysis. Due to its complex mechanism of peptide retention on the column, to our best knowledge, direct peptide mapping on ERLIC for biologics characterization has not previously been reported. We thus set out to explore the possibility of coupling ERLIC with a state-of-art high speed orbitrap mass spectrometer for monoclonal antibody characterization.
In this study, we further improved the ERLIC approach by introducing a new method that includes a combination of a pH gradient and a water/acetonitrile gradient. The method powers ERLIC as an easy, one-dimension liquid chromatography for peptides separation. Compared with the most recent LERLIC, our method uses a regular-size packed column instead of a capillary column; this improvement is much more user-friendly for different labs and has fewer risks of variations. The improved one-dimensional method makes ERLIC easier to use and facilitates implementation compared with its traditional uses in two-dimensional settings.
Compared with traditional RPLC-MS/MS used for antibody variant characterizations, ERLIC-MS/MS, with unique advantages over the separation of deamidated peptides, requires less running time but yields similar results. This feature could reduce time spent on method development and running samples, leading to reduced cost and increased efficiency for biopharmaceutical companies. ERLIC-MS/MS would also simplify antibody sequence coverage studies by providing 100% sequence coverage of small peptides using a single digest enzyme. In comparison, to achieve the same goal, an RPLC-MS/MS-based method has to rely on missed cleavage, or two different enzyme systems, which is less certain, time-consuming and incurs extra costs.
Results
Separation method development
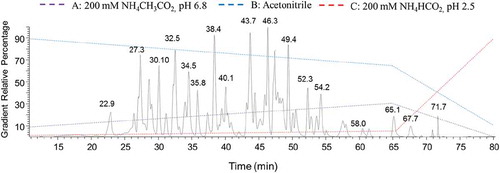
Because ERLIC has a complex mechanism in terms of retaining peptides, a number of parameters, including pH, salt and the water/acetonitrile gradient, need to be finely screened and optimized to enable separation of a mixture of even a few peptides.Citation14 A combination of electrostatic repulsion/attraction and hydrophilic interactions is involved. In essence, the positively charged and/or non-polar peptides will be repulsed or attracted into the elution phase, while acidic and/or polar peptides will be bound or attracted to the stationary phase. Other mechanisms, including tryptic peptide C-terminus zwitterion formation, which directs peptide orientation towards the stationary phase, were also investigated by Alpert et al.Citation23 In our study, we aimed to couple ERLIC with a mass spectrometer for peak identification. To be compatible with the mass spectrometer, the method development initially started with an acetonitrile/water gradient containing 0.1% formic acid, but the basic peptides were poorly separated. This could be explained by the basic peptides being positively charged in a neutral or acidic environment and repulsed from the stationary phase. Subsequently, the method was modified with increased pH and addition of ammonium salt, with gradients of acetonitrile/water and a constant 200 mM ammonium formate buffer at pH 4.5. Under this condition, basic peptides were better separated. However, with the addition of salt and an increased pH value, the acidic peaks were bound tightly with the column through electrostatic interaction and detected as late eluting peaks. In some cases, acidic peptides with low pI values were bound too strongly to be eluted from the column. After a series of method optimizations, a finely tuned method with a combination of pH and H2O/ACN gradients, plus the addition of ammonium salt, was developed. A representative chromatogram is shown in . The pH gradient was achieved by gradually increasing the ratio of ammonium acetate (pH 6.8) to ammonium formate (pH 2.5). Comparison of gradient 1 and 2 shows that a shallower pH and H2O/ACN gradient yields a better separation profile (S5, Supporting Information).
Figure 1. Representative gradient 2 and the base peak chromatogram of the denosumab tryptic peptides on ERLIC-MS/MS.
Peptides analysis
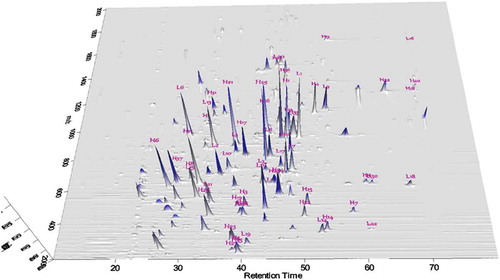
The overall resolving power of ERLIC was not as high as for the RPLC method; however, second dimension separation was easily achieved by the high speed, high resolution orbitrap mass spectrometer, which could fragment 10 ions in a cycle time of 1 second for peptide identification.Citation24 As shown in , the tryptic peptides were clearly separated on the ERLIC-MS/MS in two-dimensional scale. In our ERLIC-MS/MS analysis, each tryptic peptide was successfully identified by accurate mass, some of which were further confirmed by their MS/MS fragment ions when necessary. The sequence coverage by ERLIC was 100% for both the light and heavy chains. The peptide identities were also labelled in according to sequence. Detailed sequence information, measured masses, retention times of both light chain and heavy chain peptides are provided in S7 and S8 (Supporting Information). Some unlabeled peaks in are mainly due to contribution from different mass/charge ratios (m/z value) of the same peptide, missed cleavages or non-specific cleavages. Since, in an optimized process, the ERLIC column readily retains small peptides and even single amino acids with proper solvents selection and running gradient, it should be possible to retain the entirety of tryptic digests of monoclonal antibodies with 100% sequence coverage. Small hydrophilic peptides of denosumab were successfully retained and identified from the ERLIC-MS/MS data (S9, Supporting Information). Comparatively, RPLC-MS/MS-based peptide mapping generally voids small hydrophilic peptides, resulting in sequence coverages of less than 100%. The results clearly demonstrated ERLIC-MS/MS as a potentially powerful tool in the bottom-up characterization of monoclonal antibodies for sequence coverage analysis, fingerprint analysis and other sequence-based analyses.
Figure 2. 2D presentation of ERLIC-MS/MS based peptide mapping of denosumab tryptic peptides (gradient 2).
Since the ERLIC separation mechanisms involve charge and hydrophilicity interactions, we hypothesized that there would be a relationship between the retention time on ERLIC and the peptide pI value and hydrophilicity. This relationship was proven in this experiment by a negative correlation between peptides pI values and retention times (S6, Supporting Information). Peptides with lower pI values have longer retention times. This would be explained by the electrostatic interactions between the peptides and the column, as basic peptides with high pI values are repulsed from the stationary phase with less binding and reduced retention times. Peptide retention time on ERLIC would also be affected by peptide hydrophilicity, which would explain why peptides with close pI values have different retention times. This observed relationship indicated that the peptide retention pattern on ERLIC would be theoretically calculated from its sequence. Similar approaches on peptide retention time calculations have been demonstrated on RPLC, hydrophilic interaction chromatography (HILIC) and capillary zone electrophoresis-based peptide separations.Citation25–Citation28 The potential for retention time prediction would serve as an orthogonal tool to further confirm the peptide identities deduced from mass spectra fragments and reduce the false identification of peptides during protein characterization.
Protein variants analysis
A number of enzymatic and non-enzymatic variants/modifications on the tested antibody are considered critical quality attributes (CQA) in biologics development. Further analysis of these variants was performed on ERLIC-MS/MS. As shown in , the major charge variant peptides, including terminal peptides, methionine-oxidized peptides, asparagine deamidated peptides, and glycopeptides were successfully identified based on their molecular ions and fragment ions on ERLIC-MS/MS. All results correlated well with data from RPLC-MS/MS-based peptide mapping.
Table 1. The characterization of major variant peptides of denosumab (gradient 2).
Terminal peptides
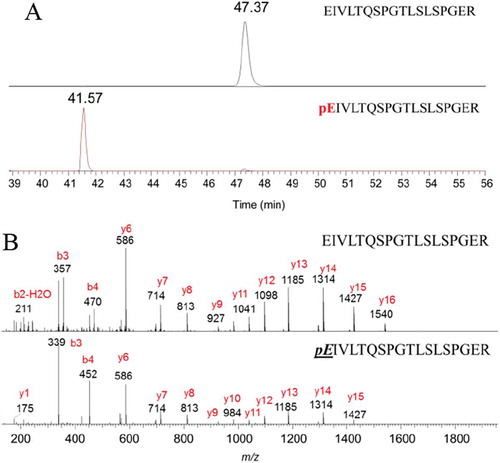
N-terminal pyroglutamate (pE) formation is one of the many post-translational modifications commonly observed during the manufacturing and storage of monoclonal antibodies. Both N-terminal glutamine (Q) and glutamic acid (E) can spontaneously cyclize to form pyroglutamate in vitro, with glutamic acid (E) conversion to pE observed at a slower rate than for glutamine (Q).Citation29 Formation of pE from glutamine (Q) results in loss of one amine group to generate an acidic variant.Citation30 On denosumab, the N-termini of both light chain and heavy chain have glutamic acid (E). On the light chain, the peptide retention time decreased from 49.4 min to 43.5 min after the conversion from E to pE. The measured pE formation percentage was 0.16%. On the heavy chain, the peptide retention time decreased from 47.4 min to 41.6 min after the conversion from E to pE, and pE formation percentage was 0.06% (). The decreased retention time is likely due to decreased peptide hydrophilicity and a higher peptide pI value, as pyroglutamate is less hydrophilic and less acidic than glutamic acid.
Figure 3. Representative chromatograms and mass spectra of terminal peptides (gradient 2). (A) The extracted ion chromatograms of N-terminal peptide of heavy chain; (B) The MS2 mass spectra of N-terminal peptide of heavy chain.
C-terminal lysine variation is also commonly observed in therapeutic monoclonal antibodies. Although this modification does not affect drug bioactivity, it can contribute to the formation of charge variants and is generally monitored to demonstrate manufacturing consistency. The C-terminal peptide SLSLSPGK has a pI value of 10.04 and a retention time of 33.0 min. After lysine truncation, we observed that the peptide had a decreased retention time of 28.6 min with a lower pI value of 5.974 (S10, Supporting Information), contradicting the general principle discussed before where peptides with higher pI values have relatively shorter retention times. This could be explained by the decreased hydrophilicity after the loss of lysine. The measured percentage of C-terminal lysine truncation by integrated EIC intensity was 99.03%. The measured variants percentages of terminal peptides correlated well with the RPLC-MS-based method.
Methionine oxidation
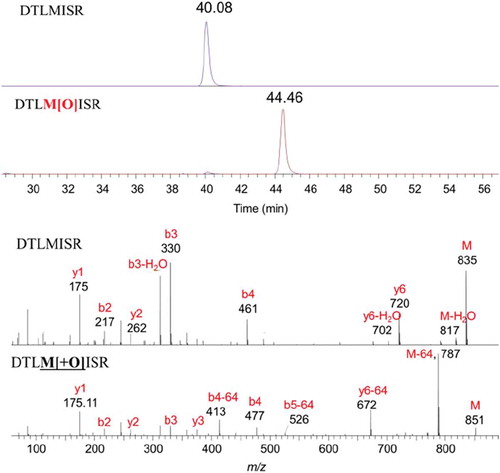
A number of amino acids, such as methionine, cysteine, tryptophan and lysine, have the potential to be oxidized by reactive oxygen species. Among them, methionine is often the most susceptible residue to be oxidized, especially when exposed on the surface of the antibody with more accessibility to solvents and reactive oxygen species. Methionine oxidation can lead to decreased therapeutic effects and antibody stability.Citation31 In this study, ERLIC-MS/MS was successfully applied for the characterization of methionine oxidation. Based on previous studies, methionine residues identified as prone to oxidation included M85, M106, M253 and M398. As shown in , representative peptide H17-DTLMISR and its oxidized form were successfully extracted from the total ion chromatogram and further confirmed by their accurate molecular ions and MS2 fragment ions. Signature fragment ion, M-64 Da, which corresponds to the neutral loss of methanesulfenic acid (-CH3SOH), was also observed in the MS2 spectrum.Citation32 After methionine oxidation, the peptide retention time of H17 increased from 40.1 min to 44.5 min. As shown in , this retention time shift was also consistently observed in other methionine peptides, which could be explained by the increased peptide hydrophilicity after oxidation. The percentages of methionine oxidation measured by ERLIC-MS/MS were close to the data from traditional RPLC-MS/MS.
Figure 4. Representative chromatograms and mass spectra of methionine-containing peptides H17 and its oxidized form (gradient 2).
Deamidation
Deamidation of asparagine (Asn, N) to aspartic acid (Asp, D) and/or isoaspartic residues (iso Asp, isoD) is a common non-enzymatic degradation pathway of monoclonal antibodies. Deamidation can introduce a negative charge to the antibody and affect antibody shelf-life if not formulated appropriately.Citation33 If the deamidation site is located in the complementarity-determining region, it can significantly reduce target binding affinity and therapeutic effects.Citation34,Citation35 Therefore, it is important to accurately measure the percentage of deamidation formation and monitor its changes during different stages of monoclonal antibody production and storage. Characterization of deamidated asparagine on a protein molecule is challenging and the most common and efficient way is to apply a bottom-up peptide mapping method by RPLC-MS/MS. However, as peptide size increases, the peptide hydrophobicity differences between deamidated and non-deamidated peptides become very narrow, resulting in a separation challenges by RPLC-MS/MS.Citation36 In addition, the molecular weight of a deamidated peptide is only ~ 1 Dalton heavier than the non-deamidated peptide and overlap of isotopic peaks can further complicate the analysis. Therefore, to further distinguish the two species on a mass spectrometer can be challenging.
Method development for RPLC-MS/MS generally requires substantial effort and fine-tuning for the separations. For example, the tryptic peptide “GFYPSDIAVEWESNGQPENNYK” (also known as PENNY peptide), located in the Fc constant region of the monoclonal antibody, has been widely studied because it appears in the majority of monoclonal antibody drugs approved or in development. Even after years of research on the PENNY peptide using RPLC-MS/MS, there is still a need for a more robust analytical method for its characterization.Citation13,Citation33,Citation36–Citation38 The PENNY peptide has three asparagine residues: N385, N390 and N391. Two of these, N385 and N390, are prone to deamidate and each residue can potentially form three deamidated products (succinimide intermediate, isoaspartic acid and aspartic acid). Combined with the inherent difficulties of deamidation separations on RPLC and MS, it can be difficult to fully characterize the PENNY peptide with a high level of accuracy and assurance.
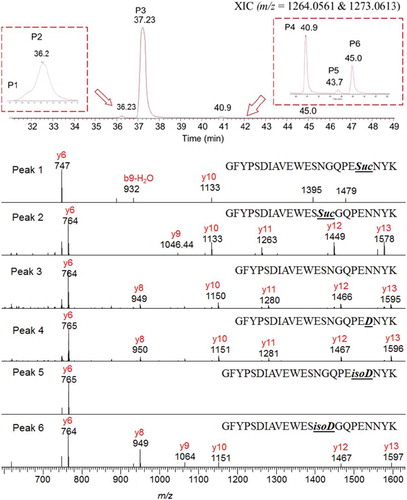
In our study, ERLIC demonstrated superior capability in the characterization of deamidated peptides of a monoclonal antibody. As shown in , robust baseline separation of Asp and isoAsp deamidated products (Peaks 4, 5 and 6) from the non-deamidated peptide (Peak 3) was readily achieved using Gradient 1. The mass profiles of deamidated peptides (Peaks 4, 5 and 6) are ~ 1 Dalton heavier than the original peptide of Peak 3 (S11, Supporting Information). The site of deamidation was also identified by analysis of MS2 fragment ions and the major fragment ions are labelled accordingly in . Peaks 4 and 5 were identified as deamidation at position N390 because they contained the signature fragment ion y6 with m/z 765, corresponding to fragment [PEDNYK+ H]+ or [PEisoDNYK+ H]+. Peak 6 was identified as deamidation at position N385 by the b14 ion [GFYPSDIAVEWESD+ H]+ or [GFYPSDIAVEWESisoD+ H]+. It was reported that the isoAsp peptide was more acidic and eluted later than the Asp peptide on the ERLIC column;Citation20 therefore Peak 4 was tentatively assigned as 390Asp and Peak 5 as 390isoAsp, which needs to be further confirmed through comparison with synthetic peptides. In the Gradient 1 method, the retention time differences were sufficiently large between non-deamidated Peak 3 (37.23 min) and deamidated Peak 4 (40.9 min), Peak 5 (43.7 min) and Peak 6 (45.0 min). Each deamidated peak was also well separated from each other. For characterization of deamidation, ERLIC-MS/MS required less time and effort for method development, resulting in superior separation capacity, than for the RPLC-MS/MS method. The ERLIC method was also successfully applied for the monitoring of succinimide intermediate 390Suc (Peak 1) and 385Suc (Peak 2) formation from the same analysis. The mass shift was approximately 17 Daltons lower as shown in the mass spectra due to the loss of an ammonium molecule (S11, Supporting Information). The identification and differentiation are based on detection of signature peptide y6, which is m/z 747 [PESucNYK+ H]+ for Peak 1 and m/z 764 [PENNYK+ H]+ for Peak 2. As shown in , the succinimide intermediates Peak 1 and Peak 2 eluted earlier than the original peptide, which is due to the decreased hydrophilicity after the formation of the succinimide ring and the loss of an amine group.
Figure 5. (A) The separation of non-deamidated and deamidated peptides of “GFYPSDIAVEWESNGQPENNYK” in gradient 1. (B) The MS2 fragment ion mass spectra analysis of labelled peaks.
Glycosylation
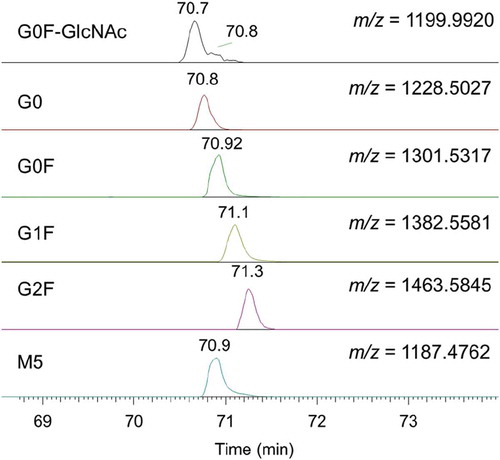
Glycosylation increases monoclonal antibody heterogeneity by the incorporation of a number of different glycans on the heavy chain. It is one of the most complex and prominent forms of protein post-translational modification. Glycosylation can affect monoclonal antibody structural stability, biological activity, immunogenicity and pharmacokinetics.Citation39 The characterization of antibody glycosylation can be divided into the following three analytical strategies: top-down (intact protein), bottom-up (glycopeptide) and released glycans.Citation40 The bottom-up peptide mapping-based characterization is also typically performed on RPLC-MS/MS. The most common glycopeptide on monoclonal antibodies is H20 (294EEQFNSTFR302) with different glycans attached at N298. ERLIC-MS/MS was also used for glycopeptide analysis and demonstrated similar capability as RPLC-MS/MS in the characterization of tryptic peptide H20 (294EEQFNSTFR302) with different glycans attached. As shown in , the detected glycopeptides (G0F-GlcNAc, G0, G0F, G1F, G2F and M5) were successfully extracted from the total ion chromatogram by their accurate masses. The percentage of each glycoform was estimated by the integrated intensity from each extracted ion chromatogram. The most abundant glycopeptide species were G0F (64.6%) and G1F (14.6%). The results correlated well with results from our intact analysis, released glycan analysis and RPLC-MS/MS-based glycopeptide characterization. It was interesting to note that the glycopeptide retention times followed the order: [G0F-GlcNAc] (70.7 min) < [G0] (70.8 min) < [G0F] (70.9 min) < [G1F] (71.1 min) < [G2F] (71.3 min). This observation suggested that the increasing size of the glycans on the glycopeptide increased the retention time on the ERLIC column. This could be explained by the increased hydrophilicity from the addition of extra sugar moieties. Similar to RPLC, the major glycoforms all elute in a narrow retention time window, but can be easily resolved by a mass spectrometer. The glycopeptide identities were determined based on their accurate masses and isotopic mass profiles and fragment ions. The results clearly demonstrated that ERLIC-MS/MS can be applied for glycopeptide characterization.
Figure 6. The extracted ion chromatograms of major glycopeptides in monoclonal antibody denosumab (gradient 2).
Discussion
In this study, a novel ERLIC-MS/MS method was developed and successfully applied for the characterization of IgG2 monoclonal antibody denosumab, including sequence coverage and variant analysis. Due to its unique separation mechanism, ERLIC-MS/MS was successfully used for identification of all peptides from a trypsin digest, including small peptides and even single amino acids, with 100% sequence coverage. The relationship between peptide retention time and pI values was observed with inverse correlation between retention times and pI values. The most common charge variants (i.e., C-terminal pyroglutamate formation, N-terminal lysine truncation and asparagine deamidation) were successfully characterized by ERLIC-MS/MS with results similar to those obtained from traditional RPLC-MS/MS. More importantly, ERLIC demonstrated superior capability in the separation of deamidated and non-deamidated peptides as demonstrated by analysis of the “PENNY” peptide in the Fc region. Finally, the ERLIC-MS/MS method was successfully used for the analysis of methionine oxidation and glycosylation, demonstrating broad utility for characterizing multiple product variant attributes in a single run. The results clearly demonstrated that ERLIC can be used as a useful tool in monoclonal antibody characterization either alone or as an orthogonal method to validate the results from RPLC-MS/MS. Since the ERLIC column is still in the early stages of development, commercially availability is somewhat limited. However, it is reasonable to expect that, with the further advancement of ERLIC technologies, ERLIC-MS/MS could play an increasing role for the detailed and multi-attribute characterization of monoclonal antibodies and other biologics products. ERLIC-MS/MS could also be used for other biologics attributes monitoring besides antibodies. It would also be used for protein degradation products analysis. The method would potentially save time and cost for biopharmaceuticals characterization.
Materials and methods
Reagents and chemicals
The model antibody denosumab used in this study was produced by Amgen (Thousand Oaks, CA). The ERLIC column PolyWAX LP 100 × 2.1 mm, 3 µm, 300 Å was purchased from PolyLC Inc. (Columbia, MD). Based on information from manufacturer, in the PolyWAX LP column material, linear polyethyleneimine (PEI) was used for absorption to the porous, microparticulate silicas and formed a strong and stable layer of crosslinked hydrophilic surface. At pH 4 or below, the amine residues are very well charged and the column will perform like in a strong anion exchange mode.Citation41 Reagents dithiothreitol (DTT), iodoacetamide, tris-HCl buffer, ammonium formate and ammonium acetate were purchased from Thermo Fisher Scientific (Waltham, MA). Guanidine buffer and formic acid (FA) were purchased from Sigma Aldrich (St. Louis, MO). Trypsin/Lys-C mixture was purchased from Promega (Madison, WI). Zeba spin desalting columns (7K MWCO, 0.5 mL) was purchased from Thermo Fisher Scientific (Waltham, MA).
Analytical method
The sample preparation is described in S3 (Supporting Information). ERLIC-MS/MS was performed on a Waters Acquity UPLC system coupled to a Q-Exactive plus orbitrap mass spectrometer. The mass spectra raw data was analyzed using Thermo Xcalibur and PepFinder 2.0. The autosampler was kept at 5°C. The column temperature was kept at 40°C. In the process of method development, a number of method parameters were evaluated, including variation of pH, salts and ACN/H2O gradients. Two representative methods to demonstrate the separation features contributed by each running buffers solution and their ratios in the mixture are described here. Solvent A: 200 mM NH4CH3CO2, pH 6.8, solvent B: acetonitrile and solvent C: 200 mM NH4HCO2, pH 2.5. The flow rate is 0.2 ml/min. Gradient 1 (S5, Supporting Information) starts from 5% A, 95% B and 0% C to 30% A, 55% B and 15% C in 50 min. Then the gradient was further increased to 0% A, 10% B and 90% C at 80 min and kept until 85 min. Then the gradient was decreased to original 5% A, 95% B and 0% C at 87 min and kept to equilibrate the column for 5 min. Gradient 2 () from starts from 5% A, 95% B and 0% C to 30% A, 65% B and 5% C in 65 min. Then the gradient was further increased to 0% A, 10% B and 90% C at 80 min and kept until 85 min. Then the gradient was decreased to original 5% A, 95% B and 0% C at 87 min and kept to equilibrate the column for 5 min. The pI value of each peptide was estimated based on isoelectric point calculator (IPC), a web service providing accurate estimation of protein and peptide pI values. The values used in this study are the measured IPC peptide pI values.Citation42 The mass spectrometer setting is described in S4 (Supporting Information).
Abbreviations
| CAN | = | Acetonitrile |
| CQA | = | Critical quality attributes |
| ERLIC-MS | = | Electrostatic repulsion hydrophilic interaction chromatography-mass spectrometry |
| LERLIC | = | Long-length electrostatic repulsion hydrophilic interaction chromatography |
| HILIC | = | Hydrophilic interaction chromatography |
| RPLC-MS | = | Reverse phase liquid chromatography – mass spectrometry |
Supplemental Material
Download MS Word (1.2 MB)Acknowledgments
We gratefully thank the advice from Amos Heckendorf (The Nest Group, Inc) and Andrew Alpert (PolyLC, Inc) on column selection and ERLIC background information. Jing Zhen also sincerely thanks Jacob Bongers for the internship training on mass spectrometry-based biologics characterization.
Supplemental material
Supplemental data for this article can be accessed here.
References
- Ecker DM, Jones SD, Levine HL. The therapeutic monoclonal antibody market. MAbs. 2015;7:9–14. doi:10.4161/19420862.2015.989042.
- Mullard A. 2016 FDA drug approvals. Nat Rev Drug Discov. 2017;16:73–76. doi:10.1038/nrd.2017.14.
- Shepard HM, Phillips GL, Thanos CD, Feldmann M. Developments in therapy with monoclonal antibodies and related proteins. Clin Med (Lond). 2017;17:220–232. doi:10.7861/clinmedicine.17-3-220.
- Hey A. History and practice: antibodies in infectious diseases. Microbiol Spectr. 2015;3:AID-0026–2014. doi:10.1128/microbiolspec.AID-0026-2014.
- Novak JC, Lovett-Racke AE, Racke MK. Monoclonal antibody therapies and neurologic disorders. Arch Neurol. 2008;65:1162–1165. doi:10.1001/archneur.65.9.1162.
- Walsh G. Biopharmaceutical benchmarks 2014. Nat Biotechnol. 2014;32:992–1000. doi:10.1038/nbt.3040.
- Liu H, Ponniah G, Zhang H-M, Nowak C, Neill A, Gonzalez-Lopez N, Patel R, Cheng G, Kita AZ, Andrien B. In vitro and in vivo modifications of recombinant and human IgG antibodies. MAbs. 2014;1145–1154. doi:10.4161/mabs.29883.
- Struble E, Kirschbaum N, Liu J, Marszal E, Shapiro M. Protein Therapeutics. Topics in Medicinal Chemistry. Vol. 21. Cham: Springer. doi:10.1007/7355_2015_5005.
- Gramer MJ. Product quality considerations for mammalian cell culture process development and manufacturing. Adv Biochem Eng Biotechnol. 2014;139:123–166. doi:10.1007/10_2013_214.
- Bongers J, Cummings JJ, Ebert MB, Federici MM, Gledhill L, Gulati D, Hilliard GM, Jones BH, Lee KR, Mozdzanowski J, et al. Validation of a peptide mapping method for a therapeutic monoclonal antibody: what could we possibly learn about a method we have run 100 times?. J Pharm Biomed Anal. 2000;21:1099–1128.
- Højrup P. Proteolytic peptide mapping. HPLC of Peptides and Proteins: Methods and Protocols. 2004;251:227–244.
- Gaza-Bulseco G, Li B, Bulseco A, Liu H. Method to differentiate asn deamidation that occurred prior to and during sample preparation of a monoclonal antibody. Anal Chem. 2008;80:9491–9498. doi:10.1021/ac801617u.
- Ren D, Ratnaswamy G, Beierle J, Treuheit MJ, Brems DN, Bondarenko PV. Degradation products analysis of an Fc fusion protein using LC/MS methods. Int J Biol Macromol. 2009;44:81–85. doi:10.1016/j.ijbiomac.2008.10.006.
- Alpert AJ. Electrostatic repulsion hydrophilic interaction chromatography for isocratic separation of charged solutes and selective isolation of phosphopeptides. Anal Chem. 2008;80:62–76. doi:10.1021/ac070997p.
- Alpert AJ, Hudecz O, Mechtler K. Anion-exchange chromatography of phosphopeptides: weak anion exchange versus strong anion exchange and anion-exchange chromatography versus electrostatic repulsion-hydrophilic interaction chromatography. Anal Chem. 2015;87:4704–4711. doi:10.1021/ac504420c.
- Boichenko AP, Govorukhina N, Van Der Zee AG, Bischoff R. Multidimensional separation of tryptic peptides from human serum proteins using reversed-phase, strong cation exchange, weak anion exchange, and fused-core fluorinated stationary phases. J Sep Sci. 2013;36:3463–3470. doi:10.1002/jssc.201300750.
- Rogers RS, Nightlinger NS, Livingston B, Campbell P, Bailey R, Balland A. Development of a quantitative mass spectrometry multi-attribute method for characterization, quality control testing and disposition of biologics. MAbs. 2015;7:881–890. doi:10.1080/19420862.2015.1069454.
- Wang C, Yamniuk A, Dai J, Chen S, Stetsko P, Ditto N, Zhang Y. Investigation of a degradant in a biologics formulation buffer containing L-histidine. Pharm Res. 2015;32:2625–2635. doi:10.1007/s11095-015-1648-8.
- Loroch S, Schommartz T, Brune W, Zahedi RP, Sickmann A. Multidimensional electrostatic repulsion–hydrophilic interaction chromatography (ERLIC) for quantitative analysis of the proteome and phosphoproteome in clinical and biomedical research. Biochimica Et Biophysica Acta (Bba)-Proteins and Proteomics. 2015;1854:460–468. doi:10.1016/j.bbapap.2015.01.006.
- Hao P, Qian J, Dutta B, Cheow ESH, Sim KH, Meng W, Adav SS, Alpert A, Sze SK. Enhanced separation and characterization of deamidated peptides with RP-ERLIC-based multidimensional chromatography coupled with tandem mass spectrometry. J Proteome Res. 2012;11:1804–1811. doi:10.1021/pr201048c.
- Hao P, Guo T, Li X, Adav SS, Yang J, Wei M, Sze SW. Novel application of electrostatic repulsion-hydrophilic interaction chromatography (ERLIC) in shotgun proteomics: comprehensive profiling of rat kidney proteome. J Proteome Res. 2010;9:3520–3526. doi:10.1021/pr100037h.
- Serra A, Gallart-Palau X, Wei J, Sze SK. Characterization of glutamine deamidation by long-length electrostatic repulsion-hydrophilic interaction chromatography-tandem mass spectrometry (LERLIC-MS/MS) in shotgun proteomics. Anal Chem. 2016;88:10573–10582. doi:10.1021/acs.analchem.6b02688.
- Alpert AJ, Petritis K, Kangas L, Smith RD, Mechtler K, Mitulovic G, Mohammed S, Heck AJR. Peptide orientation affects selectivity in ion-exchange chromatography. Anal Chem. 2010;82:5253–5259. doi:10.1021/ac100651k.
- Michalski A, Damoc E, Hauschild J-P, Lange O, Wieghaus A, Makarov A, Nagaraj N, Cox J, Mann M, Horning S. Mass spectrometry-based proteomics using Q Exactive, a high-performance benchtop quadrupole Orbitrap mass spectrometer. Mol Cell Proteomics. 2011;10:M111. 011015. doi:10.1074/mcp.M111.011015.
- Krokhin OV, Anderson G, Spicer V, Sun L, Dovichi NJ. Predicting electrophoretic mobility of tryptic peptides for high-throughput CZE-MS analysis. Anal Chem. 2017;89:2000–2008. doi:10.1021/acs.analchem.6b04544.
- Krokhin OV, Ezzati P, Spicer V. Peptide retention time prediction in hydrophilic interaction liquid chromatography: data collection methods and features of additive and sequence-specific models. Anal Chem. 2017;89:5526–5533. doi:10.1021/acs.analchem.7b00537.
- Petritis K, Kangas LJ, Yan B, Monroe ME, Strittmatter EF, Qian WJ, Adkins JN, Moore RJ, Xu Y, Lipton MS, et al. Improved peptide elution time prediction for reversed-phase liquid chromatography-MS by incorporating peptide sequence information. Anal Chem. 2006;78:5026–5039. doi:10.1021/ac060143p.
- Gilar M, Jaworski A, Olivova P, Gebler JC. Peptide retention prediction applied to proteomic data analysis. Rapid Commun Mass Spectrom. 2007;21:2813–2821. doi:10.1002/rcm.3150.
- Liu YD, Goetze AM, Bass RB, Flynn GC. N-terminal glutamate to pyroglutamate conversion in vivo for human IgG2 antibodies. J Biol Chem. 2011;286:11211–11217. doi:10.1074/jbc.M110.185041.
- Chelius D, Jing K, Lueras A, Rehder DS, Dillon TM, Vizel A, Rajan RS, Li T, Treuheit MJ, Bondarenko PV. Formation of pyroglutamic acid from N-terminal glutamic acid in immunoglobulin gamma antibodies. Anal Chem. 2006;78:2370–2376. doi:10.1021/ac051827k.
- Pan H, Chen K, Chu L, Kinderman F, Apostol I, Huang G. Methionine oxidation in human IgG2 Fc decreases binding affinities to protein A and FcRn. Protein Sci. 2009;18:424–433. doi:10.1002/pro.45.
- Guan Z, Yates NA, Bakhtiar R. Detection and characterization of methionine oxidation in peptides by collision-induced dissociation and electron capture dissociation. J Am Soc Mass Spectrom. 2003;14:605–613. doi:10.1016/S1044-0305(03)00201-0.
- Pace AL, Wong RL, Zhang YT, Kao YH, Wang YJ. Asparagine deamidation dependence on buffer type, pH, and temperature. J Pharm Sci. 2013;102:1712–1723. doi:10.1002/jps.23529.
- Vlasak J, Bussat MC, Wang S, Wagner-Rousset E, Schaefer M, Klinguer-Hamour C, Kirchmeier M, Corvaïa N, Ionescu R, Beck A. Identification and characterization of asparagine deamidation in the light chain CDR1 of a humanized IgG1 antibody. Anal Biochem. 2009;392:145–154. doi:10.1016/j.ab.2009.05.043.
- Khawli LA, Goswami S, Hutchinson R, Kwong ZW, Yang J, Wang X, Yao Z, Sreedhara A, Cano T, Tesar D, et al. Charge variants in IgG1: isolation, characterization, in vitro binding properties and pharmacokinetics in rats. MAbs. 2010;613–624. doi:10.4161/mabs.2.6.13333.
- Leblanc Y, Ramon C, Bihoreau N, Chevreux G. Charge variants characterization of a monoclonal antibody by ion exchange chromatography coupled on-line to native mass spectrometry: case study after a long-term storage at +5 degrees C. J Chromatogr B Analyt Technol Biomed Life Sci. 2017;1048:130–139. doi:10.1016/j.jchromb.2017.02.017.
- Yin S, Pastuskovas CV, Khawli LA, Stults JT. Characterization of therapeutic monoclonal antibodies reveals differences between in vitro and in vivo time-course studies. Pharm Res. 2013;30:167–178. doi:10.1007/s11095-012-0860-z.
- Du Y, Walsh A, Ehrick R, Xu W, May K, Liu H. Chromatographic analysis of the acidic and basic species of recombinant monoclonal antibodies. MAbs. 2012;578–585. doi:10.4161/mabs.21328.
- Higel F, Seidl A, Sörgel F, Friess W. N-glycosylation heterogeneity and the influence on structure, function and pharmacokinetics of monoclonal antibodies and Fc fusion proteins. Eur J Pharmaceutics Biopharmaceutics. 2016;100:94–100. doi:10.1016/j.ejpb.2016.01.005.
- Sinha S, Pipes G, Topp EM, Bondarenko PV, Treuheit MJ, Gadgil HS. Comparison of LC and LC/MS methods for quantifying N-glycosylation in recombinant IgGs. J Am Soc Mass Spectrom. 2008;19:1643–1654. doi:10.1016/j.jasms.2008.07.004.
- Alpert AJ, Regnier FE. Preparation of a porous microparticulatee anion-exchange chromatography support for proteins. J Chromatogr. 1979;185:375–392. doi:10.1016/S0021-9673(00)85615-0.
- Kozlowski LP. IPC – isoelectric point calculator. Biology Direct. 2016;11:55. doi:10.1186/s13062-016-0159-9.