
 ?Mathematical formulae have been encoded as MathML and are displayed in this HTML version using MathJax in order to improve their display. Uncheck the box to turn MathJax off. This feature requires Javascript. Click on a formula to zoom.
ABSTRACT
The development of mechanism-based, multiscale pharmacokinetic–pharmacodynamic (PK-PD) models for chimeric antigen receptor (CAR)-T cells is needed to enable investigation of in vitro and in vivo correlation of CAR-T cell responses and to facilitate preclinical-to-clinical translation. Toward this goal, we first developed a cell-level in vitro PD model that quantitatively characterized CAR-T cell-induced target cell depletion, CAR-T cell expansion and cytokine release. The model accounted for key drug-specific (CAR-affinity, CAR-densities) and system-specific (antigen densities, E:T ratios) variables and was able to characterize comprehensive in vitro datasets from multiple affinity variants of anti-EGFR and anti-HER2 CAR-T cells. Next, a physiologically based PK (PBPK) model was developed to simultaneously characterize the biodistribution of untransduced T-cells, anti-EGFR CAR-T and anti-CD19 CAR-T cells in xenograft -mouse models. The proposed model accounted for the engagement of CAR-T cells with tumor cells at the site of action. Finally, an integrated PBPK-PD relationship was established to simultaneously characterize expansion of CAR-T cells and tumor growth inhibition (TGI) in xenograft mouse model, using datasets from anti-BCMA, anti-HER2, anti-CD19 and anti-EGFR CAR-T cells. Model simulations provided potential mechanistic insights toward the commonly observed multiphasic PK profile (i.e., rapid distribution, expansion, contraction and persistence) of CAR-T cells in the clinic. Model simulations suggested that CAR-T cells may have a steep dose-exposure relationship, and the apparent Cmax upon CAR-T cell expansion in blood may be more sensitive to patient tumor-burden than CAR-T dose levels. Global sensitivity analysis described the effect of other drug-specific parameters toward CAR-T cell expansion and TGI. The proposed modeling framework will be further examined with the clinical PK and PD data, and the learnings can be used to inform design and development of future CAR-T therapies.
Introduction
Adoptive cell therapy has been revolutionized with the recent development and emergence of chimeric antigen receptor (CAR) T cells.Citation1 These are engineered T cells with a single-chain variable fragment (scFv) on the cell membrane, which recognizes the tumor antigen and can promote antitumor activities.Citation2 A typical first-generation CAR construct consists of scFv fused with a transmembrane domain and an intracellular signaling unit (CD3 zeta chain), which enables tumor-specific epitope recognition and T-cell activation without dependence on the major histocompatibility complex molecules.Citation3 More recently, the field has transitioned to next-generation CAR constructs that incorporate additional costimulatory domains within the CAR-design to enhance T-cell activation pathway.Citation4
Evolution of this technology has produced sustained antitumor responses and unprecedented outcomes for the treatment of hematological malignancies.Citation5 With the initial clinical success of anti-CD19 CAR-T cells, and regulatory approvals of KYMRIAH™ (tisagenlecleucel)Citation6 and YESCARTA™ (axicabtagene ciloleucel),Citation7 the clinical pipeline for CAR-T cells has increased substantially, with ≥ 90 CAR-T cell therapy candidates now being investigated in different clinical trials.Citation8 Although initially clinical investigations were limited to hematological malignancies, the field is rapidly progressing toward potential use in solid tumor targets.Citation9
Tumor antigen recognition and engagement by the CARs results in activation of CAR-T cells, cytolysis of tumor cells and release of cytokines. The cytokines subsequently promote rapid expansion of CAR-T cells, followed by their memory differentiation.Citation10 Although there has been a general understanding of the mechanism of action for CAR-T cells, the quantitative impact of underlying key determinants influencing the rate and extent of CAR-T cell activity remains poorly understood.
Characterization of pharmacokinetic–pharmacodynamic (PK-PD) relationships of CAR-T cells presents many challenges and unique opportunities due to the self-replicating and long-term persistence capabilities in vivo.Citation10 A typical multiphasic disposition profile of CAR-T cells consists of a rapid distribution phase leading to a time-restricted expansion phase, followed by contraction and prolonged persistence phases. Although mathematical models have been used recently to characterize the distinct PK profiles of CAR-T cells,Citation11 the empirical models cannot be leveraged to understand how drug- and system-specific parameters contribute to this unique PK behavior. Therefore, development of mechanism-based translational PK-PD models, which integrate key drug-specific and system-specific parameters into a quantitative framework, can be invaluable in understanding the key PK-PD determinants of CAR-T cells. Such models can then: (1) facilitate the design and development of lead CAR-constructs, (2) triage lead CAR-T candidates in preclinical settings, and (3) enable effective preclinical-to-clinical translation.Citation12
Here, we adopted a step-wise approach to develop a multiscale, mechanistic PK-PD model to quantitatively describe the CAR-T cell activities in in vitro and in vivo preclinical models using a comprehensive set of literature data reported for multiple CAR constructs.Citation13,Citation14 In Step 1, a cell-level PD model was developed to quantitatively characterize the impact of drug-specific (e.g., CAR-affinity and CAR density) and system-specific (e.g., antigen density, tumor burden) parameters on in vitro CAR-T cell activities, including tumor cell depletion, CAR-T cell expansion and cytokine release. In Step 2, a physiologically based pharmacokinetic (PBPK) model was developed to characterize in vivo biodistribution of CAR-T cells in xenograft mouse models. Finally, in Step 3, a PBPK-PD model was established to simultaneously characterize in vivo CAR-T expansion and tumor cell depletion in xenograft mouse models. The in vitro potencies were then compared with the in vivo estimated values to establish an in vitro and in vivo correlation (IVIVC). The developed PBPK-PD model was used to perform simulations to understand CAR-T cell PK-PD behavior upon changes in CAR-T dose-levels and tumor burdens. The translational model we present here is expected to provide a better framework to explain clinical PK-PD behavior of CAR-T cells in the future.
Results
Cell-level PD model to characterize in vitro CAR-T cell activity
A mathematical model (, described in the methods section) was developed to characterize the relationship between CAR-binding affinity, antigen expression on target cells, CAR expression on T cells and different effector cell: target cell (E:T) ratios to quantitatively describe in vitro target-cell depletion, cytokine release and T-cell expansion simultaneously. To develop this in vitro model, a comprehensive dataset was used, comprising two different CAR constructs, i.e., anti-epidermal growth factor receptor (EGFR) and anti-human epidermal growth factor receptor 2 (HER2) CAR-T cells (as described in ). The three quantitative outcomes characterized using this model included: (1) target cell depletion, (2) CAR-T cell proliferation, and (3) release of cytokines (e.g., interferon (IFN)-γ).
Table 1. Preclinical in-vitro and in-vivo datasets used to develop the proposed translational PK-PD model
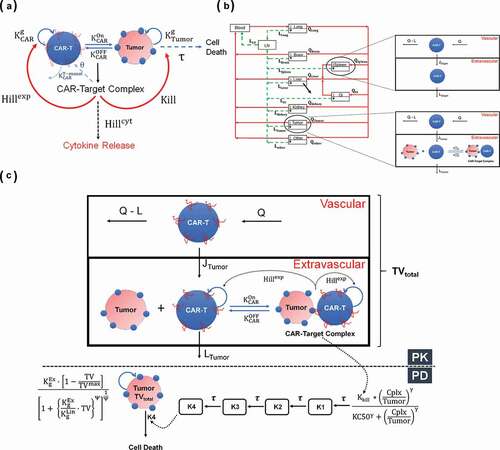
Figure 1. (A) A schematic diagram of a cell-level pharmacodynamic model for CAR-T cell activity: A dynamic population of CAR-T cells and tumor cells was assumed in an in-vitro system. Upon target-mediated interaction among the two-cell population, there is formation of CAR-Target complexes, which simultaneously mediate the tumor cell depletion, expansion of CAR-T cells and release of cytokines. (B) A schematic diagram of a physiologically based pharmacokinetic (PBPK) model to characterize the disposition of CAR-T cells: The model is compartmentalized into blood and relevant tissues, anatomically arranged via blood flows (red arrows) and lymphatic flows (green arrows). Each tissue is further sub compartmentalized into vascular and extravascular spaces. A 1st order elimination of CAR-T cells (solid black arrow) is characterized from liver extravascular space. In a typical tissue, CAR-T cells extravasates from vascular to extravascular space via 1st order transmigration (JOrgan) rates, eventually circulating back to blood stream via organ-specific lymphatic flow. Within the tumor extravascular space, there is formation of CAR-Target complexes, whereas only unbound CAR-T cells can circulate back via lymphatic flow. (C) A schematic diagram of PBPK-PD model to characterize CAR-T cell expansion and tumor growth inhibition: The diagram illustrates only the ‘tumor compartment’ of the full PBPK model structure, where upon formation of CAR-Target complexes in tumor extravascular space, there is expansion of total (unbound + tumor-bound) CAR-T cells and depletion of total tumor volume (TVtotal), which comprises vascular and extravascular spaces. Only the unbound CAR-T cells can leave the tumor tissue via lymphatic (LTumor) flows. The ‘number of CAR-Target complexes per tumor cells’ undergo a series of signal transduction steps (K1-K4), before they ultimately induce killing of inherently growing tumor cells (Kg) to induce TGI
Anti-EGFR CAR-T cells
The cell-level model was used to fit the in vitro datasets for anti-EGFR CAR-T cells reported by Caruso et al.Citation13 describes the observed datasets and model fitted profiles for EGFR-expressing U87 tumor cell line depletion (), anti-EGFR CAR-T cell proliferation () and percentage of cytokine release with respect to baseline levels () in an in vitro system of EGFR+U87 cell lines with varying antigen densities (30,899–628,265 receptors/cell), CAR-affinities (Cetuximab versus Nimotuzumab CAR-T) and E:T ratios (1.25:1–20:1) (described in detail in ).
Figure 2. Observed and model fitted profiles for affinity variant anti-EGFR CAR-T cells activity in an in-vitro system. (A) Target cell killing: Observed (in dots) and model-generated (solid lines) profiles of viability of EGFR expressing parental U87 cell lines with varying antigen-densities (30,899–628,265 receptors/cell), upon incubation with either low affinity nimotuzumab CAR-T (in blue) or high affinity cetuximab CAR-T (in red). Figures A1 and A2 describes the cell-viability as a function of time, whereas figures A3-A6 describes the viability as a function of different E:T ratios after incubation of CAR-T cells at 4h. (B) CAR-T cell proliferation: Observed (in dots) and model-generated (solid lines) profiles of untransduced (in black) or high affinity cetuximab CAR-T cells (in red) growth kinetics, when cocultured with EGFR expressing U87 (30,899 receptors/cell) cells at an E:T ratio of 1:2. (C) Cytokine release: Observed (in dots) and model-generated (solid lines) profiles of % IFN-γ release after coculture of high affinity cetuximab CAR-T (in red) or low affinity nimotuzumab CAR-T cells (in blue) with EGFR-expressing U87 parental cell lines with varying antigen densities (30,899–628,265 receptors/cell). Figure C1 describes the extent of % INF-γ release as a function of antigen-density, whereas figures C2 and C3 describes the time-course of %IFN-γ release as a function of time
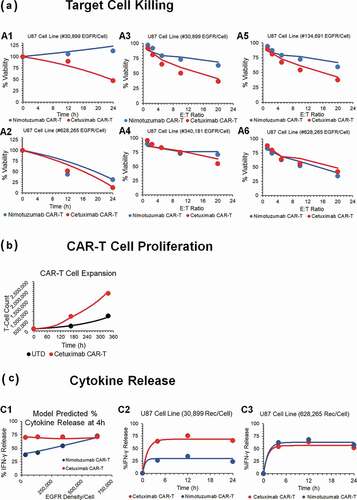
The model was able to simultaneously capture the differential tumor cell-killing potential of low-affinity Nimotuzumab CAR-T (profiles in blue), in comparison to high-affinity Cetuximab CAR-T (profiles in red), in U87 cell lines with varying EGFR densities, by estimating the key efficacy parameters (see Methods section). The model uses the formation of the ‘number of CAR-Target Complexes/tumor cells’ (see Methods Section), which would increase with increasing affinity and antigen-densities due to higher target engagement. The estimated potency parameter values (, ) suggested that ~1.45 CAR-Target complexes/tumor cells were required to induce 50% of the maximum killing rate exhibited by CAR-T cells.
Table 2. Parameters, either fixed or estimated, used to build the PBPK-PD model for CAR-Ts
highlights the expansion of Cetuximab CAR+ T cells in comparison to untransduced (CAR-) T cells after coculture with EGFR-expressing U87 cell lines. The model was able to capture the activation-induced enhanced proliferative potential of CAR+ T cells, when cocultured with antigen-positive tumor cells. Based on the structural model depicted in Equationequations 4(4)
(4) and Equation11
(11)
(11) (Methods Section), the estimated parameters () suggested that ~4.3 CAR-Target complexes per tumor cell were required to get 50% of the maximum reduction in CAR-T cells doubling time, whereas the maximum saturable reduction in CAR-T cells doubling time
was estimated to be 44.5% within the studied in vitro system.
depicts the model fits overlaid with observed data for percentage increase in IFN-γ (in comparison to baseline) upon interaction of two different affinity variants of CAR-T cells with different EGFR expressing cell lines. The model was able to simultaneously characterize a comprehensive dataset for saturable increase in IFN-γ in an in vitro coculture as a function of time, EGFR receptor densities and CAR-affinities. The associated model parameters (Equationeq. 12(12)
(12) , ) reflected that ~0.1 CAR-Target complexes/tumor cells were able to induce 50% of the maximum rate of activation-induced cytokine release in the studied in vitro system.
Anti-HER2 CAR-T cells
The cell-level PD model () was also used to characterize the in vitro datasets for affinity-variant anti-HER2 CAR-T cells reported by Liu et al.Citation14 describes the observed datasets and model-fitted profiles for HER2-expressing tumor-cell depletion (), anti-HER2 CAR-T cell proliferation () and induction of absolute concentrations of IFN-γ (in pg/mL, ), in a comprehensive in vitro experiment with varying CAR-affinities, HER2 receptor densities, CAR-densities and E:T ratios (described in detail in ).
Figure 3. Observed and model fitted profiles for affinity variant anti-HER2 CAR-T cells activity in an in-vitro system. (A) Target cell killing: Observed (in dots) and model-generated (solid lines) profiles of % cytotoxicity (at 8h) of NALM-6-CBG cells transiently transfected with 0.1 (green), 1 (red) and 10 (blue) µg of HER2 mRNA respectively and cocultured with affinity variant anti-HER2 CAR-Ts, i.e., 4D5 (Kd = 0.58 nM, fig A1), 4D5-7 (Kd = 3.2 nM, fig A2), 4D5-5 (Kd = 1.1 µM, fig A3) and 4D5-3 (Kd = 3.9 µM, fig A4) respectively, as a function of varying E:T ratios. (B) CAR-T cell proliferation: Observed (in dots) and model-generated (solid lines) profiles of fold-expansion of affinity variant anti-HER2 CAR-T cells, i.e., 4D5 (Kd = 0.58 nM, fig B1), 4D5-7 (Kd = 3.2 nM, fig B2), 4D5-5 (Kd = 1.1 µM, fig B3) and 4D5-3 (Kd = 3.9 µM, fig B4) respectively, as a function of antigen densities on HER2 expressing K562 cells cocultured at E:T ratio of 1:1 for 7 d. (C) Cytokine release: Observed (in dots) and model-generated (solid lines) profiles of IFN-γ release (pg/mL) as a function of different HER2 densities on K562 cells, when cocultured with CAR-T cells at E:T ratios of 1:1 for 24h. Figures C1 and C2 describes the cytokine release for high-affinity 4D5 CAR-T (Kd = 0.58 nM) with lower (fig. C1) and higher (fig. C2) CAR densities, respectively. Figures C3 and C4 describes the cytokine release for low-affinity 4D5-5 CAR-T (Kd = 1.12 µM) with lower (fig. C3) and higher (fig. C4) CAR densities, respectively
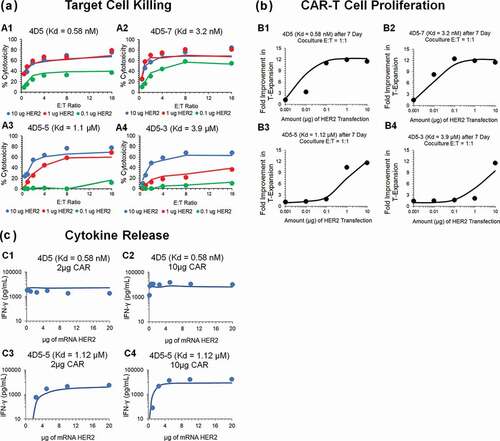
depicts simultaneous model-fitted profiles overlaid with observed data for an 8 h in vitro cytotoxicity experiment, where four different affinity-variant (Kd ranging in 3.9 µM–0.58 nM) of CAR-T cells are cocultured with Nalm-6-CBG cell lines, transfected with different levels of HER2 mRNA. The model was able to account for different system-specific determinants (e.g., CAR-affinity, HER2 densities) to effectively capture the saturable killing curves, and a common set of in vitro efficacy parameters were estimated. The model-estimated potency (, ) reflected that ~0.05 CAR-Target complexes/tumor cells were required to induce 50% of the maximum killing rate exhibited by CAR-T cells.
describes the model-fitted profiles overlaid with observed dataset for the fold improvement in the expansion of different affinity-variant anti-HER2 CAR+ T cells in comparison to untransduced T cells, when cocultured with tumor cells with varying antigen-densities after 7-d. Simultaneous characterization of the dataset enabled the identification of rate and saturable extent of CAR-T cell expansion in the presence of key underlying determinants, such as CAR-affinities and antigen-densities. The parameter estimation (, Equationeq. 4(4)
(4) and Equation11
(11)
(11) (Methods Section)) revealed that ~0.06 CAR-Target Complexes/tumor cells are required to achieve 50% of the maximum reduction in CAR-T cells doubling time, whereas the maximum saturable inhibition in CAR-T cells doubling time (
) was estimated to be 59.5% within the in vitro system.
describes the model-fitted profiles, overlaid with the observed data for production of IFN-γ (in absolute concentrations, pg/mL) after coculture with K562 cells, transiently transfected with different levels of HER2, with affinity-variant anti-HER2 CAR-T cells transduced with varying amounts of CAR mRNA (detailed in ). The proposed model structure was able to use the estimated number of CAR-Target complexes () to simultaneously characterize the rate and extent of cytokine release across different datasets. The modeling results revealed that ~0.1 CAR-Target complexes per tumor cells were required to achieve 50% of maximum rate of cytokine release. Additionally, consistent with the anti-EGFR case study, a very fast maximum rate
of cytokine release was estimated within the studied in vitro system.
Physiologically based PK model to characterize biodistribution of CAR-T cells
A PBPK model was developed to characterize the PK and tissue distribution of CAR-T cells in xenograft mouse models. The developed model was used to characterize the biodistribution datasets from anti-EGFR CAR-T cellsCitation21 and anti-CD19 CAR-T cells.Citation15 The detailed information on the CAR constructs, CAR affinities, intravenous (IV) dose levels, radiolabels used and investigated tissues associated with each study are listed in . A schematic diagram of the model structure is shown in , and the detailed model description is provided in the Methods section.
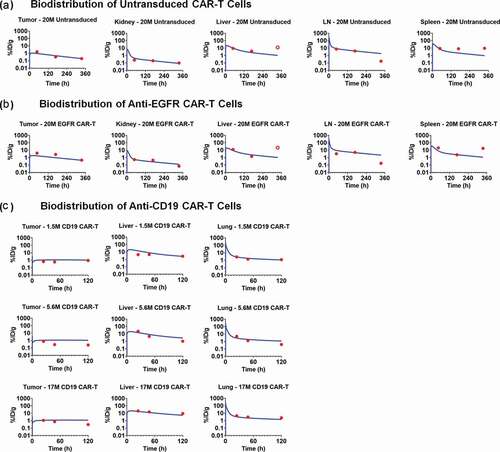
describes the model-fitted profiles and observed data-points associated with simultaneous fitting of the biodistribution datasets for untransduced (CAR-) T cells (), anti-EGFR CAR+ T cells () and anti-CD19 CAR+ T cells () in xenograft mouse models. The proposed PBPK model simultaneously characterized the biodistribution of all three CAR constructs with one set of vascular to interstitial transmigration () rates for all major organs. While performing the model fitting, the physiological parameters (e.g., flow rates, organ volumes), as well as the drug- and system-specific parameters (e.g., CAR-affinity, tumor volume, antigen-densities) associated with each case study, were fixed to the literature reported values, as listed in and supplementary Table 1. Expansion of CAR-T cells after tumor distribution and antigen-mediated stimulation was not observed in the datasets (anti-EGFR and anti-CD19) used for PBPK model building, presumably due to the limited time points studied, and hence was not incorporated within the model structure. However, CAR-T cell expansion was later implemented while developing the PBPK-PD relationship.
Figure 4. Observed and model fitted profiles for biodistribution of CAR-T cells in xenograft mouse model. (A and B) Observed (in dots) and model-generated (solid lines) profiles of % ID/g for untransduced T cells (Figure 4A) or anti-EGFR CAR-T cells (Figure 4B) in EGFR expressing U87 xenografts after intravenous (IV) administration of 20 million T cells per mice. Biodistribution was investigated in tumor, kidney, liver, lymph node and spleen (C) Observed (in dots) and model-generated (solid lines) profiles of % ID/g for anti-CD19 CAR-T cells (Figure 4C) in xenografts inoculated with Raji cells after IV administration of 1.5, 5.6, and 17 million CAR-T cells per mice. Biodistribution was investigated in tumor, liver and lungs
The estimated parameters associated with the proposed PBPK model included the 1st order transmigration rates (, as also explained in Ref.Citation19,Citation22) for all the tissues where the biodistribution of CAR-T cells was available (). For the rest of the tissues (e.g., brain, gastrointestinal [GI] tract, other) where no biodistribution data were available, the transmigration rates (
) were fixed to the values reported by Khot et al.Citation19 Additionally, a 1st order elimination rate of CAR-T cells
was estimated from the extravascular space
of the liver compartment, based on multiple reports on liver elimination of CAR-T cells.Citation23–Citation25 Since the model-estimated transmigration rates
were reflective of the distributional rates among different tissues, it was observed that the maximum distribution of T cells was in lungs, spleen and liver. The model-estimated elimination of CAR-T cells from the liver extravascular
space was 0.029 1/h (~ 1-d half-life).
and represents the observed data and model-fitted profiles of untransduced T cells and anti-EGFR CAR-T cells (CAR affinity: Kd of 40 nM) in the investigated tissues for a U87-bearing xenograft mouse model.Citation21 Although the proposed model accounted for the formation of CAR-Target complexes, there was no apparent difference in the model-predicted biodistribution profiles within the tumor for CAR-T cells () in comparison to untransduced T cells (). One of the possible reasons could be because CAR-T expansion was not incorporated after target engagement in the tumor. Of note, the %ID/g was very consistent across the three case studies (when comparing –). Additionally, based on the biodistribution results from anti-CD19 CAR-T, where three different doses (i.e., 1.5, 5.6 and 17 million CAR+ Cells) were administered, it was observed that the kinetics of CAR-T cell levels were approximately dose-proportional across the dose range. Hence, a first order linear rate of elimination from the liver extravascular space () was used in characterizing the disposition of CAR-T cells.
Development of a PBPK-PD model to characterize in vivo CAR-T cell expansion and tumor growth inhibition in xenograft mouse model
The developed PBPK model was expanded to have a PD modeling component, which used the ‘number of CAR-Target complexes per tumor cell’ as a driver for tumor growth inhibition (TGI) and CAR-T cell expansion. A schematic diagram of the model structure is shown in , and the detailed model description is provided in the Methods section.
Anti-BCMA CAR-T (bb2121) cells
describes simultaneous characterization of TGI and CAR-T cell expansion in B-cell maturation antigen (BCMA)-expressing RPMI-8226-bearing xenograft mice, after a single IV administration of 5 × 10⁶ anti-BCMA (bb2121) CAR+ T cells/mouse. As described in detail in the Methods Section, a dynamic (with growth and killing functions) tumor compartment () was incorporated into the PBPK model, where ‘number of CAR-Target complexes per tumor cell’ was used to drive efficacy and expansion of total CAR-T cells (unbound and tumor cell bound) in the tumor extravascular space. With the longer duration and more frequent sampling in this PK-PD study (up to 28 d), CAR-T cells expansion in the blood compartment was observed (), in contrast to earlier described biodistribution studies used for PBPK model development.
Figure 5. Observed and model fitted profiles for in vivo expansion of CAR-T cells and CAR-T induced tumor growth inhibition. (A) Anti-BCMA CAR-T cells: Figure A1 describes the observed (in dots) and model-generated (in lines) profiles of TGI induced in BCMA-expressing RPMI-8226 bearing xenograft mice after intravenous (IV) administration (day 0) of vehicle control (in blue) or 5 million anti-BCMA (bb2121) CAR-T cells/mice (plots in red). Figure A2 describes the observed (in dots) and model-generated (in lines) simultaneous profiles of CAR-T induced TGI (plots in red, Y1-axis) and apparent expansion of anti-BCMA CAR-T cells (profiles in green, Y2-axis) in blood. (B) Anti-HER2 CAR-T cells: The observed (in dots) and model-generated (in lines) profiles of TGI induced in xenografts inoculated with HER2-high SKOV3 (figures B1 and B3) and HER2-low PC3 (figures B2 and B4) tumors (day 0) among different flanks of same animal. Mice in the control group were treated with a single IV administration (day 23) of 10 million untransduced T cells (profiles in green), whereas mice in the treatment group were treated with single IV administration (day 23) of either (1) high-affinity 4D5 (Kd = 0.58 nM, profiles in red) or (2) low-affinity 4D5-5 (Kd = 1.1µM, profiles in blue) CAR-T cells at 3 million (figures B1 and B2) and 10 million (Figures B3 and B4) dose-levels
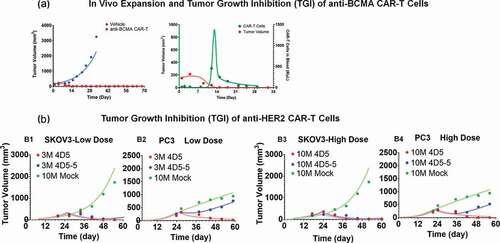
Upon IV administration of CAR+ T cells in blood, no detectable level of CAR-T cells in blood was observed at early time, highlighting a rapid distribution/margination phase. The model was able to capture this unique profile, as evident in (profiles in green). Upon interaction with the tumor cells within the tumor extravascular space , there was expansion of CAR-T cells, which eventually circulated back (via lymph flow) to the blood (profiles in green, ) as projected by the PBPK model in . This phenomenon likely contributes toward an apparent delay within the induction of TGI (profiles in red, ) and apparent expansion of CAR-T cells in blood compartment (profiles in green, ). Upon the death of tumor cells by day 14, the ‘CAR-Target Complex’ driven signal is reduced, leading to a rapid contraction phase, where CAR-T cells rapidly decline, eventually conforming to their baseline exposure levels.
Interestingly, the model-estimated maximum killing rate of tumor cells (~0.05 1/h) and the ‘number of CAR-Target complexes per tumor cells’
required (9.94 complexes/tumor cell) to achieve 50% of maximum rate of tumor depletion were similar to the in vitro estimates of anti-HER2 and anti-EGFR CAR-T cells (). The model-estimated maximum rate
and ‘number of CAR-Target complexes per tumor cell’ required
to induce expansion of activated CAR-T cells were 0.09 (1/h) and 5.18 (complexes/tumor cell), respectively. Observed T-cell expansion potency estimate
in vivo were also very similar to prior in vitro potency estimates
, highlighting the potential utility of adopting a systems approach when developing translational PK-PD relationships.
Anti-HER2 CAR-T cells
describes the TGI profiles (observed and model fitted) for affinity-variant (4D5 [high affinity] and 4D5-5 [low affinity]) anti-HER2 CAR-T cells in xenograft mice, subcutaneously inoculated with both HER2-high SKOV3 and HER2-low PC3 tumor cells in different flanks using the model described in (see Methods section). Simultaneous characterization of all the dataset (at low and high doses) was conducted using the proposed PBPK-PD model. All the drug-specific (CAR-affinity and CAR-density) and system-specific (antigen densities of SKOV3 and PC3) parameters were fixed to known values, whereas parameters associated with tumor growth and killing were estimated (). Parameters associated with in vivo expansion of CAR-T cells were fixed to estimates from the anti-BCMA (bb2121) study, due to the lack of such data within the current case study. The ability of the model to simultaneously characterize the TGIs in HER2-high SKOV3 and HER2-low PC3 TGI supported that the quantitative relationship between CAR-affinity, target abundance and CAR-T cell activity can be translated into an in vivo setting, where a low-affinity and high-affinity CAR-T cells have differential relative efficacy in a high-expressing SKOV3 tumor in comparison to low-expressing PC3 tumor. Due to the lower binding affinity of 4D5-5 (blue profiles), there is expected to be less ‘CAR-Target Complexes per tumor cell’ formation in the low-HER2 PC3 xenografts in comparison to high-HER2 SKOV3 xenografts, which eventually resulted in differentiation of TGI.
Anti-CD19 CAR-T cells
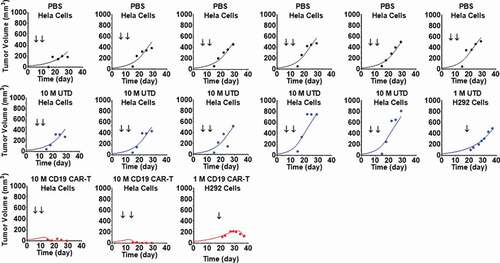
represents the pooled observed data and model-fitted profiles from two different TGI experiments in xenograft mouse models inoculated with either CD19-expressing HeLa or H929 cells. Further details on the receptor densities of two cell lines and dosing regimens are described in . The proposed PBPK-PD model () was able to simultaneously capture the tumor growth profiles for animals treated with phosphate-buffered saline (PBS) control, untransduced (CAR-) T cells and anti-CD19 CAR-T cells, upon single and multiple dosing regimens. Due to the lack of CAR-T cell counts within this study, the parameters associated with the ‘CAR-Target complex’-driven in vivo expansion of CAR-T cells were fixed to the values estimated from the anti-BCMA (bb2121) case study (). The model was able to simultaneously characterize the pooled dataset from different studies, xenograft models and dosing regimen. The model-estimated maximum rate of in vivo tumor cell depletion and potency
were estimated to be 0.093 (1/h) and 18.2 (number of CAR-Target complexes/tumor cell), respectively (listed in ).
Figure 6. Observed and individual model fitted profiles for anti-CD19 CAR-T induced tumor growth inhibition. Xenograft mice inoculated with CD19-expressing HeLa cells (Day 0) were treated with intravenous (IV) administration of (1) PBS vehicle control (profiles in black), (2) 10 million untransduced T cells (profiles in blue), and (3) 10 million anti-CD19 CAR-T cells (profiles in red) on day 8 and 14. Xenograft mice inoculated with CD19-expressing NCI-H929 cells (Day 0) were treated with IV administration of (1) 1 million untransduced T cells (profiles in blue) and (2) 1 million CD19 CAR-T cells (profiles in red) on day 20
Anti-EGFR CAR-T cells
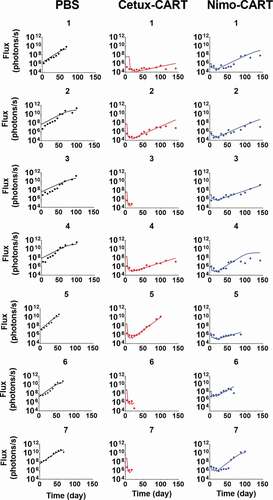
describes the observed dataset and model-fitted TGI profiles for individual animals in an orthotopic mouse model of glioblastoma, inoculated with EGFR-expressing U87 cells. The animals were treated with PBS control, or 1 × 10⁶ CAR+ cells of either high-affinity Cetuximab CAR-T or low-affinity Nimotuzumab CAR-T, administered in a Q1WX3 dosing regimen via intratumoral (IT) injection. Within the developed PBPK model, the bolus dose of CAR-T cells was described as dosed within the extravascular space of the tumor compartment (). Simultaneous characterization of TGI profiles using the PBPK-PD model enabled the characterization of the differential efficacy of CAR-T cells due to the impact of EGFR binding affinity on CAR-T cells, confirming the quantitative impact of EGFR binding affinity on CAR-T cell activities in an in vivo setting. The model-estimated maximum rate of in-vivo tumor cell depletion and potency
were estimated to be 0.032 (1/h) and 12.4 (number of CAR-Target complexes/tumor cell), respectively (listed in ).
Figure 7. Observed and individual model fitted profiles for anti-EGFR CAR-T induced tumor growth inhibition. Intracranial xenograft mice, inoculated with EGFR-expressing U87 cells (Day 0), were treated with intratumoral (IT) administration of (1) PBS vehicle control (profiles in black), (2) 1 million high-affinity cetuximab CAR-T cells (profiles in red) and (3) 1 million low-affinity nimotuzumab CAR-T cells (profiles in blue) in a Q1WX3 dosing regimen, starting at day 4
Model-based simulations to investigate the effect of dose and tumor burden on tumor dynamics, target-engagement and CAR-T cell expansion
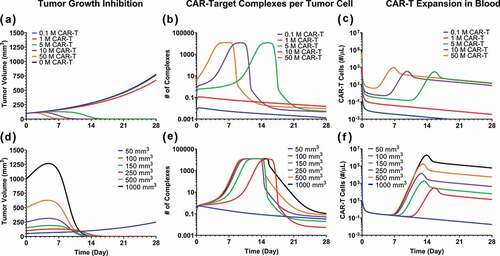
To further evaluate the in vivo relevance of our developed PBPK-PD model, model-based simulations were conducted to examine the impact of dose and tumor burden, and the results were compared to those observed in the clinic. describes the model simulations for TGI profiles ( and ), the ‘number of CAR-Target Complexes per tumor cell’ ( and ) in the tumor extravascular space , and the concentration of CAR-T cells (number/µL) in the blood compartment ( and ) based on the model-estimated parameters for bb2121 case study. As described below, the simulation results revealed a few interesting trends.
Figure 8. Model predictions using validated PBPK-PD model to simultaneously evaluate the effect of (1) CAR-T dose and (2) Initial tumor burden on (A and D) tumor growth inhibition (TGI), (B and E) generation of ‘number of CAR-Target complexes per tumor cell’ in the tumor extravascular space and (D and F) CAR-T cell expansion in blood: 1) CAR-T dose: Simulations were performed after single IV administration of anti-BCMA (bb2121) CAR-T cells in RPMI-8226 bearing xenografts, at dose-levels of 0.1, 1, 5, 10 and 50 million CAR-T cells per mouse. (2) Initial Tumor Burden: Simulations were performed after single IV administration of anti-BCMA (bb2121) CAR-T cells at dose-level of 5 million CAR-T cells per mouse in RPMI-8226 bearing xenografts with initial tumor burdens of 50, 100, 150, 250, 500 and 1000 mm3.
Effect of dose
The simulation results suggested that, in comparison to control (profiles in black), no significant TGI was observed until the CAR-Ts reached a critical dose level. Beyond this critical dose level, there is a range of doses with steep dose-exposure relationships, and then the impact of dose on exposure plateaued (). The result was consistent with the simulated ‘number of CAR-Target Complexes per tumor cell’ (), i.e., at low dose-levels (profiles in red and blue), there is little formation of CAR-target complexes per tumor cells. At the higher dose levels, however, the number of CAR-Target Complexes ( = 5.18 complexes/tumor cell) increases rapidly, which initiate simultaneous tumor killing () and expansion of CAR-T cells (). As the dose levels are further increased, the rate of formation of CAR-Target complexes (), as well as the rate of TGI (), increases. This phenomenon leads to rapid decline in tumor burden (), and hence the overall decline in antigen abundance. Following the decline in tumor burden, the total number of CAR-Target Complexes also rapidly decline due to the absence of antigen interaction within the tumor space, leading to reduction in CAR-T proliferation.
illustrates the anticipated CAR-T kinetics within the blood compartment. At lower dose levels, the PK profile is limited to (profiles in blue and red) rapid initial distribution (to tissues) followed by a sustained elimination phase (). However, at higher dose levels, a dose-dependent rate of expansion of CAR-T cells is anticipated. Simulations suggest that the overall extent (Cmax) of CAR-T cell expansion is not expected to change above certain CAR-T dose-levels, whereas the time to Cmax (Tmax) could decrease as the dose is increased. Later, upon rapid decrease in CAR-Target Complexes after antigen depletion, there is a rapid contraction phase of the blood PK of CAR-T cells, followed by sustained phase with first order elimination.
Effect of tumor burden
The potential impact of baseline tumor burden was also evaluated on tumor dynamics (), formation of CAR-Target Complexes per tumor cells () and CAR-T cell expansion in the blood (). Interestingly, the model simulation suggested that despite the differences in initial tumor load, CAR-T cells can achieve tumor elimination in a similar time frame. This is because higher tumor burden led to faster but saturable formation of ‘CAR-Target complexes per tumor cells’ (), which inherently led to increased rate (lower Tmax) and extent (Cmax) of CAR-T expansion () and faster killing of tumor cells ().
Global sensitivity analysis on the CAR-T cell PBPK-PD model
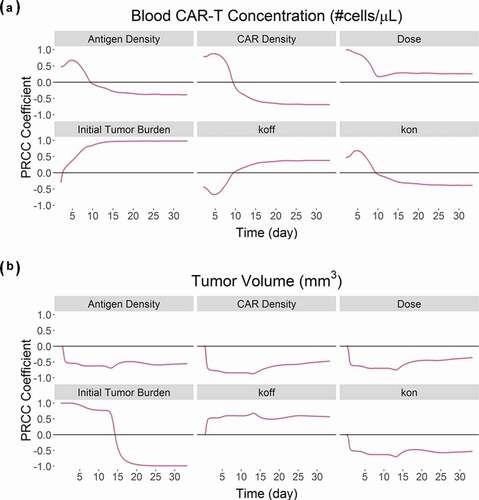
describes the global sensitivity analysis (GSA) on the PBPK-PD model developed for anti-BCMA (BB2121) CAR-T cell (, ) on the blood CAR-T cell expansion () and overall tumor volume (). We observed that parameters associated with formation of ‘CAR-Target complexes’ were predominantly sensitive toward the expansion phase of CAR-T cells (). Parameters such as CAR-affinity (Kon and Koff), CAR density and antigen density were positively correlated with the extent of expansion. Results from GSA on the effects of initial tumor burden and dose on CAR-T cell expansion were very similar to our previous results, shown in , where higher tumor burden leads to higher Cmax, whereas higher CAR-T dose leads to shorter Tmax. describes the sensitivities of different parameters toward tumor volume. The majority of the parameters leading to higher ‘CAR-Target complex’ formation (such as CAR-affinity, CAR-density and antigen density) were negatively correlated with overall tumor volume.
Figure 9. Results from the global sensitivity analysis on the developed PBPK-PD model for BB2121: PRCC-based sensitivity indexes of ‘Antigen Density’, ‘CAR Density’, ‘CAR-T dose’, ‘initial tumor burden’, ‘Koff’ and ‘Kon’ on (A) Blood CAR-T concentrations and (B) overall tumor volume
Discussion
Adoptive cell transfer of T cells transduced with CARs has revolutionized the field of clinical immunotherapy. These ‘self-replicating agents’ have demonstrated remarkable clinical efficacy and long-term persistence upon administration to patient with hematological malignancies. The promising attributes of these agents have been recognized by regulatory agencies, and, in 2017, two CAR-T cell therapies were approved by the US Food and Drug Administration.Citation26 Despite tremendous success, the quantitative impact of key drug-specific and system-specific determinants associated with CAR-T cell activity in the clinic are not well understood. It is challenging to establish PK-PD relationships for CAR-T cells,Citation27 and there are no established paradigms or guidelines to predict safe and efficacious dose-levels for CAR-T cells in humans. Development of multiscale systems PK-PD models could be a highly beneficial first step to identify key determinants associated with the kinetics and activities of these agents.
The first report on characterization of clinical PK of CAR-T cells was recently presented by Stein et al.,Citation11 using Phase 2 datasets from tisagenlecleucel (anti-CD19) clinical trials. The model divided the CAR-T cell kinetics within blood circulation into three distinct phases: (1) an initial time-restricted exponential expansion phase, followed by (2) a rapid contraction phase, and then (3) a sustained persistence phase.Citation28 The model successfully captured the unique CAR-T kinetic profile in humans and estimated the slopes of each distinct phase of CAR-T kinetics. However, the descriptive nature of the model limits extrapolation to other CAR-T cell therapies and alternative dose levels. Recently, a more systems approach to characterize clinical CAR-T cell PK and cytokine release kinetics was adopted by Hardiansyah et al.,Citation29 where they used tumor dynamics to drive CAR-T cell expansion and inter-conversion between effector and memory T-cell phenotypes. The model provides several insights toward the underlying mechanism for the distinct CAR-T cell distribution kinetics and highlights the integrated nature of CAR-T kinetics and PD. Even though their initial data-analysis was limited to only two patients, for which large inter-subject variability was observed in parameter estimates, it demonstrated the feasibility of using a mechanism-based model to capture CAR-T cell kinetics, i.e., time-dependent expansion, rapid contraction and prolonged persistence.
Here, we used a mechanism-based bottom-up approach toward quantifying the impact of key drug- and system-specific parameters associated with CAR-T cell activity and distinctive CAR-T cell PK behavior. The first step within our modeling approach involved development of a cell-level PD model (), which takes into consideration the effects of CAR-affinity, CAR-densities, antigen densities, and E:T ratios to compute the ‘number of CAR-target complexes per tumor cell’, which consequently determines the rate and extent of saturable tumor cell killing, CAR-T expansion and cytokine release. Using reported data from a comprehensive set of in vitro experiments (described in ), the model accounts for the dynamic E:T ratios (due to T-cell expansion), key drug-specific (e.g., CAR-affinity and CAR-density), as well as system-specific (e.g., antigen density) determinants, while estimating the key potency parameters. The developed cell-level model was demonstrated to quantitatively capture the impact of some drug-specific parameters, such as CAR-affinity and CAR-density, on the overall CAR-T cell activities in vitro. In fact, recent clinical observations on CD19 CAR-Ts, CAT19,Citation30 which have lower affinity (faster Koff rates) in comparison to tisagenlecleucel (FMC63),Citation5,Citation6 and hence better in vitro mobility, have demonstrated better tolerability (i.e., lower cytokine levels) in comparison to tisagenlecleucel (KYMRIAH™) in the CARPALL clinical trial,Citation30 while conserving the extent of clinical efficacy. Such clinical observations further reinforce our approach of incorporating cell-level information, when developing translational in vivo PK-PD relationships for CAR-T cells. We envision that such cell-level models will be used in the future to identify optimal CAR-T characteristics (i.e., CAR-affinity and CAR-density) and to facilitate lead CAR-T candidate selection at the discovery stage.
The second step in our modeling analysis was to develop a PBPK model to characterize whole-body disposition of CAR-T cells. Development of a PBPK model for CAR-Ts is paramount because of many literature reports suggesting that only a fraction (~2%) of the total lymphocytic population is expected to be present in the peripheral blood.Citation11 Since the majority of antigen abundance (tumor load) for CAR-T cells in development are generally in either bone marrow, spleen, lymph nodes (hematological targets) or solid tumors, it is essential to have a robust physiological framework to characterize the blood: tissue relationship for CAR-T cells. The proposed PBPK model () structure, which is based on the work published by Baxter et al.Citation22 and Khot et al.,Citation19 was used to characterize the biodistribution of CAR-T cells. The model assumed that: (1) the T-cell eliminating organ was liver based on multiple literature reports supporting this notion,Citation23–Citation25 and (2) CARs and tumor antigens only interact within the tumor compartment of the xenograft mouse model. The PBPK model was able to simultaneously characterize the biodistribution of untransduced T cells, anti-EGFR CAR-T cells, and anti-CD19 CAR-T cells in all major tissues of interest. Spleen, liver and lungs were identified as the organs with maximum biodistribution of CAR-T cells (when comparing values), which was consistent with many previous studies in xenograft mice and patients.Citation31
The third and final step of our modeling analysis was to develop an integrated PBPK-PD relationship, which simultaneously accounts for expansion of tumor-bound and bystanding unbound CAR-T cells, as well as antitumor responses in vivo (). The model was able to characterize the rapid expansion phase of anti-BCMA CAR-T cells in blood and observed TGI (). The model was later used to characterize the TGI datasets for: (1) affinity variant anti-HER2 CAR-T (), (2) anti-CD19 CAR-T (), and (3) anti-EGFR CAR-T () cells. Our translational modeling framework could be used to establish an in vitro–in vivo correlation, when triaging lead CAR constructs within the preclinical settings. Based on the overall comparison of potency parameters across different CAR constructs (listed in ), we observed that the rank ordering of in vitro potency values can be translated into in vivo settings, and the in vitro potency values were consistently ~10 to 20 fold higher ( being lower, ), than the in vivo potency values. This observation could result from the higher likelihood that CAR-T cells will come into contact with tumor cells within static in vitro coculture settings in comparison to dynamic in vivo scenarios.
Finally, the in vivo relevance of the developed PBPK-PD model was examined by assessing the impact of: (1) dose and (2) initial tumor burden on formation of CAR-Target complexes, antitumor responses and CAR-T cell expansion in blood () and comparing the simulations with the reported CAR-T profiles in humans. The model simulation suggested that, upon formation of threshold ‘CAR-Target complexes per tumor cell’, there is accelerated expansion of CAR-T cells ( and ), which leads to accelerated eradication of tumor cells ( and ). A similar pattern has been observed in the clinical settings with multiple CAR-T programs (e.g., anti-CD19Citation6,Citation7,Citation11 and anti-BCMACitation32 CAR-Ts), where upon expansion of CAR-T cells, fast tumor depletion is observed within 2–3 months, with high rates of complete response. The model simulations for blood PK ( and ) also revealed that, upon IV administration of CAR-T cells, there is a rapid initial decline in blood PK, presumably due to distribution to other tissues (rapid distribution phase). However, once CAR-T cells are expanded within the site-of-action (biophase), they recirculate back to the blood stream. This delay in the onset of the CAR-T cell expansion phase in the blood stream is prevalent in all clinical trial results (e.g., tisagenlecleucelCitation33), especially where PK data are reported at early time points (e.g., 1–2 month). Simulations also suggest that, upon depletion of overall tumor burden, there is reduction in the number of CAR-Target complex formation ( and ), which leads to a rapid contraction phase within the blood PK of CAR-Ts ( and ), before the remaining CAR-T cells enter a prolonged persistence phase with first order elimination. This set of simulations ( and ) agree with the typical trends of CAR-T cell kinetics in the clinic.Citation34,Citation35
Our model simulations also suggested a very steep CAR-T dose-exposure relationship (), which is followed by a plateau. The observed plateau is limited by saturable formation of ‘number of CAR-Target complexes per tumor cells’ ( and ). This observation is consistent with many clinical PK datasets, where doses above a certain level no longer correlated with observed Cmax. Recent clinical PK datasets from anti-BCMA (bb2121) Phase 1 studyCitation32 also revealed a steep dose-exposure relationship, where beyond a threshold dose (150 million CAR-T cells), all subsequent higher dose levels generated very similar Cmax levels. Within the study, the occurrence cytokine release syndrome also correlated with the extent of exposure, and hence was higher beyond the threshold dose. However, the rate of expansion to Cmax increases () as the dose level increases. This is observed in some reported clinical PK data for anti-CD19Citation36,Citation37 and anti-BCMACitation32 CAR-T cells, where patients infused with higher doses of CAR-T cells achieve faster expansion to Cmax (i.e., lower Tmax). The model simulations have also revealed the effects of patient tumor burden, which can lead to substantial variability in the exposures (including Cmax) of CAR-T cells. This is also consistent with many clinical reports (for anti-CD19 CAR-TCitation36,Citation37), where higher tumor burden leads to higher Cmax, and hence more cytokine release.Citation38
To summarize, we describe here a mechanism-based model developed to characterize the PK-PD of CAR-T cells. Although a further evolved model will be necessary to describe the clinical behavior of CAR-T cell by incorporating other pertinent components, such as the kinetics of CAR-T cell memory differentiation, effect of CD4/CD8 ratios and cytokine environment toward in vivo expansion of CAR-T cells, our multiscale translational PBPK-PD model integrated drug- and system-specific parameters and was able to characterize CAR-T cell activity in vitro and in vivo. Availability of flow cytometry-based measurements associated with different subsets (CD4+ versus CD8+) and phenotypes (stem cell memory [Tscm] versus effector [Te]) of CAR-T cells will enable further evolution of our base model, to account for differential expansion capabilities and potency of different CAR-T cell phenotypes in vivo. Nonetheless, our current model is expected to provide a framework for understanding the clinical behavior of CAR-T cells, and therefore facilitate future design and development of CAR-T cell therapy.
Methods
Cell-level PD model to characterize CAR-T cell activity
describes the schematic of the in-vitro PD model to characterize CAR-T cell activity. The model accounts for a dynamic population of CAR-T cells and tumor cells growing with their individual growth rates within a coculture setting. Upon interaction, CAR-Target complexes form, which mediates the killing of target (tumor) cells, further expansion of CAR-T cells and induction of cytokine release. The model schematic also illustrates that upon formation of an excessive threshold (θ) ‘CAR-Target Complexes’, there is an accelerated elimination () of CAR-T cells due to exhaustion, a phenomenon that has been observed for high affinity CAR-T cells.
The following set of equations was used to describe the interaction between CAR-T cells and tumor cells:
where, the overall concentrations of antigen () and CAR receptors (
) was derived by calculating the overall receptor densities (for either antigen or CAR) within a well, using a dynamic population of tumor cells ((
), Equationeq. 6
(6)
(6) –Equation10
(10)
(10) ) and CAR-T cells ((
), Equationeq. 11)
(11)
(11) and transforming them into nanomolar concentration (nM) units using the scaling factor ‘SF’, described as
.
The number of ‘CAR-Target complexes per tumor cell’ (Equationeq. 2)(2)
(2) were used as the driver of tumor cell killing, CAR-T cell expansion and release of cytokines. The set of equations below list the expression used for calculation of ‘CAR-Target complexes per tumor cell’ in a media volume (MV) of 100 µL and the hill functions associated with killing of tumor cells (Equationeq. 3
(3)
(3) ), expansion of CAR-T cells (Equationeq. 4)
(4)
(4) and release of cytokines (Equationeq. 5)
(5)
(5) .
The equations listed below describe the dynamics of tumor cells, expansion of CAR-T cells and release of cytokines in the media:
Physiologically based PK model to characterize biodistribution of CAR-T cells
A PBPK model was developed to characterize the biodistribution of CAR-T cells in a tumor-bearing mouse model. Datasets involved in development of this model included biodistribution of untransduced T cells, anti-EGFR CAR-T cellsCitation21 and anti-CD19 CAR-T cellsCitation15 (as listed in ) in key T-cell distributional organs, such as blood, liver, spleen, kidney, lymph node, lung and tumor. describes the schematics of the PBPK model, where all different tissues are anatomically arranged with blood and lymphatic flows. Additionally, each organ is anatomically separated into vascular and extravascular compartments. The system-specific parameters associated with the blood flows, lymphatic flows and organ volumes are listed in supplementary Table 1.Citation39 It was assumed that, upon IV administration, CAR-T cells are distributed to the vascular space of each organ using organ-specific blood flows (), upon which the CAR-T cells can extravasate into extravascular space using first order transmigration rate (
). Upon transfer to the extravascular space, CAR-T cells can either interact with antigen-presenting tumor cells (e.g., in the tumor compartment) or leave the tissues using lymphatic circulation using organ-specific lymph flows (
), eventually merging into blood circulation via lymph node. Within the tumor compartment, the overall number of CAR receptors interact with the total antigen receptors using second order association rates (
, 1/cells/mL/h) and first order dissociation rates (
, 1/h) respectively, where only the unbound CAR-T cells were allowed to leave the extravascular space of a solid tumor using lymphatic flow.Citation22
Additionally, a first order rate of CAR-T cell elimination () has been characterized from the liver extravascular compartment, based on the suggested reports of T cells elimination within liver.Citation23–Citation25 The following set of equations listed below, describe the whole-body disposition of CAR-T cells in a tumor-bearing xenograft mouse model. The state variables depicted with ‘
’ represent concentrations in units of ‘number of cells per mL’ whereas state variables depicted with ‘
’ represent amounts in units of ‘number of cells’.
Blood compartment
Lung compartment
Vascular Space
Extravascular Space
Liver compartment
Vascular Space
Extravascular Space
Tumor compartment
Vascular Space
Extravascular Space
where, ‘’ is set to 108 tumor cells/mL of tumor tissue.
Typical tissues (spleen, kidney, GI tract, brain, other)
Vascular Space
Extravascular Space
Lymph node
In cases of IV administration, the initial condition for Equationeq. 13(13)
(13) was
, whereas the initial conditions for Equationeq. 14
(14)
(14) –Equation23
(23)
(23) were set to 0.
In cases of intratumoral (IT) administration, the initial condition for Equationeq. 19(19)
(19) was
, whereas the rest of initial conditions for Equationeq. 13
(13)
(13) –Equation23
(23)
(23) were set to 0.
Establishing a PBPK-PD relationship to characterize in vivo CAR-T cell expansion and tumor growth inhibition in xenograft mouse model
The validated PBPK model, as described in the earlier step, was used to simulate the intratumoral exposure of ‘number of CAR-T-Target complexes per tumor cell’ (), which was later used as a driver to simultaneously induce tumor growth regression and CAR-T cell expansion (). Hence, the tumor growth and killing functions, as well as expansion of activated CAR-T cells, is as listed below:
While developing the final PBPK-PD model, it was assumed that the tumor volume is dynamic and is hence regulated by tumor growth rates () and CAR-T-induced TGI (
). The growth of the tumor was modeled (as previously described in Ref. 36) to follow an exponential growth rate
, which eventually switches to a linear growth rate
before reaching the saturable total tumor capacity (
). Within a scenario of hematological malignancies, the overall assumption of having a dynamic tumor burden component within the PBPK-PD model will still hold true. However, the population of tumor cells will be modeled to be present in the blood compartment. Additionally, the growth pattern of hematological malignancies may be different than that of a solid tumor.
Additionally, it was also assumed that vascular fraction constitutes for 11.3% of the total tumor volume, whereas the rest (88.7%) is extravascular
fraction.Citation22 Consequently, as per the model structure (), upon interaction of target cells with CAR-T cells within the extravascular space
of the tumor, there is expansion of both tumor-bound as well as unbound (total) CAR-T cells, due to bystander effect in the presence of released cytokines.Citation40
Hence, the updated equations within the final PBPK-PD model, associated with the concentration (# cells/mL) of CAR-T cells in the extravascular space of the tumor as well as dynamic tumor volumes
due to CAR-T-induced TGI, are listed below:
Model-based simulations to investigate the (1) effect of dose and (2) tumor burden on tumor dynamics, target-engagement and CAR-T cell expansion
The fixed and model-estimated parameters of the PBPK-PD model (in the context of anti-BCMA (bb2121) CAR-TCitation16) developed in the previous step were used to simultaneously simulate the effects of: (1) different IV CAR-T cell dose levels; and (2) different initial tumor burdens on overall TGI, formation of CAR-Target complexes within the extravascular space of tumor tissue and the overall CAR-T cell expansion in the systemic circulation. To determine the effect of dose, single IV dose levels of 0.1, 1, 5, 10 and 50 million CAR+ T cells were investigated in a xenograft mouse model with 150 mm3 initial tumor burden. To determine the effect of the initial tumor burden, single IV dose of 5 million CAR+ T cells were investigated in xenograft mouse model with varying initial tumor burden values ranging from 50 to 1000 mm3. The time course of CAR-T cell-induced TGI, formation of ‘total number of CAR-Target complexes per tumor cell’ and the overall CAR-T cell expansion in blood was simulated for 28 d post dose.
Global sensitivity analysis on the CAR-T cell PBPK-PD model
Considering the complexity of the underlying system, a GSA was performed where pertinent drug and system specific parameters of the developed PBPK-PD model () for BB2121 (anti-BCMA CAR-T, ) were simultaneously varied to deduce the overall uncertainty described in the two model outputs, i.e., (1) blood CAR-T cell concentration and (2) overall tumor volume. Partial Rank Correlation Coefficient (PRCC) method was implemented in R software package, where the following parameters were simultaneously perturbed with varying lower and upper bounds, i.e., (± 2-fold),
(+ 2-fold), CAR-T Dose (± 2-fold), initial tumor burden (−2-fold, +5-fold),
(± 2-fold) and
(± 2-fold), with a sampling size of 5000. The limits for lower and upper bounds of these parameters were based on the physiologically plausible values. PRCC-based sensitivity indexes were simulated as a time course for up to 35 d. PRCC describes the relative importance of a parameter along with its positive/negative correlation on the desirable model output.
Parameter estimation, model fitting and simulation
Cell-level PD model for CAR-T cells
Data-fitting and parameter estimation was conducted in two sequential steps, using the proposed model schematics (). Within step 1, datasets associated with the CAR-T cell expansion and tumor cell depletion were fitted simultaneously, to account for dynamic changes in the E:T ratios, which eventually affect the extent of target-cell depletion. In the second step, datasets associated with the release of cytokines were characterized as a function of ‘number of CAR-Target complexes per tumor cell’ (). All the system-specific parameters, such as affinities, receptor densities, and doubling times, in each estimation step were fixed to known values (listed in ), whereas the potency parameters associated with tumor cell depletion, CAR-T cell expansion and cytokine release were estimated. Since CAR-T cell exhaustion was not observed among the in-vitro datasets used to develop this model, which was over a relatively short period of assay time, accelerated CAR-T cells elimination (
, ) was not incorporated within the final model equations.
PBPK model for CAR-T cells
The datasets associated with the biodistribution of untransduced T cells (devoid of any CAR receptors), anti-CD19 CAR-T cells and anti-EGFR CAR-T cells were simultaneously characterized using the proposed PBPK model in . The common system-specific parameter associated with the blood flows (), lymph flows (
), and organ volumes (
) were fixed to a physiological value reported for a 25 g mouse.Citation39 Some of the other fixed parameter values, which were varied between each case study, included the initial tumor burdens and target receptor densities for different xenograft models, as well as doses/affinities of different CAR-T (anti-EGFRCitation21 or anti-CD19Citation15) constructs. All these values have been reported within . Simultaneous fitting of different biodistribution datasets facilitated estimation of first order transmigration rates (
) for all relevant organs where measurements were available. Additionally, a nonspecific first order elimination rate (
) was also estimated from the extravascular space of the liver tissue ().
Integrated PBPK-PD model for CAR-T cells
The developed PBPK model for CAR-T cell therapy in the earlier step was leveraged to establish a preclinical PK-PD relationship (). All the parameters associated with the PBPK were fixed to the estimated values in the earlier step, whereas parameters associated with CAR-T cell activity (i.e., expansion and tumor killing) were estimated here. In cases where both the measurements (CAR-T expansion and TGI) were unavailable, the parameters associated with the in vivo expansion of CAR-T cells were fixed to the estimated values of the anti-BCMA CAR-T (bb2121Citation16) case study, while characterizing the TGI datasets for other case studies, such as anti-HER2, anti-CD19 and anti-EGFR CAR-T cells.
While characterizing the TGI datasets associated with two different affinity-variant anti-HER2 CAR-T cellsCitation14 in xenograft mouse models subcutaneously inoculated with HER2-high SK-OV3 and HER2-low PC3 cell lines in different flanks, two tumor compartments were incorporated within the PBPK-PD model structure (described earlier), with similar blood/lymphatic flows and different antigen densities. The mass balance was achieved within the PBPK model, by decreasing the fractional blood flow received by the ‘Other’ compartment. The TGI dataset for each tumor type for affinity-variant CAR-T cells were simultaneously characterized to obtain common efficacy parameters.
While characterizing the TGI datasets for the two affinity variants (cetuximab and nimotuzumab) anti-EGFR CAR-TsCitation13 in glioblastoma mouse models after intratumoral (IT) injection, the bolus dose of CAR-T cells was injected within the tumor extravascular space of the proposed PBPK model. Datasets associated with control, cetuximab CAR-T treated and nimotuzumab CAR-T-treated animals was simultaneously fitted to the proposed PBPK-PD model to obtain common set of efficacy parameters associated with the CAR-T cell activity.
Modeling software
All the model fittings were performed using Stochastic Approximation Expectation Maximization (SAEM) algorithm of Monolix version 8 (Lixoft®),41 where a log-normal distribution was assumed for IIV for selected parameters if required, as listed in .
Author contributions
A.S. wrote the manuscript; A.S., X.Z., W.W., A.Z. and D.H. designed the research and reviewed the manuscript; X.Z., A.S., X.L.S. and T.C. performed the research; X.Z., A.S. and W.C. analyzed the data
Disclosure of potential conflict of interest
No potential conflict of interest were disclosed.
Supplemental Material
Download MS Word (136.8 KB)Acknowledgments
Authors would like to acknowledge John T. Lee and his team at Janssen Biotherapeutics (JBIO) within Department of Exploratory Biology, for their continuous discussions on several discovery aspects of CAR-T cells. Authors would like to thank Dr Gopi Shankar from Biologics Development Sciences (Janssen) for thoroughly reviewing this manuscript. Authors would like to acknowledge Professor Yanguang (Carter) Cao (UNC Chapel Hill) and other team members from Discovery and Translational Research (DTR) at JBIO, for multiple discussions on PK-PD modelling aspects of CAR-T cells. Authors are also indebted to the learnings from Dr Dhaval K. Shah’s laboratory at University at Buffalo, Department of Pharmaceutical Sciences, which impacted the quality of this manuscript.
Supplementary material
Supplemented data of this article can be accessed on the publisher’s website.
Additional information
Funding
Related Research Data
References
- Xu D, Jin G, Chai D, Zhou X, Gu W, Chong Y, et al. The development of CAR design for tumor CAR-T cell therapy. Oncotarget. 2018;9:13991–21. doi:https://doi.org/10.18632/oncotarget.24179.
- Zhao Z, Chen Y, Francisco NM, Zhang Y, Wu M. The application of CAR-T cell therapy in hematological malignancies: advantages and challenges. Acta Pharm Sin B. 2018;8:539–51. doi:https://doi.org/10.1016/j.apsb.2018.03.001.
- Maus MV, Grupp SA, Porter DL, June CH. Antibody-modified T cells: cARs take the front seat for hematologic malignancies. Blood. 2014;123:2625–35. doi:https://doi.org/10.1182/blood-2013-11-492231.
- Petersen CT, Krenciute G. Next generation CAR T cells for the immunotherapy of high-grade glioma. Front Oncol. 2019;9:69. doi:https://doi.org/10.3389/fonc.2019.00069.
- Park JH, Riviere I, Gonen M, Wang X, Senechal B, Curran KJ, Sauter C, Wang Y, Santomasso B, Mead E, et al. Long-term follow-up of CD19 CAR therapy in acute lymphoblastic leukemia. N Engl J Med. 2018;378:449–59. doi:https://doi.org/10.1056/NEJMoa1709919.
- Maude SL, Laetsch TW, Buechner J, Rives S, Boyer M, Bittencourt H, Bader P, Verneris MR, Stefanski HE, Myers GD, et al. Tisagenlecleucel in children and young adults with B-cell lymphoblastic leukemia. N Engl J Med. 2018;378:439–48. doi:https://doi.org/10.1056/NEJMoa1709866.
- Neelapu SS, Locke FL, Bartlett NL, Lekakis LJ, Miklos DB, Jacobson CA, Braunschweig I, Oluwole OO, Siddiqi T, Lin Y, et al. Axicabtagene ciloleucel CAR T-cell therapy in refractory large B-cell lymphoma. N Engl J Med. 2017;377:2531–44. doi:https://doi.org/10.1056/NEJMoa1707447.
- Hartmann J, Schüßler‐Lenz M, Bondanza A, Buchholz CJ. Clinical development of CAR T cells-challenges and opportunities in translating innovative treatment concepts. EMBO Mol Med. 2017;9:1183–97. doi:https://doi.org/10.15252/emmm.201607485.
- Knochelmann HM, Smith AS, Dwyer CJ, Wyatt MM, Mehrotra S, Paulos CM. CAR T cells in solid tumors: blueprints for building effective therapies. Front Immunol. 2018;9:1740. doi:https://doi.org/10.3389/fimmu.2018.01740.
- Norelli M, Casucci M, Bonini C, Bondanza A. Clinical pharmacology of CAR-T cells: linking cellular pharmacodynamics to pharmacokinetics and antitumor effects. Biochim Biophys Acta. 2016;1865:90–100. doi:https://doi.org/10.1016/j.bbcan.2015.12.001.
- Stein AM, Grupp SA, Levine JE, Laetsch TW, Pulsipher MA, Boyer MW. Tisagenlecleucel model-based cellular kinetic analysis of chimeric antigen receptor-T cells. CPT Pharmacometrics Syst Pharmacol. 2019;8:285–95. doi:https://doi.org/10.1002/psp4.12388.
- Singh AP, Shin YG, Shah DK. Application of pharmacokinetic-pharmacodynamic modeling and simulation for antibody-drug conjugate development. Pharm Res. 2015;32:3508–25. doi:https://doi.org/10.1007/s11095-015-1626-1.
- Caruso HG, Hurton LV, Najjar A, Rushworth D, Ang S, Olivares S. Tuning sensitivity of CAR to EGFR density limits recognition of normal tissue while maintaining potent antitumor activity. Cancer Res. 2015;75:3505–18. doi:https://doi.org/10.1158/0008-5472.CAN-15-0139.
- Liu X, Jiang S, Fang C, Yang S, Olalere D, Pequignot EC, Cogdill AP, Li N, Ramones M, Granda B, et al. Affinity-tuned ErbB2 or EGFR chimeric antigen receptor T cells exhibit an increased therapeutic index against tumors in mice. Cancer Res. 2015;75:3596–607. doi:https://doi.org/10.1158/0008-5472.CAN-15-0159.
- Sta Maria NS, Khawli LA, Wolfe B, Zheng L, Lin SW, Pachipulusu V, Cohrs D, Manoli H Jr., Weist MR, Epstein AL, et al. Dose escalation study of 89Zr-labeled CAR-NK-92MI cells. Seattle (WA): World Molecular Imaging Congress; 2018.
- Friedman KM, Garrett TE, Evans JW, Horton HM, Latimer HJ, Seidel SL, Horvath CJ, Morgan RA. Effective targeting of multiple B-cell maturation antigen-expressing hematological malignances by anti-B-cell maturation antigen chimeric antigen receptor T cells. Hum Gene Ther. 2018;29:585–601. doi:https://doi.org/10.1089/hum.2018.001.
- Berahovich R, Xu S, Zhou H, Harto H, Xu Q, Garcia A. FLAG-tagged CD19-specific CAR-T cells eliminate CD19-bearing solid tumor cells in vitro and in vivo. Front Biosci (Landmark Ed). 2017;22:1644–54. doi:https://doi.org/10.2741/4563.
- Li S, Siriwon N, Zhang X, Yang S, Jin T, He F, Kim YJ, Mac J, Lu Z, Wang S, et al. Enhanced cancer immunotherapy by chimeric antigen receptor-modified T cells engineered to secrete checkpoint inhibitors. Clin Cancer Res. 2017;23:6982–92. doi:https://doi.org/10.1158/1078-0432.CCR-17-0867.
- Khot A, Matsueda S, Thomas VA, Koya RC, Shah DK. Measurement and quantitative characterization of whole-body pharmacokinetics of exogenously administered T cells in mice. J Pharmacol Exp Ther. 2019;368:503–13. doi:https://doi.org/10.1124/jpet.118.252858.
- Haddish-Berhane N, Shah DK, Ma D, Leal M, Gerber HP, Sapra P, Barton HA, Betts AM. On translation of antibody drug conjugates efficacy from mouse experimental tumors to the clinic: a PK/PD approach. J Pharmacokinet Pharmacodyn. 2013;40:557–71. doi:https://doi.org/10.1007/s10928-013-9329-x.
- Chapelin F, Gao S, Okada H, Weber TG, Messer K, Ahrens ET. Fluorine-19 nuclear magnetic resonance of chimeric antigen receptor T cell biodistribution in murine cancer model. Sci Rep. 2017;7:17748. doi:https://doi.org/10.1038/s41598-017-17669-4.
- Zhu H, Melder RJ, Baxter LT, Jain RK. Physiologically based kinetic model of effector cell biodistribution in mammals: implications for adoptive immunotherapy. Cancer Res. 1996;56:3771–81.
- Crispe IN, Dao T, Klugewitz K, Mehal WZ, Metz DP. The liver as a site of T-cell apoptosis: graveyard, or killing field? Immunol Rev. 2000;174:47–62. doi:https://doi.org/10.1034/j.1600-0528.2002.017412.x.
- Huang L, Soldevila G, Leeker M, Flavell R, Crispe IN. The liver eliminates T cells undergoing antigen-triggered apoptosis in vivo. Immunity. 1994;1:741–49. doi:https://doi.org/10.1016/S1074-7613(94)80016-2.
- Mehal WZ, Juedes AE, Crispe IN. Selective retention of activated CD8+ T cells by the normal liver. J Immunol. 1999;163:3202–10.
- Richard-Carpentier G, Kantarjian H, Jabbour E. Recent advances in adult acute lymphoblastic leukemia. Curr Hematol Malig Rep. 2019;14:106–18. doi:https://doi.org/10.1007/s11899-019-00503-1.
- Jusko WJ. Moving from basic toward systems pharmacodynamic models. J Pharm Sci. 2013;102:2930–40. doi:https://doi.org/10.1002/jps.23590.
- Cao Y, Cartwright EK, Silvestri G, Perelson AS. CD8+ lymphocyte control of SIV infection during antiretroviral therapy. PLoS Pathog. 2018;14:e1007350. doi:https://doi.org/10.1371/journal.ppat.1007350.
- Hardiansyah D, Ng CM. Quantitative systems pharmacology model of chimeric antigen receptor T-cell therapy. Clin Transl Sci. 2019. doi:https://doi.org/10.1111/cts.12636.
- Novel SGA. Enhanced CAR T cell expansion and prolonged persistence in pediatric patients with ALL treated with a low-affinity CD19 CAR. Nat Med. 2019 Sep;25(9):1408–1414. doi:https://doi.org/10.1038/s41591-019-0549-5. Epub 2019 Sep 2. PMID:31477906.
- Kershaw MH, Westwood JA, Parker LL, Wang G, Eshhar Z, Mavroukakis SA, White DE, Wunderlich JR, Canevari S, Rogers-Freezer L, et al. A phase I study on adoptive immunotherapy using gene-modified T cells for ovarian cancer. Clin Cancer Res. 2006;12:6106–15. doi:https://doi.org/10.1158/1078-0432.CCR-06-1183.
- Raje N, Berdeja J, Lin Y, Siegel D, Jagannath S, Madduri D, Liedtke M, Rosenblatt J, Maus MV, Turka A, et al. Anti-BCMA CAR T-cell therapy bb2121 in relapsed or refractory multiple myeloma. N Engl J Med. 2019;380:1726–37. doi:https://doi.org/10.1056/NEJMoa1817226.
- Schuster SJ, Bishop MR, Tam CS, Waller EK, Borchmann P, McGuirk JP, Jäger U, Jaglowski S, Andreadis C, Westin JR, et al. Tisagenlecleucel in adult relapsed or refractory diffuse large B-cell lymphoma. N Engl J Med. 2019;380:45–56. doi:https://doi.org/10.1056/NEJMoa1804980.
- Mueller KT, Maude SL, Porter DL, Frey N, Wood P, Han X, Waldron E, Chakraborty A, Awasthi R, Levine BL, et al. Cellular kinetics of CTL019 in relapsed/refractory B-cell acute lymphoblastic leukemia and chronic lymphocytic leukemia. Blood. 2017;130:2317–25. doi:https://doi.org/10.1182/blood-2017-06-786129.
- Mueller KT, Waldron E, Grupp SA, Levine JE, Laetsch TW, Pulsipher MA, Boyer MW, August KJ, Hamilton J, Awasthi R, et al. Clinical pharmacology of tisagenlecleucel in B-cell acute lymphoblastic leukemia. Clin Cancer Res. 2018;24:6175–84. doi:https://doi.org/10.1158/1078-0432.CCR-18-0758.
- Kalos M, Levine BL, Porter DL, Katz S, Grupp SA, Bagg A, June CH. T cells with chimeric antigen receptors have potent antitumor effects and can establish memory in patients with advanced leukemia. Sci Transl Med. 2011;3:95ra73. doi:https://doi.org/10.1126/scitranslmed.3002842.
- Turtle CJ, Hanafi LA, Berger C, Gooley TA, Cherian S, Hudecek M, Sommermeyer D, Melville K, Pender B, Budiarto TM, et al. CD19 CAR-T cells of defined CD4+: CD8+composition in adult B cell ALL patients. J Clin Invest. 2016;126:2123–38. doi:https://doi.org/10.1172/JCI85309.
- Milone MC, Bhoj VG. The pharmacology of T cell therapies. Mol Ther Methods Clin Dev. 2018;8:210–21. doi:https://doi.org/10.1016/j.omtm.2018.01.010.
- Shah DK, Betts AM. Towards a platform PBPK model to characterize the plasma and tissue disposition of monoclonal antibodies in preclinical species and human. J Pharmacokinet Pharmacodyn. 2012;39:67–86. doi:https://doi.org/10.1007/s10928-011-9232-2.
- Watanabe K, Kuramitsu S, Posey AD Jr., June CH. Expanding the therapeutic window for CAR T cell therapy in solid tumors: the knowns and unknowns of CAR T cell biology. Front Immunol. 2018;9:2486. doi:https://doi.org/10.3389/fimmu.2018.02486.
- Chan PL, Jacqmin P, Lavielle M, McFadyen L, Weatherley B. The use of the SAEM algorithm in MONOLIX software for estimation of population pharmacokinetic-pharmacodynamic-viral dynamics parameters of maraviroc in asymptomatic HIV subjects. J Pharmacokinet Pharmacodyn. 2011;38:41–61. doi:https://doi.org/10.1007/s10928-010-9175-z.