
ABSTRACT
During the development of a therapeutic monoclonal antibody (mAb-1), the charge variant profile obtained by pH-gradient cation exchange chromatography (CEX) contained two main peaks, each of which exhibited a unique intrinsic fluorescence profile and demonstrated inter-convertibility upon reinjection of isolated peak fractions. Domain analysis of mAb-1 by CEX and liquid chromatography-mass spectrometry indicated that the antigen-binding fragment chromatographed as two separate peaks that had identical mass. Surface plasmon resonance binding analysis to antigen demonstrated comparable kinetics/affinity between these fractionated peaks and unfractionated starting material. Subsequent molecular modeling studies revealed that the relatively long and flexible complementarity-determining region 3 (CDR3) loop on the heavy chain could adopt two discrete pH-dependent conformations: an “open” conformation at neutral pH where the HC-CDR3 is largely solvent exposed, and a “closed” conformation at lower pH where the solvent exposure of a neighboring tryptophan in the light chain is reduced and two aspartic acid residues near the ends of the HC-CDR3 loop have atypical pKa values. The pH-dependent equilibrium between “open” and “closed” conformations of the HC-CDR3, and its proposed role in the anomalous charge variant profile of mAb-1, were supported by further CEX and hydrophobic interaction chromatography studies. This work is an example of how pH-dependent conformational changes and conformation-dependent changes to net charge can unexpectedly contribute to perceived instability and require thorough analytical, biophysical, and functional characterization during biopharmaceutical drug product development.
Introduction
Conformational flexibility is an integral part of the structure-function relationship of a protein, and it has been shown to be required for various processes ranging from the mobility of proteins through different biological compartments and matrices to substrate binding and catalysis.1–Citation3 While intrinsic molecular characteristics determine the extent of conformational flexibility and associated conformational sub-states of any given protein, it is the influence of extrinsic factors, such as pH, temperature, overall solution composition and substrates, that influence the relative motions or population(s) of any particular conformational state.Citation4–Citation6 Some types of flexibility produce a continuous range of motion while others result in more of a switching motion between discrete states. Any associated conformational changes may be relatively small and localized to a particular region or loop, or they can involve more pronounced changes to the protein folds and overall higher-order structure. As one might expect, conformational flexibility and dynamics are among the more challenging attributes of a protein to accurately measure and fully understand because they are inherently dynamic processes that are typically highly sensitive to any changes in the chemical and physical environment. Advancements in our understanding of these phenomena are directly correlated to advances in the various experimental and computational approaches we depend on to investigate them. As this topic is too extensive to discuss in detail here, we instead refer the reader to more suitable reviews.Citation7–Citation9 We emphasize here, however, that despite persistent technological advances, a detailed understanding of the complex interdependencies of conformational flexibility, function and stability is lacking and remains an active area of research and interest, particularly in relation to the development of therapeutic proteins, as such knowledge could help to identify molecules and conditions that promote optimal stability profiles of biopharmaceutical products.Citation10–Citation12.
The loops that make up the six complementarity-determining regions (CDRs) (three each in the heavy chain (HC) and light chain (LC)) are the most flexible parts of a monoclonal antibody (mAb), and, in addition to their direct role in antigen binding and specificity, they have also been implicated as key determinants of stability.Citation13,Citation14 The third loop in the HC (HC-CDR3) often stands apart from the rest for two reasons: 1) it is the dominant contributor to antigen binding and specificity; and 2) it is the most variable of the CDR loops. For instance, the HC-CDR3 is by far the longest loop (occasionally exceeding 20 amino acids in length) and it has the broadest length distribution (ranging from 2 to 26 amino acidsCitation15), making it the only loop that does not conform to a well-defined set of canonical structures or conformations.Citation16,Citation17 The relative size and flexibility of the HC-CDR3 loop also increases its potential for significant interactions with other CDR loops, as well as neighboring parts of the variable regions.
Conformational flexibility within the native state in particular in CDRs was described mainly using two models, the induced fitCitation18 and conformational selectionCitation19 models. In principle, the induced fit model contends that a ligand is required to actively induce the protein into its binding-competent conformation while the conformational selection model contends that the binding-competent conformation preexists within the native state ensemble and that a ligand merely shifts the equilibrium toward that conformation. There are numerous examples in the literature that provide support for both models,Citation20,Citation21 but one particularly notable and recent report from Fernandez-Quintero et al.Citation22 highlighted the importance of describing HC-CDR3 loop structures as conformational ensembles and concluded that all of the antibodies in their study demonstrated behavior consistent with the conformational selection model. Of the numerous extrinsic factors other than substrates that are known to influence such conformational changes, pH is among the most commonly cited. As pH can alter the ionization behavior of charged amino acid groups, changes in pH may interfere with favorable intramolecular interactions required for maintenance of certain folded structures. Under certain circumstances, it may even be possible to observe a pH-dependent equilibrium between two distinctly different native-state conformations, such as in the case of Nitrophorin-4 (NP4). Crystallographic data from Kondrashov et al.Citation23 revealed that NP4 switches from a predominantly “closed” conformation at pH 5.6 to a predominantly “open” conformation at pH 7.4. Subsequent investigations by Menyhard et al.Citation24 showed that an aspartic acid (Asp) that is buried in the closed conformation has an anomalously high pKa value, enabling it to remain protonated (uncharged) within the relatively nonpolar interior of the protein. Di Russo et al.Citation25 then demonstrated the interconnectivity of pH-dependent conformational changes in NP4 and distinct conformation-dependent pKa values of the Asp in question. Specifically, these authors showed that in the open conformation, where the Asp side-chain is fully exposed to the solvent, its pKa was calculated as 4.3, consistent with theoretical values. In the closed conformation, however, intramolecular interactions with neighboring amino acids raised its calculated pKa to 8.5. Such coupling of pH-dependent conformational changes and conformationally dependent pKa values exemplifies the complex interdependencies that can contribute to the overall structure-function relationship of a protein.
Here, we propose and describe how a pH-dependent equilibrium between two discrete conformations of the HC-CDR3 could be an underlying mechanism for the anomalous charge variant profile of a therapeutic mAb. Currently, understanding the relationship between pH-dependent local or global conformational equilibrium of mAbs, especially in the CDR3, and their effects on mAb quality attributes such as charge variants, are limited. We systematically investigated the pH-dependent localized conformational equilibrium in a therapeutic mAb (mAb-1) at the intact and domain levels using cation exchange chromatography (CEX), surface plasmon resonance (SPR), hydrophobic interaction chromatography (HIC), reverse phase liquid chromatography coupled with mass spectrometric detection (RPLC-MS), peptide mapping, intrinsic fluorescence, and molecular modeling. Through this investigation, we demonstrated how a hypothesized localized pH-dependent conformational change, similar to that described for NP4, and observed in the molecular modeling of the HC-CDR3 of mAb-1, was the likely cause of the anomalous analytical profiles observed by CEX, RPLC, and HIC. Finally, we determined the functional impact of this conformational change and the associated equilibrium on the kinetics/affinity of antigen binding.
Results
Charge variant analysis of intact mAb-1
Charge variant analysis of mAb-1 was conducted with pH gradient CEX using a relatively simple mobile phase system containing only NaH2PO4 and Na2HPO4. After only a few scouting runs where the total ionic strength and gradient steepness were adjusted, a detailed charge variant profile with several well-defined peaks was obtained. Due to the overall complexity of the profile, individual peaks or groups of peaks were labeled by number in order of increasing retention time rather than being assigned as acidic, main, and basic variants ( black trace). Injection repeatability was performed and confirmed a relative standard deviation (RSD) <3% for individual peak area, and 0.1% RSD for peak retention time (Supplemental and Table 1s). UV data at 280 nm were used as the primary means of detection, and UV PDA data (210 nm-400 nm) and intrinsic fluorescence profile data (310 nm-370 nm) were also collected for additional information. The reproducibility of the intrinsic fluorescence profiles was demonstrated in six replicates (Supplemental Table 2s). UV PDA data confirmed that all the peaks in the charge variant profile were in fact protein and were indistinguishable according to the ratio of 260 nm/280 nm (or across the range of 210 nm-290 nm). More interestingly, intrinsic fluorescence profile data indicated a clear difference between the two main peaks (peak-3 and peak-4). Specifically, the intrinsic fluorescence profile of peak-3 was red shifted relative to peak-4 (). The fluorescence profile ratios of 330 nm/350 nm for peak-3 and peak-4 are shown in (initial injection). At this point, a more in-depth investigation into the charge heterogeneity of mAb-1 was initiated based on two key considerations of our preliminary findings. Firstly, the relatively high charge heterogeneity of mAb-1 was unexpected and could not be readily accounted for by all the known post-translational modifications as per peptide mapping (i.e., total deamidation <6.0%, total isomerization <0.5%, and total succinimide <0.5% under non-stressed condition). Secondly, the underlying cause of the difference in fluorescence profiles between peak-3 and peak-4, and how that correlated with the charge heterogeneity by producing two separate peaks, was similarly unclear since such shifts in fluorescence only reflect a conformational change that involves a change in the polarity of the environment of the tryptophan residues.
Figure 1. mAb-1 demonstrated two main peaks (Peak-3 and Peak-4) in CEX analysis using pH gradient elution. The two main peaks exhibited different intrinsic fluorescence and re-equilibrated to a ratio similar to that ratio of unfractionated sample following reinjection of collected individual main peaks. The fluorescence profiles of reinjected peaks were also compared with initial unfractionated sample, which remained unchanged. (a) CEX chromatograms: initial injection of intact mAb-1 in black, reinjection of collected peak-3 in red, reinjection of collected peak-4 in blue. (b) PDA fluorescence profileof peak-3 and peak-4. (c) Fluorescence profile of peak-3 and peak-4 measured by 330 nm/350 nm
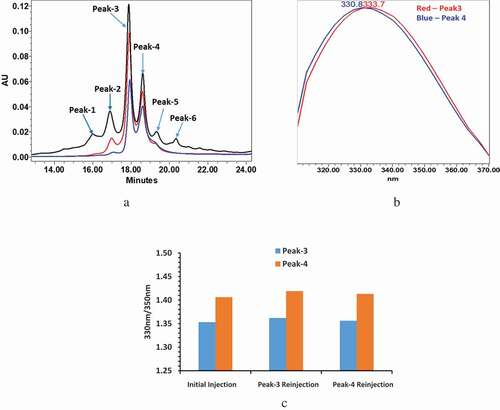
As an initial step in our investigation, peak-3 and peak-4 were collected as separate fractions. They were subsequently reinjected as an internal check of the fraction collection procedure and prior to any orthogonal analysis. Surprisingly, each peak fraction chromatographed as a mixture of both peak-3 and peak-4 ( red and blue traces). Moreover, the ratio of peak-3 and peak-4 was similar in each fraction and was also comparable to what was observed in the unfractionated sample. Lastly, the difference in fluorescence between peak-3 and peak-4 in the reinjected fractions was consistent with the unfractionated sample (: peak-3 and peak-4 injection).
Charge variant analysis of mAb-1 Fc and Fab domains
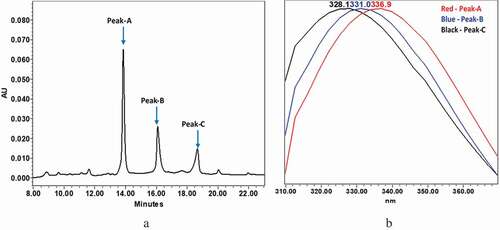
mAb-1 was enzymatically digested into antigen-binding fragments (Fabs) and the crystallizable fragment (Fc) at a single site in the upper hinge region. The rationale for doing so was to determine whether the equilibrium behavior observed at the intact level would translate to the domain level, which would help narrow the focus of our investigation. Notably, the CEX profile of a mAb digested in such a way typically contains two dominant peaks, one for the Fc and another for the Fab, along with various smaller charge variant peaks that are associated with each domain. The CEX profile of digested mAb-1, however, contained three dominant peaks (). There were no peaks remaining in the region of the intact mAb-1 profile, indicating that each of the three dominant peaks was a digestion product and presumably a domain of mAb-1. A check of the intrinsic fluorescence signal revealed that the profiles of all three peaks were significantly different from one another (). Once again peak fractions were collected, this time for all three dominant peaks. Upon reinjection, the fraction of peak-C was confirmed to contain only peak-C. Fractions of peak-A and peak-B, on the other hand, both chromatographed as a mixture of peak-A and peak-B (Supplemental ). The initial reinjection of the peak-A fraction chromatographed with the same ratio of peak-A and peak-B as was observed in the unfractionated sample, and that same ratio was reconfirmed in a second reinjection after the fraction was stored at 5°C for 16 hours. By contrast, the initial reinjection of the peak-B fraction chromatographed with a different ratio of peak-A and peak-B, but that ratio had re-equilibrated to what was seen in the unfractionated sample (and in the peak-A fraction) by the second reinjection, after the fraction was stored at 5°C for 16 hours. The fluorescence profile of each peak in the reinjected fractions remained consistent with the corresponding profile in the unfractionated sample.
Figure 2. Intact mAb-1 was enzymatically digested using GingisKHAN in the upper hinge region to generate Fab and Fc domains. The digested domains were analyzed by CEX using pH gradient elution as described in the method section. The CEX profile of digested mAb-1contained three dominant peaks with distinct intrinsic fluorescence. (a) CEX chromatogram of digested domains of mAb-1. (b) Fluorescence profile of the three major peaks of the digested mAb-1: peak-A in red (330 nm/350 nm = 1.15), peak-B in blue (330 nm/350 nm = 1.38), peak-C in black (330 nm/350 nm = 1.58)
RPLC-MS analysis of the domains of mAb-1
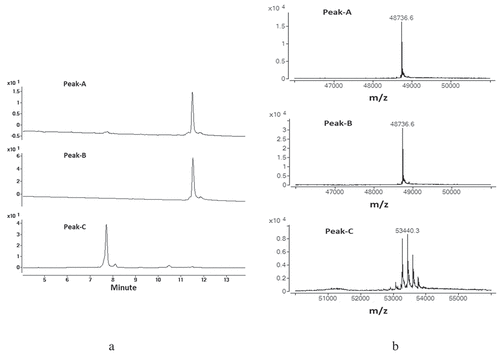
The three domain peaks (peak-A, peak-B, and peak-C) collected from CEX described as above were further characterized by RPLC-MS. shows the UV chromatogram and deconvoluted mass spectra of the three CEX peaks. The RPLC-MS results indicated that peak-A and peak-B had the same retention time as well as identical mass, which matched the theoretical mass of the Fab of mAb-1, while the mass of peak-C was consistent with the Fc domain.
Figure 3. Enzymatically digested mAb-1 domains were separated by CEX and the three major peaks (Peak-A, Peak-B, and PeakC) were collected. The collected fractions were analyzed by RPLC-MS . Peak-A and Peak-B demonstrated the same retention time and same mass. (a) UV spectrum of the three major peaks. (b) Deconvoluted mass spectrum for the three major peaks
Molecular modeling
In order to further understand the experimental findings at a molecular level, several forms of molecular modeling were performed on intact mAb-1 and its domains. An extremely long HC-CDR3 loop (20 amino acids long) exists in the heavy chain, which the homology modeling showed to have an extended conformation (). This HC-CDR3 loop is also highly flexible, as shown by the diverse conformations obtained both from the loop modeler and molecular dynamics (MD) simulations ( and ). This flexibility and the resulting conformational changes can lead to changes in the pKa values for titratable residues such as Asp, Glu, Arg, Lys, and His. The calculated pKa values for all the titratable residues in the conformations obtained from the loop modeler and MD simulations are shown in Supplemental . Two residues in particular (Asp-100, Asp-118) have high variability in their pKa values depending on the protein conformation, both of which are located at the base of the HC-CDR3 loop (). Thus, a change in the loop conformation would accompany a change in pKa of these titratable residues, which in turn would accompany a change in overall protein charge. Two particular conformations were identified from the loop modeler that demonstrated a significant change in pKa for these Asp residues. One of these conformations has the HC-CDR3 loop extended (open) whereas the other one has the loop bent (closed). These two conformations also differ in the extent of the solvent exposure of Trp-94 (), which is reduced significantly in the closed form where the HC-CDR3 loop is bent over the residue. It is noteworthy that all the Trp residues in this antibody are buried within the protein core, except for Trp-94 which is solvent exposed. A change in the solvent exposure of Trp-94 could therefore lead to the change in the fluorescence profile that is observed in the experimental data.
Figure 4. Molecular modeling. (a) Homology modele of mAb-1 with the HC-CDRs loop highlighted. (b) Loop modeling results showing the superposition of HC-CDR3 loop conformations. (c) Overlaid snopshots from the MD simulation
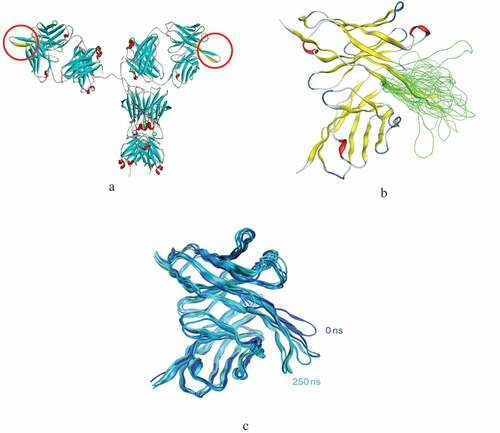
Figure 5. Comparison of molecular modeling results for the "open" and "closed" loop conformations. (a) Structures labeled with select pKa and solvent accessible surface area (SAA). (b) Hydrophobicity maps. (c) Charge analysis showing contiguous, charge surface patches
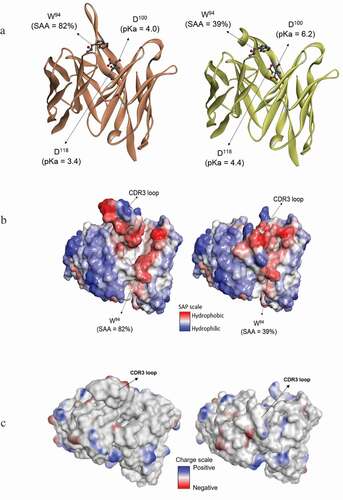
To further probe the differences between the open and closed-loop conformations, Spatial-Aggregation-Propensity (SAP) modeling () was performed. The SAP model displays the hydrophobic patches on the protein surface that are typically involved in protein-protein binding as well as aggregation.Citation26 The SAP model of this antibody shows there to be significant hydrophobic patches in and around the HC-CDR3 loop (). It is energetically unfavorable for these hydrophobic residues to be exposed to the solvent. In the second (closed) conformation, the HC-CDR3 loop bends to hide some of these hydrophobic patches, including the Trp-94 residue (). Therefore, it is expected that the closed conformation can also be a stable protein conformation. The contiguous charge surface patches was shown in . To further support this assertion, MD simulations were performed on the Fab group of mAb-1 starting from the structure with the open conformation of the HC-CDR3 loop (as in ). The HC-CDR3 loop remains flexible during the simulation () and after approximately 150 ns it is observed to close (Supplemental ). The MD results confirm that the closed conformation is energetically favorable and accessible under ambient conditions. Based on all the in silico modeling results, we propose that peak-3 observed in the CEX profile of mAb-1 represents the “open-loop conformation,” which has a lower isoelectric point (pI) and red-shifted fluorescence, while peak-4 represents the “closed-loop conformation,” which has a higher pI and blue-shifted fluorescence, and we therefore use this terminology throughout the remainder of the text.
Mining peptide mapping data for peptides containing Asp-100 and Asp-118
Based on the sequence of mAb-1, both Asp-100 and Asp-118 reside within a single tryptic peptide. To investigate the possibility that the two interconverting peaks observed in CEX arose from iso-aspartate formation of Asp-100 and/or Asp-118, tryptic peptide mapping of the intact mAb-1 was performed under our standard procedure, and standard tryptic peptide mapping data were then mined for the peptide containing these residues. Possibly due to the overall length and high hydrophobicity of this tryptic peptide, the peptide was not identified. Subsequently, chymotryptic peptide mapping of the intact mAb-1 was performed under our standard procedure, and the chymotryptic peptide mapping data were mined from which two smaller peptides were identified, one containing Asp-100 and another containing Asp-118. Extracted ion chromatography showed only a single peak for each peptide mass. This was further confirmed through accurate mass and MS/MS data (Supplemental ). In addition, no detectible succinimide intermediates were found in the peptide mapping data.
pH-dependent equilibrium of the proposed “open-loop” form and “closed-loop” form of mAb-1 investigated by CEX
Two additional sets of experiments were performed based on the outcome of the molecular modeling studies. First, the pH dependence of the ratio between peak-3 and peak-4 was investigated by adjusting the initial pH of the mobile phase of the CEX method. The fundamental steps of the CEX method consist of a one minute initial hold followed by two gradient elution steps. Prior to this point in the investigation, the CEX method had always begun with an initial hold and gradient that started with only NaH2PO4, which provided the lowest available pH for the mobile phase system in use. Going forward, the initial pH was incrementally increased by varying the proportion of NaH2PO4 and Na2HPO4 while the steepness of the gradient steps remained constant. This naturally resulted in a pH-dependent decrease in retention time and imposed a practical limit on the highest initial pH condition, which was determined by the minimum column retention required to still achieve adequate peak separation (see ). The results graphed in show a clear pH dependence for the ratio of peak-3 and peak-4, with peak-3, the proposed open-loop conformation, becoming more dominant as the initial pH of the mobile phase was increased from 4.5 to 6.4 and peak-4, the proposed closed-loop conformation, demonstrating the opposite trend. The second experiment for demonstrating the pH-dependent equilibrium of the ratio between peak-3 and peak-4 involved varying the holding time of the initial pH (pH = ~4.5) of the mobile phase before the gradient elution of the CEX method (see Supplemental ). Figure 6sB shows that peak-3 (proposed open-loop form) decreased when the initial holding time increased. This result was consistent with the first experiment, which shows that peak-3 becomes less dominant as the sample is exposed to a more acidic environment (for a longer period of time).
Figure 6. pH dependence of the interconversion of peak-3 and peak-4 were demonstrated using CEX by increasing the initial pH of the mobile phase. The desired initial pH of the mobile phase was achieved by altering the ratio of [NaH2PO4/Na2HPO4] and the pH value was measured offline by a pH meter. (a) CEX chromatographs of intact mAb-1 with different initial pHs of the mobile phase. (Color, initial pH mobile phase): Brown: pH ~6.4, Pink: pH ~6.2; Light blue: pH ~6.1; Green: pH ~5.9; Blue: pH ~5.4; Black: pH ~4.5. (b) Area % of peak-3 and peak-4: area of peak-3 increased when the initial pH of mobile phase increased (blue column); area of peak-4 decreased when the initial pH of mobile phase increased (orange column)
![Figure 6. pH dependence of the interconversion of peak-3 and peak-4 were demonstrated using CEX by increasing the initial pH of the mobile phase. The desired initial pH of the mobile phase was achieved by altering the ratio of [NaH2PO4/Na2HPO4] and the pH value was measured offline by a pH meter. (a) CEX chromatographs of intact mAb-1 with different initial pHs of the mobile phase. (Color, initial pH mobile phase): Brown: pH ~6.4, Pink: pH ~6.2; Light blue: pH ~6.1; Green: pH ~5.9; Blue: pH ~5.4; Black: pH ~4.5. (b) Area % of peak-3 and peak-4: area of peak-3 increased when the initial pH of mobile phase increased (blue column); area of peak-4 decreased when the initial pH of mobile phase increased (orange column)](/cms/asset/8947a28c-777c-4463-ab81-0fc3907cf7d0/kmab_a_1763138_f0006_oc.jpg)
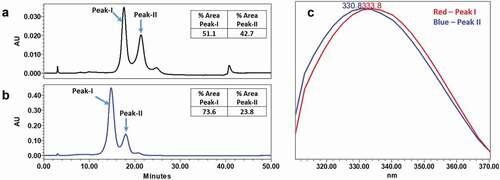
pH-dependent equilibrium of the proposed “open-loop” form and “closed-loop” form of mAb-1 investigated by HIC
The behavior of mAb-1 was further investigated by HIC to provide additional supporting experimental evidence with a technique orthogonal to CEX. The same NaH2PO4 and Na2HPO4 buffer system used to control the pH of CEX separations was used for HIC, but, unlike CEX, the pH of each HIC separation was held constant while binding and elution of mAb-1 from the column was controlled with a (NH4)2SO4 gradient. A mobile phase pH of 4.6 was attained by using NaH2PO4 as the only buffering agent. The resulting HIC profile contained two prominent peaks (peak-I and peak-II in ) with intrinsic fluorescence profiles that differed from one another to a similar degree compared to what was observed between peak-3 and peak-4 in the CEX profile (). The peak areas of peak-I/peak-II were 51.1%/42.7% and the intrinsic fluorescence profiles were red shifted/blue shifted, respectively. Upon raising the mobile phase pH to 6.4 by using an equal proportion of NaH2PO4 and Na2HPO4, the peak area of peak-I/peak-II shifted to 73.6%/23.8%, consistent with the pH-dependence of the proposed conformational equilibrium in the HC-CDR3 loop of mAb-1. Finally, fractions of peak-I and peak-II were collected and reinjected. The initial reinjection of the peak-I fraction had nearly re-equilibrated to a ratio of peak-I/peak-II that resembled what was observed in the unfractionated sample, while the peak-II fraction was somewhat slower to re-equilibrate. Both peak fractions had fully re-equilibrated after being stored at 5°C for 12 hours (Supplemental ). Based on the consistency of data between CEX and HIC experiments, the earlier eluting (less hydrophobic, red shifted) peak-I contained the proposed open-loop conformation while the later eluting (more hydrophobic, blue shifted) peak-II contained the proposed closed-loop conformation.
Figure 7. Analysis of mAb-1 using HIC. mAb-1 demonstrated two main peaks (peak I and peak II) in HIC analysis, and the two main peaks exhibited different intrinsic fluorescence. pH dependence of the interconversion of peak-I and peak-II were demonstrated using HIC by increasing the initial pH of the mobile phase. (a) HIC chromatographs of intact mAb-1 using acidic (pH 4.6) mobile phase. (b) HIC chromatographs of intact mAb-1 using near neutral mobile phase (pH 6.4). (c) Fluorescence profile of peak-I and peak-II
Antigen-binding assay
The hypothesis that the observed conformational equilibria of mAb-1 involved the HC-CDR3 raises the obvious question of functional impact. More specifically, are the kinetics/affinity of the proposed open-loop conformation and the closed-loop conformation for their antigen similar or different? In order to assess any possible functional impact of the conformational equilibrium of mAb-1, an antigen-binding assay was performed using standard SPR. The two main peaks, peak-3, and peak-4, collected from CEX described as above, as well as unfractionated mAb-1 were subjected to SPR study. Notably, the sample preparation procedure requires dilution and equilibration in a solution buffered at pH 7.4. SPR binding analysis demonstrated comparable kinetics/affinity between these fractionated peaks and unfractionated mAb-1 (Supplemental Figure 8s and Table 3s).
Discussion
The charge variant profile is among the most routinely monitored attributes of a therapeutic mAb because it contains a wealth of information that chronicles the influence of various processes and environmental factors on charge-based heterogeneity. Changes to the charge variant profile observed throughout the manufacturing stages can reflect the contributions of various enzymatic and non-enzymatic processes to charge heterogeneity, while subsequent monitoring throughout the drug product development and stability testing stages, where pH and temperature-related deamidation are common concerns, helps inform the selection of product composition and storage conditions for minimizing further changes in charge heterogeneity.Citation27,Citation28 The successful collection and application of such information is, however, dependent on the ability to obtain a high-quality charge variant profile, which in turn depends on the analysis technique of choice as well as the protein of interest. And in some cases, as with our investigation of mAb-1, the charge variant profile may contain unexpected information regarding conformational heterogeneity and dynamics.
In contrast to a technique such as isoelectric focusing, which separates charge variants based solely on differences in net charge, ion-exchange chromatography (including anion and cation exchange modes) separates charge variants based on several factors including differences in net charge, as well as changes that do not necessarily affect net charge but instead affect the exposure or distribution of charges on the protein surface.Citation29,Citation30 This may involve a simple chemical modification (e.g., methionine oxidation,Citation31,Citation32 asparagine cyclizationCitation33) that produces a rearrangement of neighboring charges or a change in the size or continuity of a charged surface patch, or a conformational change that occurs independent of any chemical modification,Citation34 or even a combined conformational-chemical modification effect.Citation35–Citation37 It is also possible that the location of a particular modification will influence chromatographic peak retention, as has been reported for singly deamidated variants,Citation38 succinimide intermediates,Citation39 and antibody-drug conjugates.Citation40 The specific protein of interest requires a similar depth of consideration since detection of the aforementioned phenomena by CEX relies on protein–column interactions involving the affected region of the protein. Whether or not this happens largely depends on the charge distribution or charge anisotropy of the protein since proteins do not randomly interact with the column and instead have been shown to adopt preferred orientations for protein–column interactions.Citation41,Citation42
In our case, two separate peaks were observed in both the CEX and HIC profile of mAb-1 that was interpreted to reflect an equilibrium between two discrete conformations of the HC-CDR3. Isolated fractions of each peak would re-equilibrate upon reinjection, the ratio of the two peaks was sensitive to changes in pH of the mobile phase, and there was a difference in conformation between the peaks that was apparent from in-line intrinsic fluorescence. Similar observations have been independently reported by several different groups of authors. For instance, Luo et al.Citation43 observed a pH-dependent equilibrium between two peaks that they attributed to the protonated and unprotonated forms of a single histidine in one of the HC-CDR loops of a mAb; however, they did not conclusively determine whether a conformational change was necessarily concomitant with their observations. In a separate report involving a different mAb, Luo et al.Citation44 determined that the observed equilibrium between two peaks resulted from reversible self-association that was induced by salt in the CEX elution buffer, and they found the ratio of the two peaks to be sensitive to different salt types at the same pH. Guo et al.Citation45 found no evidence of conformational differences between two interconverting peaks and concluded that their observations were due to the presence of two distinctly different binding sites on the CEX resin. Kimerer et al.Citation34 determined that the observed interconversion of three peaks for three different bispecific antibodies resulted from conformational changes induced by the CEX resin, but there was no pH dependence. The same group of authors demonstrated in a related report that the unique intrinsic fluorescence profile of each peak supported their conclusion that each peak represented a unique conformation.Citation34 Most recently, Masiero et al. determined that the pH dependence of two interconverting peaks observed in the size exclusion chromatography profile of a trispecific anti-HIV antibody resulted from a conformational equilibria involving proline isomerization in the HC-CDR3 and a neighboring histidine in the light chain.Citation46 While each of these reports describes one or more of the phenomena we observed during our investigation of mAb-1, none of them account for the totality of our observations.
We propose that the pH-dependent equilibrium between two discrete conformations of the HC-CDR3 of mAb-1 is coupled with a conformation-dependent pKa of two ionizable groups within the same loop. Rationalization of our experimental findings in support of these claims becomes clear upon a detailed consideration of the HC-CDR3 loop itself as well as the microenvironment of the loop and the surrounding surface area of the Fab. The HC-CDR3 of mAb-1 is 20 amino acids long, which is at the upper end of the length distribution reported for this CDR loop,Citation15 and it is mostly composed of hydrophobic amino acids. Despite this localized hydrophobicity, the surrounding surface area of the Fab is rich with positively charged patches () that provide an ideal contact interface for the CEX column material. Such consideration of the molecular electrostatic surface potential provides insight into the sensitivity of our CEX method to changes in this region of the molecule and is consistent with the strategy used by other authors to rationalize the preferred binding orientations of proteins exposed to ion exchange resins.Citation34,Citation47-Citation50 A similar argument can be made for HIC (), where the HC-CDR3 loop itself would provide a hydrophobic contact surface, while the elution order of less hydrophobic open conformation/more hydrophobic closed conformation can be rationalized by noting the relative deprotonated/protonated state of Asp-100 and Asp-118 in the proposed opened/closed conformations. In the case of RPLC (), the identical retention times of the two Fab peaks results from the aggressively denaturing method conditions.
Asp-100 and Asp-118 are among the few ionizable amino acids in the HC-CDR3 and they are located at the ends of the loop. The possibility of Asp cyclization and isomerization being responsible for the anomalous analytical profile of mAb-1 was ruled out by peptide mapping studies. Our findings are further supported by the extensive body of literature pertaining to this topic. Isomerization of aspartic acid to isoaspartic acid (iso-Asp) is a well-known non-enzymatic post-translational modification and could contribute to apparent charge variant heterogeneity in recombinant mAbs.Citation35,Citation51,Citation52 Extensive studies have been reported on the kinetics of Asp isomerization, and have shown that residues having less steric hindrance, such as a glycine or a serine, in the n + 1 position are hot spots for isomerization.Citation53,Citation54 In our case, the n + 1 residues following Asp-100 and Asp118 are tyrosine and valine, and thus formation of iso-Asp under non-stressed condition was not expected within the timescale of our experiment.
Based on our in silico modeling results, we propose the following molecular-level mechanism to explain our experimental observations of mAb-1. At mildly acidic pH the loop adopts a closed conformation where it folds against the variable region and becomes stabilized by multiple hydrogen bonds and hydrophobic interactions. Asp-100 and Asp-118 become shielded from the solvent and the pKa of the side chains is raised by intramolecular interactions with neighboring amino acids to prevent the otherwise unfavorable ionization of the side chains in the relatively nonpolar microenvironment. Pioneering work by Tanford et al. on beta-lactoglobulin produced the earliest detailed reports of an anomalous conformation-dependent pKa of an internal carboxyl group,Citation55,Citation56 and helped to support a related report from Tanford articulating the fact that a conformation-dependent pKa change of at least one ionizable group is a necessary consequence of pH-dependent conformational equilibria.Citation57 Decades later, multiple independent researchers continued to build upon Tanford’s work by providing crystallographic evidence of the specific glutamic acid within beta-lactoglobulin whose side chain demonstrates a conformation-dependent pKa, thus shedding additional light on the molecular basis of the so-called pH-dependent “Tanford Transition” of this protein.Citation58,Citation59 In the case of NP4, it took multiple groups of authors several years to elucidate that a pH-dependent change between two discrete conformations was concomitant with a conformation-dependent change to the pKa of a specific Asp side chain.Citation23,Citation25,Citation60 Other notable examples of naturally occurring pH-conformation-pKa interdependencies include a pair of viral glycoproteins (one involving multiple Glu and Asp side chainsCitation61 and the other involving a His side chainCitation62), and a pheromone-binding protein involving two His side chains.Citation63 Furthermore, Garcia-Moreno and colleagues showed through a series of publications involving multiple engineered variants of staphylococcal nuclease that internal Glu, Asp and Lys residues could have highly anomalous pKa values.Citation64–Citation67 Future experimental approaches with mAb-1 could include hydrogen-deuterium exchange (HDX) or crystallography, which could provide the most detailed and conclusive molecular-level evidence. In fact, preliminary HDX experiments were conducted but were inconclusive. This was not entirely surprising given the challenges associated with peptide mapping that stemmed from the particularly long and hydrophobic nature of the HC-CDR3 loop. Specifically, HDX experiments were unable to obtain sufficient sequence coverage of the HC-CDR3 loop to enable any meaningful interpretation.
Using an investigative approach that combined multiple experimental and computational techniques, we were able to establish the likely root cause of mAb-1’s anomalous charge variant profile, as well as the factors that influence the proposed underlying pH-dependent, conformational equilibria of the HC-CDR3. Moreover, we highlighted the importance of carefully considering how such equilibria are influenced by assay conditions, including functional binding assays. Despite collecting individual chromatographic peak fractions containing either the proposed open-loop conformation or the proposed closed-loop conformation for ligand binding analysis, we hypothesize that the conditions of the binding assay (physiological conditions, pH 7.4) drove the conformational equilibrium to favor the open-loop conformation and thus precluded direct ligand binding analysis of the closed-loop conformation. By the same line of reasoning, we can contend that the conformational equilibrium has no negative impact on the biological function of mAb-1. This work demonstrated that complex proteins such as mAbs can have unique conformational dynamics that have unexpected effects on routine stability-indicating assays and it emphasized the value of combining orthogonal technologies to support the analytical, biophysical, and functional characterization of mAbs.
Materials and methods
Materials
The therapeutic mAb (IgG1) was expressed in Chinese hamster ovary cells and produced by Bristol Myers Squibb (Princeton, NJ). Chemical and buffer components were purchased from Sigma-Aldrich or VWR and were the highest grade available. Digestion enzyme (GingisKHAN) was purchased from Genovis (Cambridge, MA). All buffers were made in house with deionized water filtered with an EMD Millipore MilliQ system (Burlington, MA).
CEX
CEX was performed on a Thermo Scientific MabPac SCX-10 column (4 mm x 250 mm, packed with 5 µm pellicular particles) attached to a Waters ACQUITY H-Class Bio System equipped with an external 30 cm column heater, photodiode array (PDA) detector, fluorescence (FLR) detector, and fraction manager. The PDA and FLR detectors were connected in series. For fraction collection experiments the FLR detector was disconnected and the fraction manager was connected downstream of the PDA. Mobile phases A-C consisted of 200 mM NaH2PO4 (A), 200 mM Na2HPO4 (B), and water (C). Two sets of separation conditions were used throughout this study depending on resolution and retention requirements of intact mAb-1 and mAb-1 Fc and Fab domains. For fraction collection of intact mAb-1 where higher resolution between individual charge variant peaks was needed, samples were held on column for 1 minute at 20%/0%/80% v/v/v, and then eluted with a two-stage linear gradient at a flow rate of 0.5 mL/min. The first stage changed to 12.5%/7.5%/80% v/v/v in 20 minutes and the second stage changed to 0%/20%/80% v/v/v in 4 minutes. The second set of separation conditions used slightly lower total ionic strength to promote adequate retention of mAb-1 Fc and Fab domains. Specifically, samples were held on the column for 1 minute at 15%/0%/85% v/v/v, and then eluted with a two-stage linear gradient at a flow rate of 0.5 mL/min. The first stage changed to 9.4%/5.6%/85% v/v/v in 20 minutes and the second stage changed to 0%/15%/85% v/v/v in 4 minutes. All samples and fractions were injected neat, and column loading varied from 20 to 400 µg, with the lower loadings being used for reinjecting fractions while higher loadings were used for collecting fractions. PDA (FLR) data were collected from 210 to 400 nm (Ex: 274 nm, Em: 310–370 nm) and integrated from an extracted wavelength of 280 nm (333 nm). The column compartment was set to 30°C and the sample compartment and fraction collection compartment were set to 5°C. The pH values of the collected two main fractions (6.41 for peak-3 and 6.43 for peak-4) were measured using an Orion Versa Star Pro pH meter (Thermo Scientific).
Enzyme (gingisKHAN®) digestion
The enzymatic digestion of mAb-1 was performed according to the manufacturer’s instructions with slight modifications. Briefly, 2000 U GingisKHAN (Genovis Inc., Cambridge, MA) was reconstituted in 200 µL diH2O, and the 10x reducing agent was prepared in 50 µL diH2O for a final concentration of 20 mM cysteine immediately before each use. The original 20 mg/mL of mAb-1 was diluted to a concentration of 5 mg/mL in the mAb-1 formulation buffer (20 mM histidine, 260 mM sucrose, pH 6.0). 100 µL diluted mAb solution was subsequently mixed with 50 µL reconstituted GingisKHAN and 15 µL of freshly prepared reducing agent. The mixture was then incubated at 37°C for 3 hours. The digestion process was closely monitored by CEX.
SPR
SPR studies were performed on a Biacore T200 instrument (General Electric Healthcare) at 37°C. The binding of the analyte was tested in 10 mM HEPES, 150 mM NaCl, and 0.05% p20 (PBS-T) (pH 7.4) on surfaces consisting of a low density (∼300 RU) of mAb-1 fractions captured on a Protein A sensor chip (General Electric Healthcare). The protein analytes were injected in a titration series and regenerated back to baseline, which was performed by 2 × 30 sec injections of 10 mM Glycine – HCl (pH 1.5). The data were analyzed using the Biacore T200 Evaluation software (General Electric Healthcare).
RPLC-MS
RPLC-MS method was performed on an Agilent infinity 1290 UPLC system coupled with an Agilent 6230 TOF mass spectrometer. The column used for separation was a Waters BEH C4 column with 300 Å pore size, 1.7 µm particle, 2.1 × 150 mm. Mobile phase A was 80% water, 10% acetonitrile, 10% n-propanol, 0.1% trifluoroacetic acid (TFA). Mobile phase B was 80% n-butanol, 10% acetonitrile, 10% n-propanol, 0.1% TFA. Separation gradient was 0% to 10% B in 10 min, followed by 10% to 30% in 3 min. Column temperature was kept at 90°C, and flow rate is 0.5 mL/min. Key mass spectrometer conditions used for analysis were as the following: gas temperature is 325°C, sheath gas temperature is 350°C, capillary voltage is 5000 V, nozzle voltage was 1000 V, fragmentor voltage was 400 V.
In silico modeling methodology
The antibody 3D structure was obtained through homology modeling using the standard protocol for antibody modeling within molecular operating environment (MOE) software (Chemical Computing Group, Montreal, Canada). We then obtained different conformations of the protein in solution through two techniques: 1) loop modeler, and 2) MD simulations. The loop modeler was used to generate diverse conformations for the CDR loops as implemented in the MOE software. This involves searching for loops of similar sequence length with diverse conformations in a database of non-redundant protein chains from the Protein Data Bank. We also obtained possible protein conformations through 250ns MD simulations of the Fab region of the antibody. For the simulation, the AMBER10 (University of California, San Francisco, CA) fully atomistic force field was used for the protein and TIP3PCitation68 solvent model for water. The simulations were performed at 300 K and 1 atm in the NPT ensemble. We used MOE software for model set-up and Nanoscale Molecular Dynamics (NAMD) software for simulations.Citation69 The conformations obtained from loop modeler and MD simulations were analyzed for any differences in pKa of titratable residues and solvent exposure of Trp residues. The pKa is predicted based on the electrostatic interactions of these residues to other residues within the protein structure using the protein ionization protocol in the Discovery Studio software (BIOVIA Software Inc, San Diego, CA). For a selected set of conformations, we also performed SAP modelingCitation26 to determine the hydrophobic patches on the protein surface using the Discovery Studio software.
Peptide mapping
The reduction of the disulfide bonds of the antibody was performed by mixing 1 mg of mAb-1 with 200 μL of 8 M guanidine hydrochloride, 18 μL of 0.2 M dithiothreitol, and 60 μL of 0.8 M trizma (pH = 7.6), then incubating the mixture at 37°C for 30 minutes. Alkylation of the cysteine was conducted by the addition of 18 µL of 0.4 M sodium iodoacetate to the reduced antibody and incubated in the dark for 15 minutes at room temperature. The desalting was followed by transferring the reduced and alkylated solution into a NAP-5 column, then exchanging with digestion buffer (50 mM, pH 7.6 Trizma, 10 mM CaCl2). Finally, the chymotryptic digestion was carried out by mixing desalted solution with chymotrypsin (protein: chymotrypsin ratio = 25:1) and incubating them at 37°C for 30 min.
RPLC-MS for peptide mapping has applied a Thermo Fisher Scientific Q Exactive™ Hybrid Quadrupole-Orbitrap™ Mass Spectrometer (Thermo, Waltham, MA) coupled to Waters ACQUITY UPLC (Waters, Milford, MA) with a C18 column (Waters UPLC BEH130 C18 1.7 μm 2.1 × 100 mm). Mobile phase A (aqueous) contains 0.1% TFA in water, while mobile phase B (organic) consists of 0.085% TFA in acetonitrile. The flow rate and column temperature were maintained at 0.4 mL/min and 45◦C, respectively. The gradient began with a 2.5-min hold at 2% of B, followed by an increase to 12%, 19.5%, 21%, 29%, 31%, 45% at 15, 30, 42, 55, 61, 74 minutes, respectively, then finally reached 100% at 74.1 minutes.
GPMAW and Thermo Biopharma (Pinpoint and Protein discovery) were used for data processing.
HIC
HIC was performed on a TSKgel ETHER-5PW column (7.5 mm x 75 mm, packed with 10 µm porous particles) attached to the same Waters ACQUITY H-Class Bio System described for CEX experiments. The fraction manager module was not used for HIC experiments as peak fractions were collected manually from the outlet line of the FLR detector. Mobile phases A-D consisted of 200 mM NaH2PO4 (A), 200 mM Na2HPO4 (B), 1 M (NH4)2SO4 (C) and water (D). All injections were held on column for 2 minutes at 20%/0%/70%/10% v/v/v/v, and then eluted with a single stage linear gradient over 30 minutes to 20%/0%/0%/80% v/v/v/v at a flow rate of 0.8 mL/min. A second set of separation conditions employed 10% mobile phase A and 10% mobile phase B in place of 20% mobile phase A. All samples and fractions were injected neat. Column loading was at 100 µg for samples, 1 mg for fraction collection and ~5-15 µg for reinjected fractions. PDA and FLR settings for data collection matched those described for CEX experiments. The column compartment was set to 25°C and the sample compartment was set to 5°C.
Disclosure of potential conflicts of interest
No potential conflict of interest was reported by the authors.
Supplemental Material
Download MS Word (2.3 MB)Acknowledgments
The authors thank Rekha Bhashyam for helping in collection of CEX fractions for the antigen binding assay. Rekha is a full-time contractor of Bristol-Myers Squibb Company.
Supplementary material
Supplemental data for this article can be accessed on the publisher’s website.
References
- Marsh JA, Teichmann SA, Forman-Kay JD. Probing the diverse landscape of protein flexibility and binding. Curr Opin Struct Biol. 2012;22(5):643–13. doi:https://doi.org/10.1016/j.sbi.2012.08.008.
- Koshland DE. Enzyme flexibility and enzyme action. J Cell Comp Physiol. 1959;54(S1):245–58. doi:https://doi.org/10.1002/jcp.1030540420.
- Eisenmesser EZ, Millet O, Labeikovsky W, Korzhnev DM, Wolf-Watz M, Bosco DA, Skalicky JJ, Kay LE, Kern D. Intrinsic dynamics of an enzyme underlies catalysis. Nature. 2005;438(7064):117–21. doi:https://doi.org/10.1038/nature04105.
- Kamerzell TJ, Middaugh CR. The complex inter-relationships between protein flexibility and stability. J Pharm Sci. 2008;97(9):3494–517. doi:https://doi.org/10.1002/jps.21269.
- Frauenfelder H, Sligar SG, Wolynes PG. The energy landscapes and motions of proteins. Science. 1991;254(5038):1598–603. doi:https://doi.org/10.1126/science.1749933.
- Henzler-Wildman K, Kern D. Dynamic personalities of proteins. Nature. 2007;450(7172):964–72. doi:https://doi.org/10.1038/nature06522.
- Bonomi M, Vendruscolo M. Determination of protein structural ensembles using cryo-electron microscopy. Curr Opin Struct Biol. 2019;56:37–45. doi:https://doi.org/10.1016/j.sbi.2018.10.006.
- Van Den Bedem H, Fraser JS. Integrative, dynamic structural biology at atomic resolution - It’s about time. Nat Methods. 2015;12(4):307–18. doi:https://doi.org/10.1038/nmeth.3324.
- Bonomi M, Heller GT, Camilloni C, Vendruscolo M. Principles of protein structural ensemble determination. Curr Opin Struct Biol. 2017;42:106–16. doi:https://doi.org/10.1016/j.sbi.2016.12.004.
- Berkowitz SA, Houde DJ. The complexity of protein structure and the challenges it poses in developing biopharmaceuticals. In Houde DJ, Berkowitz SA, editors. Biophysical characterization of proteins in developing biopharmaceuticals. MA: Elsevier; 2014. 1–21.
- Rabia LA, Desai AA, Jhajj HS, Tessier PM. Understanding and overcoming trade-offs between antibody affinity, specificity, stability and solubility. Biochem Eng J. 2018;137:365–74. doi:https://doi.org/10.1016/j.bej.2018.06.003.
- Manikwar P, Majumdar R, Hickey JM, Thakkar SV, Samra HS, Sathish HA, Bishop SM, Middaugh CR, Weis DD, Volkin DB. Correlating excipient effects on conformational and storage stability of an IgG1 monoclonal antibody with local dynamics as measured by hydrogen/deuterium-exchange mass spectrometry. J Pharm Sci. 2013;102(7):2136–51. doi:https://doi.org/10.1002/jps.23543.
- Ewert S, Huber T, Honegger A, Plückthun A. Biophysical properties of human antibody variable domains. J Mol Biol. 2003;325(3):531–53. doi:https://doi.org/10.1016/S0022-2836(02)01237-8.
- Wang X, Das TK, Singh SK, Kumar S. Potential aggregation prone regions in biotherapeutics: A survey of commercial monoclonal antibodies. mAbs. 2009;1(3):254–67. doi:https://doi.org/10.4161/mabs.1.3.8035.
- Wu TT, Johnson G, Kabat EA. Length distribution of CDRH3 in antibodies. Proteins: Structure, Function, and Bioinformatics. 1993;16(1):1–7. doi:https://doi.org/10.1002/prot.340160102.
- Weitzner BD, Dunbrack RL, Gray JJ. The origin of CDR H3 structural diversity. Structure. 2015;23(2):302–11. doi:https://doi.org/10.1016/j.str.2014.11.010.
- Marks C, Deane CM. Antibody H3 structure prediction. Comput Struct Biotechnol J. 2017;15:222–31. doi:https://doi.org/10.1016/j.csbj.2017.01.010.
- Koshland DE. Application of a theory of enzyme specificity to protein synthesis. Proceedings National Academy of Sci. 1958;44(2):98–104. doi:https://doi.org/10.1073/pnas.44.2.98.
- Monod J, Wyman J, Changeux JP. On the nature of allosteric transitions: a plausible model. J Mol Biol. 1965;12(1):88–118. doi:https://doi.org/10.1016/S0022-2836(65)80285-6.
- Changeux J-P, Edelstein S. Conformational selection or induced fit? 50 years of debate resolved. F1000 Biol Rep. 2011;3:19–19. doi:https://doi.org/10.3410/B3-19.
- Boehr DD, Nussinov R, Wright PE. The role of dynamic conformational ensembles in biomolecular recognition. Nat Chem Biol. 2009;5(11):789–96. doi:https://doi.org/10.1038/nchembio.232.
- Fernández-Quintero ML, Kraml J, Georges G, Liedl KR. CDR-H3 loop ensemble in solution – conformational selection upon antibody binding. mAbs. 2019;11(6):1077–88. doi:https://doi.org/10.1080/19420862.2019.1618676.
- Kondrashov DA, Roberts SA, Weichsel A, Montfort WR. Protein functional cycle viewed at atomic resolution: conformational change and mobility in nitrophorin 4 as a function of pH and NO binding. Biochemistry. 2004;43(43):13637–47. doi:https://doi.org/10.1021/bi0483155.
- Menyhárd DK, Keserü GM. Protonation state of Asp30 exerts crucial influence over surface loop rearrangements responsible for NO release in nitrophorin 4. FEBS Lett. 2005;579(24):5392–98. doi:https://doi.org/10.1016/j.febslet.2005.09.003.
- Di Russo NV, Estrin DA, Martí MA, Roitberg AE. pH-dependent conformational changes in proteins and their effect on experimental pkas: the case of nitrophorin 4. PLoS Comput Biol. 2012;8(11). doi:https://doi.org/10.1371/journal.pcbi.1002761.
- Chennamsettya NV, Kaysera V, Helkb, B V, Trouta BL. Design of therapeutic proteins with enhanced stability.pdf. PNAS. 2009;106:11937–42.
- Chung S, Tian J, Tan Z, Chen J, Zhang N, Huang Y, Vandermark E, Lee J, Borys M, Li ZJ. Modulating cell culture oxidative stress reduces protein glycation and acidic charge variant formation. mAbs. 2019;11(1):205–16. doi:https://doi.org/10.1080/19420862.2018.1537533.
- Liu H, Nowak C, Shao M, Ponniah G, Neill A. Impact of cell culture on recombinant monoclonal antibody product heterogeneity. Biotechnol Prog. 2016;32(5):1103–12. doi:https://doi.org/10.1002/btpr.2327.
- Vlasak J, Ionescu R. Heterogeneity of monoclonal antibodies revealed by charge-sensitive methods. Curr Pharm Biotechnol. 2008;9(6):468–81. doi:https://doi.org/10.2174/138920108786786402.
- Du Y, Walsh A, Ehrick R, Xu W, May K, Liu H. Chromatographic analysis of the acidic and basic species of recombinant monoclonal antibodies. mAbs. 2012;4(5):578–85. doi:https://doi.org/10.4161/mabs.21328.
- Chumsae C, Gaza-Bulseco G, Sun J, Liu H. Comparison of methionine oxidation in thermal stability and chemically stressed samples of a fully human monoclonal antibody. J Chromatogr B Analyt Technol Biomed Life Sci. 2007;850(1–2):285–94. doi:https://doi.org/10.1016/j.jchromb.2006.11.050.
- Teshima G, Li MX, Danishmand R, Obi C, To R, Huang C, Kung J, Lahidji V, Freeberg J, Thorner L, et al. Separation of oxidized variants of a monoclonal antibody by anion-exchange. J Chromatogr A. 2011;1218(15):2091–97. doi:https://doi.org/10.1016/j.chroma.2010.10.107.
- Yan B, Steen S, Hambly D, Valliere-Douglass J, Vanden Bos T, Smallwood S, Yates Z, Arroll T, Han Y, Gadgil H, et al. Succinimide formation at Asn 55 in the complementarity determining region of a recombinant monoclonal antibody IgG1 heavy chain. J Pharm Sci. 2009;98(10):3509–21. doi:https://doi.org/10.1002/jps.21655.
- Kimerer LK, Pabst TM, Hunter AK, Carta G. Chromatographic behavior of bivalent bispecific antibodies on cation exchange columns. I. Experimental observations and phenomenological model. J Chromatogr A. 2019 Sept.13;1801:121–231. doi:https://doi.org/10.1016/j.chroma.2019.04.012.
- Ponniah G, Nowak C, Neill A, Liu H. Characterization of charge variants of a monoclonal antibody using weak anion exchange chromatography at subunit levels. Anal Biochem. 2017;520:49–57. doi:https://doi.org/10.1016/j.ab.2016.12.017.
- Harris RJ, Kabakoff B, Macchi FD, Shen FJ, Kwong M, Andya JD, Shire SJ, Bjork N, Totpal K, Chen AB. Identification of multiple sources of charge heterogeneity in a recombinant antibody. J Chromatogr B Biomed Sci Appl. 2001;752(2):233–45. doi:https://doi.org/10.1016/S0378-4347(00)00548-X.
- Vlasak J, Bussat MC, Wang S, Wagner-Rousset E, Schaefer M, Klinguer-Hamour C, Kirchmeier M, Corvaïa N, Ionescu R, Beck A. Identification and characterization of asparagine deamidation in the light chain CDR1 of a humanized IgG1 antibody. Anal Biochem. 2009;392(2):145–54. doi:https://doi.org/10.1016/j.ab.2009.05.043.
- Perkins M, Theiler R, Lunte S, Jeschke M. Determination of the origin of charge heterogeneity in a murine monoclonal antibody. Pharm Res. 2000;17(9):1110–17. doi:https://doi.org/10.1023/A:1026461830617.
- Sreedhara A, Cordoba A, Zhu Q, Kwong J, Liu J. Characterization of the isomerization products of aspartate residues at two different sites in a monoclonal antibody. Pharm Res. 2012;29(1):187–97. doi:https://doi.org/10.1007/s11095-011-0534-2.
- Zhang Z, Zhou S, Han L, Zhang Q, Pritts WA. Impact of linker-drug on ion exchange chromatography separation of antibody-drug conjugates. mAbs. 2019;11(6):1113–21. doi:https://doi.org/10.1080/19420862.2019.1628589.
- Kopaciewicz W, Rounds MA, Fausnaugh J, Regnier FE. Retention model for high-performance ion-exchange chromatography. J Chromatogr A. 1983;266(C):3–21. doi:https://doi.org/10.1016/S0021-9673(01)90875-1.
- Regnier FE. The role of protein structure in chromatographic behavior. Science. 1987;238(4825):319–23. doi:https://doi.org/10.1126/science.3310233.
- Luo H, Cao M, Newell K, Afdahl C, Wang J, Wang WK, Li Y. Double-peak elution profile of a monoclonal antibody in cation exchange chromatography is caused by histidine-protonation-based charge variants. J Chromatogr A. 2015;1424:92–101. doi:https://doi.org/10.1016/j.chroma.2015.11.008.
- Luo H, Macapagal N, Newell K, Man A, Parupudi A, Li Y, Li Y. Effects of salt-induced reversible self-association on the elution behavior of a monoclonal antibody in cation exchange chromatography. J Chromatogr A. 2014;1362:186–93. doi:https://doi.org/10.1016/j.chroma.2014.08.048.
- Guo J, Creasy AD, Barker G, Carta G. Surface induced three-peak elution behavior of a monoclonal antibody during cation exchange chromatography. J Chromatogr A. 2016;1474:85–94. doi:https://doi.org/10.1016/j.chroma.2016.10.061.
- Masiero A, Nelly L, Marianne G, Christophe S, Florian L, Ronan C, Claire B, Cornelia Z, Grégoire B, Eric L, et al. The impact of proline isomerization on antigen binding and the analytical profile of a trispecific anti-HIV antibody. mAbs. 2020;12:1. doi:https://doi.org/10.1080/19420862.2019.1698128.
- Hallgren E, Kálmán F, Farnan D, Horváth C, Ståhlberg J. Protein retention in ion-exchange chromatography: effect of net charge and charge distribution. J Chromatogr A. 2000;877(1–2):13–24. doi:https://doi.org/10.1016/S0021-9673(00)00190-4.
- Yu L, Zhang L, Sun Y. Protein behavior at surfaces: orientation, conformational transitions and transport. J Chromatogr A. 2015;1382:118–34. doi:https://doi.org/10.1016/j.chroma.2014.12.087.
- Kittelmann J, Lang KMH, Ottens M, Hubbuch J. Orientation of monoclonal antibodies in ion-exchange chromatography: a predictive quantitative structure–activity relationship modeling approach. J Chromatogr A. 2017;1510:33–39. doi:https://doi.org/10.1016/j.chroma.2017.06.047.
- Chung WK, Hou Y, Freed A, Holstein M, Makhatadze GI, Cramer SM. Investigation of protein binding affinity and preferred orientations in ion exchange systems using a homologous protein library. Biotechnol Bioeng. 2009;102(3):869–81. doi:https://doi.org/10.1002/bit.22100.
- Diepold K, Bomans K, Wiedmann M, Zimmermann B, Petzold A, Schlothauer T, Mueller R, Moritz B, Stracke JO, Mølhøj M, et al. Simultaneous assessment of asp isomerization and asn deamidation in recombinant antibodies by LC-MS following incubation at elevated temperatures. PLoS One. 2012;7(1):e30295. doi:https://doi.org/10.1371/journal.pone.0030295.
- Eakin CM, Miller A, Kerr J, Kung J, Wallace A. Assessing analytical methods to monitor isoAsp formation in monoclonal antibodies. Front Pharmacol. 2014;5:87. doi:https://doi.org/10.3389/fphar.2014.00087.
- Lu X, Nobrega RP, Lynaugh H, Jain T, Barlow K, Boland T, Sivasubramanian A, Vasquez M, Xu Y. Deamidation and isomerization liability analysis of 131 clinical-stage antibodies. MAbs. 2019;11(1):45–57. doi:https://doi.org/10.1080/19420862.2018.1548233.
- Stephenson RC, Clarke S. Succinimide formation from aspartyl and asparaginpyelp tides as a model for the spontaneous degradation of proteins. J Biologiclhem. 1989;264(11):6411–70.
- Tanford C, Bunville LG, Nozaki Y. The Reversible Transformation of β-Lactoglobulin at pH 7.5. J Am Chem Soc. 1959;81(15):4032–36. doi:https://doi.org/10.1021/ja01524a054.
- Tanford C, Taggart VG. Ionization-linked changes in protein conformation. II. The N → R transition in β-lactoglobulin. J Am Chem Soc. 1961;83:1634–38.
- Tanford C. Ionization-linked changes in protein conformation. I. Theory. J Am Chem Soc. 1961;83(7):1628–34. doi:https://doi.org/10.1021/ja01468a021.
- Brownlow S, Morais Cabral JH, Cooper R, Flower DR, Yewdall SJ, Polikarpov I, North ACT, Sawyer L. Bovine β-lactoglobulin at 1.8 Å resolution - Still an enigmatic lipocalin. Structure. 1997;5(4):481–95. doi:https://doi.org/10.1016/S0969-2126(97)00205-0.
- Qin BY, Bewley MC, Creamer LK, Baker HM, Baker EN, Jameson GB. Structural basis of the tanford transition of bovine β-lactoglobulin. Biochemistry. 1998;37(40):14014–23. doi:https://doi.org/10.1021/bi981016t.
- Weichsel A, Andersen JF, Roberts SA, Montfort WR. Nitric oxide binding to nitrophorin 4 induces complete distal pocket burial. Nat Struct Biol. 2000;7(7):551–54. doi:https://doi.org/10.1038/76769.
- Roche S, Bressanelli S, Rey FA, Gaudin Y. Crystal structure of the low-pH form of the vesicular stomatitis virus glycoprotein G. Science. 2006;313(5784):187–91. doi:https://doi.org/10.1126/science.1127683.
- Stampfer SD, Lou H, Cohen GH, Eisenberg RJ, Heldwein EE. Structural basis of local, pH-dependent conformational changes in glycoprotein B from herpes simplex virus type 1. J Virol. 2010;84(24):12924–33. doi:https://doi.org/10.1128/JVI.01750-10.
- Zubkov S, Gronenborn AM, Byeon IJL, Mohanty S. Structural consequences of the pH-induced conformational switch in A. polyphemus pheromone-binding protein: mechanisms of ligand release. J Mol Biol. 2005;354:1081–90.
- Harms MJ, Castañeda CA, Schlessman JL, Sue GR, Isom DG, Cannon BR, García-Moreno E,B. The pKa values of acidic and basic residues buried at the same internal location in a protein are governed by different factors. J Mol Biol. 2009;389:34–47.
- Isom DG, Cannon BR, Castañeda CA, Robinson A, García-Moreno E,B. High tolerance for ionizable residues in the hydrophobic interior of proteins. Proc Natl Acad Sci U S A. 2008;105(46):17784–88. doi:https://doi.org/10.1073/pnas.0805113105.
- Isom DG, Castañed CA, Cannon BR, García-Moreno BE. Large shifts in pKa values of lysine residues buried inside a protein. Proc Natl Acad Sci U S A. 2011;108(13):5260–65. doi:https://doi.org/10.1073/pnas.1010750108.
- Isom DG, Castañeda CA, Cannon BR, Velu PD, García-Moreno E,B. Charges in the hydrophobic interior of proteins. Proc Natl Acad Sci U S A. 2010;107(37):16096–100. doi:https://doi.org/10.1073/pnas.1004213107.
- Jorgensen WL,CJ, Madura JD, Impey RW, Klein ML. Comparison of simple potential functions for simulating liquid water. J Chem Phys. 1983;79:926–35. doi:https://doi.org/10.1063/1.445869.
- Phillips JC, Braun R, Wang W, Gumbart J, Tajkhorshid E, Villa E, Chipot C, Skeel RD, Kale L, Schulten K. Scalable molecular dynamics with NAMD. J Comput Chem. 2005;26(16):1781–802. doi:https://doi.org/10.1002/jcc.20289.