
ABSTRACT
The functional interleukin 6 (IL-6) signaling complex is a hexameric structure composed of IL-6, IL-6Rα, and the signaling receptor gp130. There are three different modes of IL-6 signaling, classic signaling, trans-signaling, and trans-presentation, which are not functionally redundant and mediate pleiotropic effects on both physiological and pathophysiological states. Monoclonal antibodies against IL-6 or IL-6Rα have been successfully developed for clinical application. However, designing therapeutic interventions that block specific modes of IL-6 signaling in a pathologically relevant manner remains a great challenge. Here, we constructed a fusion protein Hyper-IL-6 (HyIL-6) composed of human IL-6 and IL-6Rα to develop specific blocking antibodies against the IL-6/IL-6Rα complex. We successfully screened the monoclonal antibody C14mab, which can bind to HyIL-6 with the binding constant 2.86 × 10⁻¹⁰ and significantly inhibit IL-6/IL-6Rα/gp130 complex formation. In vitro, C14mab effectively inhibited HyIL-6-stimulated signal transducer and activator of transcription 3 (STAT3) activation and related vascular endothelial growth factor (VEGF) induction. Moreover, C14mab efficaciously suppressed HyIL-6-induced acute phase response in vivo. Our data from hydrogen-deuterium exchange mass spectrometry demonstrate that C14mab mainly binds to site IIIa of IL-6 and blocks the final step in the interaction between gp130 and IL-6/IL-6Rα complex. Additionally, data from enzyme-linked immunosorbent assays and kinetics assays indicate that C14mab interacts simultaneously with IL-6 and IL-6Rα, while it does not interact with IL-6Rα alone. The unique features of C14mab may offer a novel alternative for IL-6 blockade and illuminate a better therapeutic intervention targeting IL-6.
Introduction
Interleukin-6 (IL-6), identified initially as B cell stimulatory factor 2, is a pivotal cytokine with a diverse repertoire of functions in normal physiology and disease.Citation1 IL-6 mediates several biological functions in a wide variety of physiological processes, including energy homeostasis, bone metabolism, acute phase response, regenerative processes, and neural function.Citation2,Citation3 As an essential member of the cytokine network, IL-6 plays a central role in acute inflammation and links innate to acquired immune response.Citation4 Excessive synthesis of IL-6 is critically involved in the cytokine release syndrome (CRS) elicited by immune-related therapy such as chimeric antigen receptor T-cell (CAR-T) therapy and in viral infections, including severe acute respiratory syndrome coronavirus 2 (SARS-CoV-2).Citation5,Citation6 CRS is a potentially life-threatening systemic inflammatory response, and IL-6 blockade has been shown to reverse CRS associated with novel T cell-engaging therapies and SARS-CoV-2.Citation7,Citation8 In addition, IL-6 plays a central role in the transition from neutrophil to monocyte recruitment during inflammation, and dysregulated IL-6 essentially contributes to perpetuating tissue damage in chronic inflammatory diseases and autoimmune diseases.Citation9 The therapeutic efficacy of IL-6 targeted therapy has substantiated the significant pathogenic role of IL-6 in rheumatoid arthritis, systemic juvenile idiopathic arthritis, polyarticular juvenile idiopathic arthritis, and giant cell arteritis.Citation10–12 Furthermore, excessive IL-6 production in the germinal center of hyperplastic lymph nodes drives the array of clinical manifestations in Castleman disease.Citation13 In 2014, siltuximab, an IL-6-targeted therapy, was approved for multicentric Castleman disease.Citation14 These studies, taken together, validate the IL-6 signaling pathway as an essential molecular therapeutic target.
IL-6 target cells express a low-affinity receptor (IL-6Rα) devoid of transducing activity on their surface.Citation15 The binding of IL-6 to IL-6Rα is followed by an association with a second membrane protein of the same cell, gp130, which dimerizes and initiates intracellular signaling.Citation16 The signal transduction within the cell involves activation of the Janus kinase (JAK) and activator of transcription (STAT) pathway and the RAS-dependent mitogen-activated protein kinase (MAPK) signaling cascade.Citation17 This so-called classic signaling is relevant only in a few cell types (hepatocytes, some epithelial cells, and leukocytes) that express IL-6Rα.Citation18 A key feature in regulating the many biological activities assigned to IL-6 has been identifying a soluble IL-6Rα (sIL-6Rα).Citation19 The sIL-6Rα forms an agonistic complex with IL-6 that binds ubiquitous transmembrane gp130 to trigger cellular responses (IL-6 trans-signaling).Citation20,Citation21 Notably, the pathogenic role of IL-6 trans-signaling has been increasingly implicated in several inflammatory diseases, autoimmune diseases, and inflammation-associated cancers.Citation22 Alternatively, IL-6/IL-6Rα has been discovered to present to neighboring cells, called IL-6 trans-presentation, which occurs in the context of the antigen-specific interaction of dendric cells (DCs) with T cells. Specifically, the IL-6-IL-6Rα complex is formed in intracellular compartments of DCs and then presents to the cell surface, which subsequently induces signaling from gp130 expressed on CD4+ cells to generate a highly tissue-destructive phenotype, T helper 17 cells.Citation23 These three modes of IL-6 signaling are not functionally redundant in mediating IL-6ʹs pleiotropic functions, suggesting that selective blockade of different modes of IL-6 signaling has different outcomes on disease pathology. Given the complex biology of IL-6, suppressing trans-signaling and trans-presentation while sparing the homeostatic functions of IL-6 classic signaling would be a crucial therapeutic strategy for IL-6 blockade.
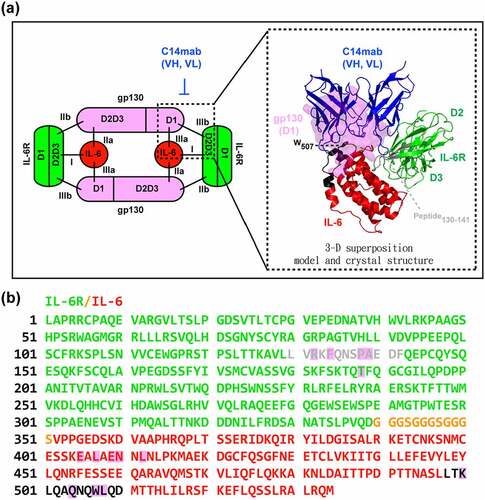
Crystallographic data analysis for IL-6 signaling assembly revealed that the complex ternary forms a hexamer containing two IL-6, two IL-6Rα, and two gp130, which assemble sequentially and cooperatively.Citation24,Citation25 IL-6 is a four-alpha-helix bundle cytokine.Citation26 IL-6 first interacts with the D3/D2 domain of IL-6Rα to form the initial IL-6/IL-6Rα binary complex through the site I binding epitope located in the A and D helices. The IL-6/IL-6Rα complex comprises a composite epitope (sites IIa and IIb) that interacts with the gp130 cytokine-binding-homology region (CHR). Site IIa is between the IL-6 A and C helical faces and the gp130 CHR. Site IIb is between the IL-6Rα D3 domain and the gp130 D3 domain, which provides additional surfaces to enhance the overall binding affinity. The subsequent assembly of the functional IL-6 hexamer signaling complex requires a third receptor-binding epitope, site III. Site IIIa possesses a broad interface between the tip of the IL-6 four-helix bundle and the D1 domain of gp130. In contrast, IIIb is between the tip of the gp130 D1 domain and the D2 domain of IL-6Rα.Citation24 Several inhibitors targeting the defined epitope regions of the IL-6 receptor complex display distinct modes of action.Citation27–29 For example, when inhibitory antibodies bind to either IL-6 site I (siltuximab; sirukumab; clazakizumab) or IL-6Rα D3/D2 (tocilizumab; sarilumab), it blocks the binding of IL-6 to IL-6Rα, resulting in blockade of both classic and trans-signaling of IL-6, but not IL-6 trans-presentation. In contrast, the anti-IL-6 antibody olokizumab binds to site IIIa of IL-6 and interferes with the fully functioning receptor complex by blocking the interaction with gp130. Furthermore, olamkicept (sgp130Fc) exclusively inhibits IL-6 trans-signaling by interference with the binding of site II and site III of the IL-6/IL-Rα complex with gp130. The action of these inhibitors yields differences in pharmacokinetics and efficacy under various disease states. More importantly, it remains largely unknown whether blockade of different functional epitopes within the IL-6/IL-6Rα/gp130 structure may translate into unique clinical benefits.
Here, we present the discovery and characterization of C14mab, a novel therapeutic antibody with a greater affinity to bind to the IL-6/IL-6Rα complex over IL-6 and thereby interfere with the fully functioning receptor complex by blocking interaction with gp130 (site III).
Results
Generation and characterization of anti-HyIL-6 hybridoma cells
Most antibodies under clinical use or development that target the IL-6 axis prevent IL-6 binding to IL-6Rα and thus neutralize IL-6 activity (the site I blockade). To discover novel antibodies that may target other functional epitopes within the IL-6/IL-6Rα/gp130 structure, we immunized mice with recombinant human Hyper-IL-6 (HyIL-6) protein composed by fusing human IL-6 and human sIL-6Rα with a 13-aa linker.Citation30–32 Subsequent antibody discovery led to the generation of 32 hybridoma clones that recognized HyIL-6 in an initial enzyme-linked immunosorbent assay (ELISA) screen. Next, supernatants of these 32 hybridoma clones were tested for their ability to block the binding of gp130 to the IL-6/IL-6Rα complex. Theoretically, this approach can screen antibody candidates that target distinct binding sites other than the site I. shows data generated using competitive ELISA identifying several potential antibody candidates that can significantly interfere with the binding of HyIL-6 with gp130. The top 10 ranking candidates were selected for further characterization of their binding affinity with HyIL-6 and IL-6 using an indirect ELISA assay. shows representative binding curves for the binding of various antibody candidates to HyIL-6 and IL-6, respectively. Our data revealed that most tested candidates have a superior affinity to HyIL-6, while the C40 clone showed similar binding characteristics to IL-6 and HyIL-6.
Figure 1. Representative results of hybridoma screening by competitive ELISA. The culture supernatants from hybridomas were mixed with HyIL-6 for analysis. The color formation is reported as an absorbance (OD450) observed for each hybridoma. The top 10 ranking antibodies were selected as antibody candidates based on their ability to neutralize the binding of HyIL-6 and sgp130-Fc. A bar graph showing the absorbance observed for each hybridoma.
Figure 2. The binding characteristics of antibodies to IL-6 and HyIL-6 from hybridoma culture supernatants. After the microplates were coated with IL-6 (20 ng/well) or HyIL-6 (60 ng/well) overnight, indirect ELISA was conducted with serial dilution of IgG-normalized hybridoma culture supernatants. The OD450 binding curves of hybridoma candidates C40, C14, C85, C92, C148, and C155 were shown in (a-f). Data are compiled from three independent experiments. Values represent the mean ± SEM. Fig. (a) to (f) Comparative line graphs plotting absorbance (OD450) observed of IL-6 versus HyIL-6 from C40, C14, C85, C92, C148 and C155 hybridoma candidates.
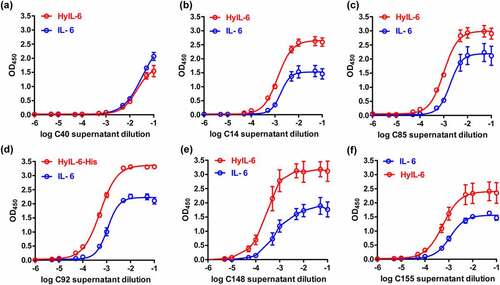
To further verify the inhibitory ability of these antibody candidates to IL-6/HyIL-6-induced signaling on target cells, tyrosine phosphorylation of STAT3 (p-STAT3) was analyzed using immunoblot in HeLa cells that express low levels of IL-6Rα subunit. shows that IL-6 stimulation led to a poor signaling response in HeLa cells, while HyIL-6 stimulation produced a robust STAT3 activation. As expected, both IL-6- and HyIL-6-mediated STAT3 phosphorylation levels were reduced in a dose-dependent manner in the presence of hybridoma supernatants containing antibody candidates. Notably, the C14 clone showed superior inhibitory activity against HyIL-6-mediated trans-signaling, among others (Figure S1). Similar results were obtained with HyIL-6-induced STAT3 activation in the IL-6Rα-null C33A cells (Figure S2). We, therefore, selected the C14 clone for further development and characterization.
Figure 3. The activity of antibody candidates against IL-6 and HyIL-6 in vitro. HeLa cells (1 x 10⁵ cells/well) were stimulated with the mixture containing recombinant human IL-6 (20 ng/ml) or HyIL-6 (60 ng/ml) at the same molar ratio, with or without serial dilution of the hybridoma culture supernatants. STAT3 activation (p-STAT3) was determined 15 mins after IL-6/HyIL-6 stimulation by Western blot. Western blot analysis of antibody candidates against IL-6 and HyIL-6 in vitro, with or without serial dilution of various hybridoma culture supernatants.
The binding affinity of monoclonal antibody C14
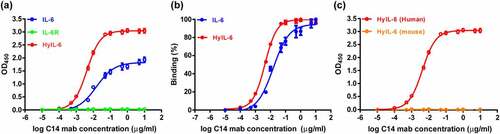
The purified C14 monoclonal antibody (C14mab) was first subjected to the binding experiment with IL-6, IL-6Rα, and HyIL-6 based on ELISA. The representative diagrams of the binding characteristics of C14mab shown in ()) reveal that C14mab binds to IL-6 and HyIL-6, but not IL-6Rα. Notably, HyIL-6 possessed stronger C14mab binding activity than IL-6 ()). ELISA analysis showed the EC50 value of C14mab to bind coated HyIL-6 (4.296 ng/ml) was ~3.5 times stronger than that of IL-6 (EC50 = 15.32 ng/ml), while the maximum OD value of HyIL-6 was also obviously higher than IL-6. Moreover, while C14mab demonstrated high-affinity binding to human HyIL-6, C14mab lacked affinity to mouse HyIL-6, indicating that C14mab does not exhibit cross-species reactivity ()).
Figure 4. The binding characteristics of purified C14mab. (a) The microplates were coated with human IL-6 (20 ng/well), HyIL-6 (60 ng/well), and IL-6 Rα (40 ng/well). Serial dilutions of C14mab were added for 1 hr at room temperature. The binding ELISA data is graphed with OD450 readings and their associated binding percentages vs. log antibody concentration. Data are compiled from three independent experiments. Values represent the mean ± SEM. (b) Data were normalized to maximum signal for IL-6 and HyIL-6 individually. EC50 values were obtained by nonlinear regression fitting to a variable slope, four-parameter dose-response model using the GraphPad Prism software (San Diego, CA, USA). (c) The binding of mouse HyIL-6 (60 ng/well) with C14mab was measured by ELISA as described in (a). Values represent the mean ± SEM from three independent experiments. Fig. (a) Comparative line graphs plotting absorbance (OD450) observed of IL-6 and HyIL-6 from log C14 mab concentrations. Fig. (b) Comparative line graphs plotting binding percentage of IL-6 and HyIL-6 from log C14 mab concentrations. Fig.(c) Comparative line graphs plotting absorbance (OD450) observed of HyIL-6 Human and HyIL-6 Mouse from log C14 mab concentrations.
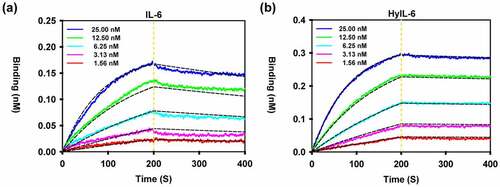
We next determined the binding kinetics of the purified C14mab to IL-6 and HyIL-6. The representative sensorgrams are shown in . The binding affinities were 1.13 × 10⁻⁹ and 2.86 × 10⁻¹⁰ for IL-6 and HyIL-6, respectively (). Indeed, the binding strength of C14mab of HyIL-6 was about four times that of IL-6. The binding characteristics of purified C14mab were consistent with the results from ELISAs. For IL-6, C14mab followed a fast-on (6.05 x 10⁵ M−1s−1) and slow-off (6.65 x 10⁻⁴ S−1) binding kinetics, resulting in a KD of 1.13 × 10⁻⁹ M. For HyIL-6, C14mab followed a fast-on (4.98 x 10⁵ M−1s−1) and slow-off (1.44 x 10⁻⁴ S−1) binding kinetics, resulting in a KD of 2.86 × 10⁻¹⁰ M. The high on-rate of binding was similar, which means that very little energy was required for IL-6 and HyIL-6 to form the complex with C14mab. On the other hand, the off-rate of binding for HyIL-6 was lower than IL-6, meaning the dissociation of C14mab and HyIL-6 was slower, indicating the complex was more stable.
Table 1. Kinetic rate constants and equilibrium dissociation constants for the binding interaction of IL-6 and HyIL-6 with C14mab
Figure 5. Binding kinetics of C14mab. Biolayer interferometry analysis of the binding of C14mab to IL-6 (a) and HyIL-6 (b) was carried out. In brief, C14mab was loaded onto an Octet anti-mouse Fc-capture (AMC) sensor and incubated over a range of concentrations (1.56–25 nM) of IL-6 and HyIL-6, respectively. Kinetic parameters were evaluated by using a 1:1 binding model with global fitting. The experimental curves of each concentration (solid line) are shown alongside the fitted curves (dashed line). One representative set of curves is shown from three independent experiments. Comparative line graphs plotting binding of C14mab (incubated over a range of concentrations 1.56–25 nM) to IL-6 (Fig. a) and HyIL-6 (Fig. b) over time.
Neutralization activity of C14mab
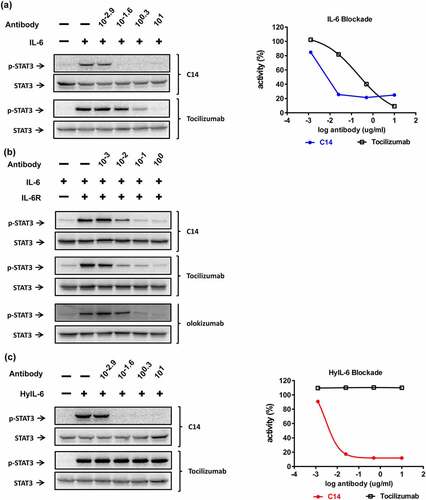
To validate the neutralization activity of C14mab, we compared the inhibitory characteristics of C14mab to tocilizumab on IL-6-mediated p-STAT3 by immunoblot. ) demonstrated that C14mab and tocilizumab dose-dependently inhibit IL-6-induced p-STAT3 in HeLa cells, and C14mab shows a superior potency over tocilizumab. The combination of IL-6 and sIL-6Rα significantly induced p-STAT3 in the IL-6Rα-null C33A cells, whereas IL-6 alone treatment did not. ) demonstrated that C14mab, tocilizumab, and olokizumab substantially inhibit IL-6/sIL-6Rα combination-mediated p-STAT3 induction in C33A cells. Like site 1 inhibitor, tocilizumab is an anti-IL-6Rα antibody that inhibits the binding of free IL-6 to IL-6Rα. Tocilizumab, however, cannot prevent STAT3 activation initiated by the preexisting IL-6/IL-6Rα complex (HyIL-6) ()). In contrast, C14mab inhibits HyIL-6 induced STAT3 activation in a dose-dependent manner, supporting its ability in preventing IL-6/IL-6Rα complex from binding to gpl30 and initiating signaling ().
Figure 6. The inhibitory profile of C14mab in various IL-6-mediated signalings. (a) HeLa cells (1 x 10⁵ cells/well) were serum-starved for 5 hrs before stimulation. IL-6 (30 ng/ml) was premixed with indicated concentrations of C14mab or Tocilizumab for 15 mins. Cells were treated with the mixtures for 15 mins and p-STAT3 was determined by Western blot (left panel). The inhibition data is analyzed by ImageJ software and graphed with p-STAT3 activity percentages vs. log antibody (right panel). (b) C33A cells (1 x 10⁶ cells/well) were serum-starved for 5 hrs before stimulation. IL-6 (100 ng/ml) and sIL-6 Rα (200 ng/ml) were mixed for 15 mins, then the IL-6/sIL-6 R combination was incubated with indicated concentrations of C14mab, tocilizumab, or olokizumab for another 15 mins. Cells were treated with the mixtures for 15 mins and p-STAT3 was determined by Western blot. (c) For HyIL-6 mediated signaling blockade, HeLa cells (1 x 10⁵ cells/well) were stimulated with HyIL-6 (10 ng/ml) and indicated antibodies. The levels of p-STAT3 were determined by Western blot (left panel) and analyzed by Image J software (right panel) as described in (a). Fig (a) Left: Western blot analysis of IL-6 with various C14mab and Tocilizumab concentrations. Fig (a) Right: Line graphs plotting p-STAT3 activity percentages over log antibody (C14mab vs. Tocilizumab). Fig. (b) Western blot analysis of IL-6 and IL-6 R with various C14mab, Tocilizumab, and Olokizumab concentrations. Fig. (c) Left: Western blot analysis of HyIL-6 with various C14mab and Tocilizumab concentrations. Fig (c) Right: Line graphs plotting p-STAT3 activity percentages over log antibody (C14mab vs. Tocilizumab).
IL-6/HyIL-6 signaling links inflammation with angiogenesis.Citation33,Citation34 Induction of VEGF is one of the significant STAT3 signaling downstream events. We, therefore, evaluated the effect of C14mab on HyIL-6-induced VEGF expression by ELISA. ) reveals that HyIL-6 substantially induced VEGF production in C33A cells, which can be dose-dependently reduced by C14mab, with complete blockade when applying >0.1 µg/ml C14mab in C33A cells. Furthermore, IL-6 plays an obligatory role in generating IL-17A–secreting CD4+ T cells (Th17 cells) through trans-signaling.Citation35 ) demonstrates that HyIL-6 supports the transforming growth factor (TGF)-β–mediated differentiation of Th17 cells. In contrast to tocilizumab, C14mab and olokizumab remarkably inhibited IL-17 levels in culture supernatants in a dose-dependent manner ()).
Figure 7. Neutralization activity of C14mab. (a) C14mab inhibits HyIL-6 induced VEGF expression in C33A. VEGF protein expression was evaluated by ELISA in the culture supernatant of C33A cells after incubation under treatment with HyIL-6 (50 ng/ml) in the presence or absence of the indicated concentrations of C14mab. The culture media were collected for the determination of VEGF levels. Data expressed as mean ± SD, n = 4. * Statistically significant difference from the positive control; P < .05. ** Statistically significant difference from the positive control; P < .01 (b) Wildtype naïve CD4+ T cells were stimulated with anti-CD3 and anti-CD28 for four days in the presence of TGF-β1 (2 ng/ml) and anti-IL-2 (10 ug/ml). HyIL-6 (50 ng/ml) mediated signaling was blocked in cultures using indicated concentrations of C14mab, tocilizumab, and olokizumab. IL-17A levels in culture supernatants were determined by ELISA (R&D Systems). Values represent the mean ± SD: n = 3. ** Statistically significant differences from the positive control; P < .01. (c) BALB/c mice were injected with either C14mab (0.1 mg/ml), DPBS, or isotype control antibody (0.1 mg/kg). After 1 hr, mice were challenged with recombinant human HyIL-6 (1 ug). After an additional 6 hrs, whole blood was collected. SAA levels were determined from serum by using the mouse SAA ELISA. (d) C14mab dose-dependently decreases HyIL-6 induced SAA levels in mice. BALB/c mice were injected with the indicated dose of C14mab. After 1 hr, mice were challenged with recombinant human HyIL-6 (1 ug). After an additional 6 hrs, whole blood was collected. SAA levels were determined from serum by using the mouse SAA ELISA. Data expressed as mean ± SD, n = 5. ** Statistically significant differences from the positive control; P < .01. Fig (a) Histogram of HyIL-6 induced VEGF expression with various indicated concentration of C14mab. Highest VEGF expression noted with 10(−3) concentration of C14mab. Fig (b) Three histograms of IL-17A levels with HyIL-6 mediated signaling blockage in indicated concentrations of C14mab, Tocilizumab, and Olokizumab. Fig. (c) Histogram of IL-6 induced SAA levels in mice with indicated injected concentrations of C14mab and isotype control antibody. Fig (d) Histogram of IL-6 induced SAA levels in mice with indicated injected concentration of C14mab.
IL-6 is the primary inducer of hepatic acute-phase proteins.Citation36 To explore the efficacy of C14mab to abrogate IL-6 response in vivo, we examined serum levels of amyloid A (SAA), the primary acute phase protein and inflammation marker in mice. Upon intraperitoneal HyIL-6 injection, SAA levels substantially elevated 3 hours (hrs) after stimulation in BALB/c mice. The C14mab significantly suppressed HyIL-6-elicited SAA production compared with the isotype control antibody ()). ) demonstrates that C14mab abrogates HyIL-6-produced SAA production in a dose-dependent manner in mice. At the dose above 0.1 mg/kg, our data showed that C14mab significantly suppresses SAA expression in mice. Our in vitro and in vivo assays collectively demonstrated the profound efficacy of C14mab in neutralizing the IL-6 pathway.
Epitope characterization of C14mab
To obtain molecular details of the C14mab binding epitope, hydrogen/deuterium exchange mass spectrometry (HDX-MS) was applied to map the antibody’s epitope by comparing the HDX for HyIL-6 with that for the C14mab/HyIL-6 complex. After the exchange reaction, the proteins were digested by pepsin, and the resulting peptides were analyzed by liquid chromatography (LC)-MS. Our assay generated 30 HyIL-6 peptides covering 80.7% of the HyIL-6 sequence, which constitutes up to 89.2% of the functional epitopes of HyIL-6 involved in IL-6 hexamer formation. The differential HDX results of the HyIL-6 and C14mab/HyIL-6 complex are exhibited in . A reduction in the amount of deuterium exchange indicates protection of that region by a binding event. Several peptides, in regions 103–111, 130–141, 148–158, 159–168, 207–217, 235–249, 250–273, 274–284, 306–314, 315–325, and 390–399, demonstrated modest HDX reduction upon C14mab binding with a total < 1 Da reduction, which were considered nonsignificant. Our HDX data revealed one essential region (composed of residues 498–510) as the potential binding epitope (), which showed >70% deuterium exchange upon C14mab binding. These residues are located at gp130 interaction site IIIa in IL-6, including the critical residue Trp157 of IL-6 in the site IIIa interface.Citation24
Figure 8. The epitope of HyIL-6/C14mab interaction. (a) Differential HDX of HyIL-6 upon C14mab binding. A superimposed scatter plot shows pink, purple, green, Orange, blue, and red dots corresponding to data acquired at 30, 180, 600, 1800, and 5400 sec of deuteration. The sequence, 498LTKLQAQNQWLQD510, upon C14mab binding shows significant HDX reduction compared to other sequences. (b) A scheme depicts the assay procedure (left panel). The microplates were coated with sIL-6 Rα (50 ng/well) in PBS buffer at 4°C overnight and blocked with 1% BSA in PBS for 1 hr. Then plates were washed with PBS containing 0.05% Tween-20. Upper; without washing group, IL-6 (10 ng/well) was added for 1 hr at room temperature. Then serial dilution concentrations of C14mab were added directly for another 2 hrs. Lower; washing group, IL-6 (10 ng/well) was added for 1 hr at room temperature. After plates were washed with PBS containing 0.05% Tween-20, serial dilution concentrations of C14mab were added directly for another 1 hr. The bound C14mab was determined by ELISA. The binding results with or without washing before C14mab incubation are shown in blue and red, respectively (right panel). One representative assay of 3 is shown. Figure (8a) Scatter plot of relative uptake difference of HyIL-6 with C14 mab binding with various corresponding sec of deuteration (30,180, 600, 1800, and 5400 sec). Fig. (8b) Left: Assay procedures showing IL-6 added to IL-6 R coated plate with (lower diagram) and without PBS wash (upper diagram), then serial dilution concentration of C14mab were added to result in detected levels. Figure (8b) Right: Comparative line graphs plotting binding absorbance (OD450) with and without PBS wash with indicated log C14mab concentrations.
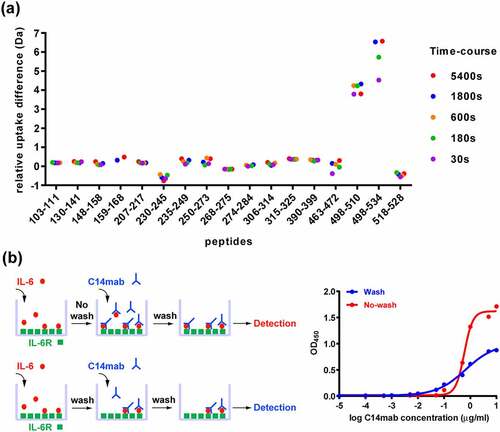
Based on the kinetic analysis, C14mab exhibits stronger binding to HyIL-6 (KD = 0.286 nM) than IL-6 (KD = 1.13 nM), suggesting the interface between C14mab and HyIL-6 may span from IL-6 over to IL-6Rα. However, our HDX-MS measurements did not identify any potential binding epitopes in IL-6Rα, probably owing to the limited deuterium exchange levels under the experimental conditions. To further understand the C14mab binding mechanism in HyIL-6, we performed an indirect ELISA assay using C14mab as a detection antibody. Briefly, IL-6Rα was immobilized directly on the plate, and then IL-6 was added to the IL-6Rα and allowed to bind. The unbound IL-6 was washed away, and the IL-6/IL-6Rα complex was detected by C14mab (, blue line). Notably, when C14mab was added without washing off unbound IL-6, the ELISA readout significantly increased (, red line), indicating C14mab changes the equilibrium state of the IL-6/IL-6Rα interaction. Overall, our data revealed C14mab recognizes and stabilizes the complex formed by IL-6 and IL-6Rα, instead of recognizing IL-6 alone.
Discussion
Using the designer cytokine HyIL-6 as an antigen for immunization, we successfully screened an inhibitory antibody C14mab that possesses a distinct binding mode recognizing the fusion protein of sIL-6Rα/IL-6 and prevents the formation of the signaling-competent receptor complex with gp130. Both in vitro and in vivo functional assays show that C14mab potently inhibits IL-6-mediated signal transduction and biological activities. Data from ELISA binding assays and kinetics assays indicate that C14mab interacts simultaneously with IL-6 and IL-6Rα, suggesting the C14mab binding surface spans across the interface of IL-6 and IL-6Rα, either continuously or not. While C14mab binds to IL-6 alone, it does not have a measurable affinity for IL-6Rα alone. Notably, C14mab preferentially binds to the fusion protein of sIL-6Rα/IL-6 over IL-6 and increases the concentration at the equilibrium of the IL-6/IL-6Rα complex while interfering with the recruitment of the signaling partner gp130. This characteristic of C14mab makes it a unique neutralizing antibody for IL-6, offering a different way of designing specific therapeutics for IL-6 blockade.
Our biophysical and structural analysis indicates that epitopes of the sIL-6Rα/IL-6 recognized by C14mab mainly lie within the IL-6 molecule. Data from HDX-MS revealed that C14mab targets site IIIa of IL-6, encompassing the amino acid residue W157, the critical aromatic site III signature residue involved in the final step in assembling the functional human IL-6 hexamer signaling complex.Citation37,Citation38 This study, however, could not determine epitopes covering IL-6Rα because the signal-to-noise ratio in the HDX-MS of the IL-6Rα molecule was not clear enough to determine the binding residues. Nevertheless, we further analyzed the differential HDX-MS and the spatial distribution between pepsin-digested peptides and the amino acid residue W507. Those peptides with properties of HyIL-6 deuterium level > 25%, difference upon C14mab binding > 9%, and the distance from peptide to W507 < 30 Å were considered potential candidates for antibody-binding epitopes. Only one, peptide130-141, meets the abovementioned criteria (Table S1.) Accordingly, we propose a complex model that consists of a homology model of the C14mab variable region, which spans a distance of about 30 Å and simultaneously engages IL-6 and IL-6Rα using its complementarity-determining regions, superimposed onto the IL-6/IL-6Rα/gp130 structure ()). The C14mab binding residues in the two distinct regions of the IL-6/IL-6Rα complex, peptide498-510 and peptide130-141 are within the approximate size of the variable domains of the heavy and light chains of C14mab ()). These residues are located at the gp130 interaction site IIIa in IL-6 and site IIIb in IL-6Rα, respectively. Moreover, C14mab and the gp130 D1 domain overlap significantly in space, indicating C14mab blocks the formation of IL-6/IL-6Rα/gp130 complex and subsequent signal transduction.
Figure 9. The proposed model of IL-6/IL-6 R/C14mab (a) The three key interaction sites of IL-6 (red), IL-6 R (green), and gp130 (pink) within the hexameric signaling complex are shown. The proposed model of IL-6/IL-6 R/C14mab and the trimeric structure of IL-6/IL-6 R/gp130 are superimposed. IL-6, IL-6 R, gp130, and C14mab are represented by a cartoon, shown in red, green, purple, and blue, respectively. The binding candidates, peptides 498–510 and peptides 130–141are demonstrated in black and gray, respectively. The surface representation of gp130 domain I overlap with C14mab interacting on IL-6 and IL-6 R in space. (b) HDX-MS was applied to map the epitope of the C14mab onto HyIL-6 by comparing the H/D exchange for HyIL-6 with that for the HyIL-6-C14mab complex. IL-6 R, linker, and IL-6 are colored green, Orange, and red, respectively. Candidate residues that are significantly reduced in the presence of C14mab are shown in black, while candidate residues with low reduction levels are shown in gray. The sequences with a pink background are the peptide sequences involved in the binding of IL-6 to gp130 (site III). (Fig. 9a) 2-D and 3-D models of IL-6/IL-6 R/C14mab with three key interaction sites of IL-6, IL-6 R, and gp130 with superimposed trimeric structure of IL-6/IL-6 R/gp130 and associated binding peptides, 498–510 and 130–141 (shown in black and gray). (Figure 9b) Epitope mapping of C14mab onto HyIL-6 with IL-6 R(green), linker(Orange) and IL-6(red). Candidate residue reduced with C14mab presence is shown in black while residue with low reduction level was shown in gray.
Sequential assembly of the IL-6/IL-6Rα/gp130 hexameric complex offers several alternatives for therapeutic intervention. Inhibitors that target different steps in the IL-6 signaling cascade have been developed. However, the question remains as to which of these modes of the blockade is superior and whether this difference can translate into clinical benefit. Tocilizumab, the first biologic targeting the IL-6 pathway to be approved by the Food and Drug Administration, recognizes both mIL-6Rα and sIL-6Rα and inhibits IL-6 signaling through competitive blockade of IL-6 binding.Citation39 In comparison with anti-IL-6 antibodies, treatment of patients with anti-IL-6Rα antibodies prevents serum IL-6 accumulation and related adverse responses, such as fever, fatigue, and hypercalcemia.Citation28 Nevertheless, targeting a receptor like IL-6Rα instead of the individual cytokine IL-6 already reduces the specificity. It has been shown that human IL-6Rα binds not only to IL-6, but also to human ciliary neurotrophic factorCitation40 and IL-30,Citation41 indicating that the blockade of IL-6Rα might also affect other signaling pathways. Likewise, experiments using olamkicept have shown that blocking IL-6 trans-signaling with sgp130Fc interferes with signaling elicited by the IL-11 trans-signaling pathway.Citation42 C14mab’s blockade of the IL-6/IL-6Rα complex, but not IL-6Rα alone, enables the targeting of a single signaling entity and allows uninterrupted signaling of other cytokines in the IL-6 family.
Blockade of IL-6 offers the most direct mode of IL-6 inhibition without interfering with other cytokines that can signal through IL-6Rα. IL-6 has three distinct binding sites to bind to its receptor subunits. Most anti-IL-6 antibodies under clinical use/development, such as siltuximab, sirukumab, and clazakizumab, are directed against site I to interfere with the initial binding of IL-6 to its membrane-bound IL-6Rα or soluble IL-6Rα. Apparently, the site I blockade cannot discriminate between classic and trans-signaling. Moreover, the site I blockade does not block IL-6 trans-presentation, which is required for priming pathogenic TH 17 cells.Citation23 Of note, olamkicept efficiently inhibits trans-signaling, but not trans-presentation owing to steric hindrance.Citation23,Citation43 On the other hand, an anti-IL-6Rα MR16-1, which might interfere with the assembly of the IL-6/IL-6Rα/gp130 complex, suppresses IL-6 trans-presentation.Citation23,Citation44 In this context, non-site I blockade, like C14mab, theoretically suppresses classic and trans-signaling as well as trans-presentation, suggesting its potential therapeutic gap. Moreover, C14mab possesses a binding preference for IL-6/IL-6Rα complex compared to IL-6, and whether such a characteristic may relatively selectively blockade IL-6 activity instead of eliciting global IL-6 inhibition remains largely unknown. Further studies are needed to prove these concepts.
Targeting IL-6 signaling for treating many human diseases has entered clinical practice.Citation27,Citation45,Citation46 However, many questions remain, and the features of IL-6 inhibitory antibodies vary considerably based on their mode of blockade. Choosing the suitable antibody with the appropriate mechanism of action against IL-6/IL-6Rα/gp130 signaling for various IL-6 mediated diseases remains a challenge. Our work shows that C14mab explicitly recognizes the epitope containing a critical amino acid residue in site III of IL-6 for the IL-6/IL-6Rα/gp130 complex assembly, similar to olokizumab,Citation47 which is approved in Russia for treatment of rheumatoid arthritis. The critical difference between C14mab and olokizumab is that the epitope of C14mab for IL-6/IL-6Rα complex is split spatially across IL-6 and IL-6Rα, thus preferentially binding to IL-6/IL-6Rα complex. This unique feature may increase specificity and potential efficacy against various IL-6/IL-6Rα mediated diseases. These characteristics of C14mab shed light on its further development as a better IL-6 blockade strategy.
Materials and Methods
Recombinant protein
To construct and express the bioactive designer cytokine HyIL-6, a cassette consisting of human slL-6Rα cDNA (corresponding to amino acid residues 113–323) and human IL-6 cDNA (corresponding to amino acid residues 30–212) fused by a synthetic DNA linker coding for the amino acid sequence Arg-Gly-Gly-Gly-Gly-Ser-Gly-Gly-Gly-Gly-Ser-Val-Glu was constructed by the PCR technique and cloned into the mammalian expression vector IgMu/pEF-BOS using the restriction enzymes NdeI and BamHI. Cleavage of the signal peptide in transfected mammalian cells leads to the secretion of HyIL-6 with a C-terminal 6 His-tag. The purified protein was used as the immunogen for monoclonal antibody development. In addition, IL-6 (R&D systems, #7270-IL/CF), IL-6Rα (R&D systems, #227-SR/CF), human IL-6Rα/IL-6 chimera (R&D systems, #8954-SR/CF), and mouse IL-6/IL-6Rα complex (R&D systems, #9038-SR/CF) were used for ELISA, cell function, in vivo model, and kinetics assays.
Generation of hybridoma cell lines and antibody discovery
HyIL-6 protein was used for BALB/c mice injection. HyIL-6 protein was emulsified with Freund’s Complete Adjuvant for antigen priming. For the following injections, HyIL-6 protein was mixed with Incomplete Freund’s Adjuvant. Mice were injected every week and followed by a bleeding procedure for antibody titration. Indirect ELISA was used to test antibody titer after 3 ~ 4th boost injection. Mice with antibody titer larger than 1:10,000 were further used for hybridoma generation. Hybridoma preparation followed previous studies.Citation48 After three rounds of limiting dilution, culture supernatants from hybridoma candidates were screened using indirect ELISA. Subsequently, selected candidates underwent expansion for large-scale antibody production and cryopreservation. IgG-containing culture supernatant and control samples were subjected to sodium dodecyl sulfate-polyacrylamide gel electrophoresis (SDS-PAGE), and, based on the results, the IgG concentration of the supernatant was estimated and adjusted for normalization.
Competition screening assays
ELISA plates were coated with 100 ul of 10 ug/ml solution of purified sgp130-Fc (a gift from Stefan Rose-John, University of Kiel, Germany) in Dulbecco’s phosphate-buffered saline (DPBS) buffer. A mixture of 50 µl of the ligand (HyIL-6, 100 ng/ml) and 50 µl of supernatant from selected hybridomas were prepared in advance. 100 µL/well mixture was added and incubated for 1 hr at room temperature. Afterward, primary anti-sIL-6Rα mouse monoclonal antibody (R&D systems, #DY227) and horseradish peroxidase (HRP)-coupled horse anti-mouse IgG secondary antibody (Cell Signaling Technology, #7076) was incubated sequentially. Tetramethyl benzidine (TMB) solution (0.12 mg/mL TMB with 0.04% hydrogen peroxide in 25 mM NaH2PO4) was used as substrate. The reaction was stopped after 5 min with 1 M H2SO4. Optical density (OD) was measured at 450 nm with a reference of 630 nm.
ELISA binding assays
ELISA plates were coated with 100 ul of target proteins prepared in PBS buffer at 4°C overnight and blocked with 1% bovine serum albumin (BSA) in PBS for 1 hr. After washing with PBS containing 0.05% Tween-20, serial dilution concentrations of analyte (culture supernatants, antibodies) were added for 1 hr at room temperature. After further washing, bound antibodies were revealed using goat anti-mouse IgG coupled to HRP. TMB substrates (100 ul) were added for 10–20 mins, and then 50 ul stop solution (1 N H2SO4) was added. Absorbance at 450 nm was then determined.
Antibody expression and purification
Hybridomas were cultured in a culture medium (high glucose Dulbecco’s Modified Eagle Medium (DMEM), 10% fetal bovine serum (FBS), 1% penicillin-streptomycin) at 37°C under a 5% CO2-enriched atmosphere. After the cultures reached about 80% confluence in 10-cm culture dishes, the 10% FBS medium was replaced by a serum-free medium (high glucose DMEM) to produce mAbs. IgG was purified from the culture supernatants using columns containing protein-A resins (GenScript, #L00210). Immunoglobulins were eluted in 100 mM glycine. For neutralization, 1 M Tris buffer (pH 9.0) was added to purified immunoglobulin fractions. The purified C14mab is characterized using SDS-PAGE, size-exclusion LC, and thermal melting analysis (Figure S3). The antibody concentration was determined using a Bradford assay.
Cell signaling transduction assay
HeLa, C33A Cells (1 × 10⁵ cells/well, 1 × 10⁶ cells/well) were seeded in 6-well tissue culture dishes and cultured overnight. After serum starvation for 5 hrs, cells were stimulated with a pre-mixture containing IL-6 (R&D systems), IL-6/sIL-6Rα combination (R&D Systems), or HyIL-6 (R&D systems) with or without antibodies for 15 mins. The incubation time was 15 mins for each mixture period. Cells were washed with ice-cold PBS twice and lysed in RIPA buffer supplemented with protease and phosphatase inhibitor. Western blot analysis was performed using anti-pSTAT3 (Cell Signaling Technology, #9145) and anti-STAT3 antibodies (Cell Signaling Technology, #9137). After incubation with HRP-labeled goat anti-rabbit (Cell Signaling Technology, #7074) or HRP-labeled horse anti-mouse antibody (Cell Signaling Technology, #7076), the membranes were detected by enhanced chemiluminescence HRP substrate (Merck).
Kinetics assays
Octet is based on bio-layer interferometry (BLI) for measuring protein-protein interactions. BLI analyzes the interference pattern of white light reflected from two surfaces: a layer of immobilized protein on the biosensor tip and an internal reference layer. The binding between C14mab immobilized on the biosensor tip surface using Biosensor AMC tips (ForteBio, Pall Corporation) and IL-6 (R&D systems) and HyIL-6 (R&D systems) in the complex was measured. Interference patterns for binding or dissociating from the biosensor were measured in real-time to generate a response profile on the Octet® System Octet 96 Red (ForteBio, Pall Corporation). Kinetic parameters were evaluated using a 1:1 binding model with the global fitting of three independent experiments with the Octet Red analysis software.
Cultured cell VEGF assay
Serum-starved C33A cells were cultured in 6-well plates (1x10⁵ cells/ well) for 15 hrs in unsupplemented MEM before stimulation. C33A cells were treated with recombinant human HyIL-6 (50 ng/ml, R&D Systems) in the presence or absence of antibodies for 24 hrs. The culture media were collected for the determination of VEGF levels. VEGF concentrations in the supernatant were measured by human VEGF DuoSet ELISA (R&D systems), and each measurement was repeated in triplicate.
Use of laboratory animals
The mouse studies were performed using protocols approved by the Institutional Animal Care and Use Committee of the College of Medicine, National Taiwan University (Taipei, Taiwan).
In vitro expansion of murine TH17 cells
Mouse naïve CD4+ T cells were isolated from the 6- to 8-week-old C57BL/6 mice using EasySepTM mouse CD4+ T cell isolation kit (Stemcell). Cells were cultured in RPMI 1640 supplemented with 10% (v/v) fetal calf serum, 2 mM L-glutamine, 100 U/ml penicillin, 100 ug/ml streptomycin, 1 mM sodium pyruvate, and 50 μM β-mercaptoethanol (all from Invitrogen, Carlsbad, CA). A total of 2.5 × 10⁵ cells/well were cultured in 96-well plates coated with anti-CD3 (2 μg/ml, R&D Systems, #MAB4841-100) and anti-CD28 (10 μg/ml, BD Biosciences, San Jose, CA, #553294). Cultures were supplemented with TGF-β1 (2 ng/ml, R&D Systems, #7666-MB-005/CF), anti-IL-2 (10 μg/ml, R&D Systems, #MAB702-100) and HyIL-6 (50 ng/ml, R&D Systems). Antibodies were included as indicated.
In vivo neutralization of HyIL-6 induced SAA in mice
Male BALB/c mice (Harlan Laboratories), weighing 23–27 g, were housed for one week before testing. Mice received an intraperitoneal administration of 0.01, 0.03, 0.1 mg/kg of C14mab, DPBS, or 0.1 mg/kg isotype control antibody (Biolegend, #401408) 1 hr before an intraperitoneal administration of 1 ug/mouse of human HyIL-6 (R&D Systems). Blood was collected into Eppendorf tubes to prepare plasma and evaluate SAA levels by mouse serum amyloid A DuoSet ELISA (R&D Systems).
HDX-MS
The hydrogen-deuterium exchange in target recombinant protein was measured by pepsin-digested fragments using HDX-MS in the presence and absence of the mouse monoclonal antibody. The recombinant protein (60 pmol) and protein-antibody complex (60 pmol: 72 pmol) were diluted in the exchange buffer (99.9% D2O in PBS, pH 7.4) at a ratio of 1:9 to initiate HD exchange at room temperature. At six time points (0s, 30s, 180s, 600s, 1800s, 5400s), an aliquot (10 pmol of target protein) was aspired and mixed with prechilled quenching buffer (to a final concentration of 1.7 M guanidine hydrochloride, 250 mM tris(2-carboxyethyl) phosphine, and 0.8% formic acid). The mixture was immediately loaded onto a homemade pepsin column for online digestion. The digested peptide mixtures were then loaded onto a reverse-phase column (Zorbax 300SB-C18, 0.3 × 5 mm; Agilent Technologies, Wilmington, DE, USA). The desalted peptides were then separated on a reverse-phase column (nanoEase M/Z Peptide BEH C18 300 Å, 1.7 µm, 100 µm I.D. x 50 mm) using a multi-step linear gradient of 8%–95% HPLC buffer (99.5% acetonitrile/0.5% formic acid) for 10 minutes with a flow rate of 0.4 µl/min. The LC apparatus was coupled with a 2D linear ion trap mass spectrometer (Orbitrap Classic; Thermo Fisher, San Jose, CA, USA) operated using Xcalibur 2.2 software (Thermo Fisher, San Jose, CA, USA). The full-scan MS was performed in the Orbitrap over a range of 400 to 1,600 Da and a resolution of 30,000 at m/z 400. Internal calibration was performed using the ion signal of [Si(CH3)2O]6H+ at m/z 445.1200 as lock mass. The electrospray voltage was set to 2.4 kV, and the capillary temperature was set to 220°C. MS and MS/MS automatic gain control was set to 1,000 ms (full scan) and 200 ms (MS/MS), or 2 × 10⁶ ions (full scan) and 5 × 10³ ions (MS/MS) for maximum accumulated time or ions, respectively.
Peptide identification and HDX data analysis
The peptide identification was carried out using Proteome Discoverer software (version 2.3, Thermo Fisher Scientific). The MS/MS spectra were searched against the single protein database using the SEQUEST search engine. For peptide identification, 10 ppm mass tolerance was permitted for intact peptide masses and 0.5 Da for collision-induced dissociation fragment ions. Peptide-spectrum matches were filtered based on high confidence and search engine rank 1 of peptide identification to ensure an overall false discovery rate below 0.01. For HDX profile analysis, the peptide identification template was made based on the LC-MS/MS result of target protein identification. The template was then preloaded in the ExMS module installed in the MATLAB environment. The HDX-MS spectra were loaded and analyzed to calculate the number of incorporated deuterium atoms for each peptide, then presented as the average number of deuterium incorporation in three independent experiments.
Abbreviations
Supplemental Material
Download Zip (870.3 KB)Acknowledgments
We thank the Biophysics Core Facility, Scientific Instrument Center, Academia Sinica for using their Octet Red system. We also acknowledge hydrogen-deuterium exchange mass spectrometry data acquisition at Leadgene Biomedical, Inc.
Disclosure statement
No potential conflict of interest was reported by the author(s).
Supplementary material
Supplemental data for this article can be accessed on the publisher’s website
Additional information
Funding
References
- Hunter CA, Jones SA. IL-6 as a keystone cytokine in health and disease. Nat Immunol. 2015;16:448–13. doi:10.1038/ni.3153.
- Schett G. Physiological effects of modulating the interleukin-6 axis. Rheumatology (Oxford). 2018;57:ii43–ii50. doi:10.1093/rheumatology/kex513.
- Mihara M, Hashizume M, Yoshida H, Suzuki M, Shiina M. IL-6/IL-6 receptor system and its role in physiological and pathological conditions. Clin Sci (Lond). 2012;122:143–59. doi:10.1042/CS20110340.
- Jones SA. Directing transition from innate to acquired immunity: defining a role for IL-6. J Immunol. 2005;175:3463–68. doi:10.4049/jimmunol.175.6.3463.
- Chen G, Wu D, Guo W, Cao Y, Huang D, Wang H, Wang T, Zhang X, Chen H, Yu H, et al. Clinical and immunological features of severe and moderate coronavirus disease 2019. J Clin Invest. 2020;130:2620–29. doi:10.1172/JCI137244.
- Shimabukuro-Vornhagen A, Godel P, Subklewe M, Stemmler HJ, Schlosser HA, Schlaak M, Kochanek M, Böll B, Von Bergwelt-baildon MS. Cytokine release syndrome. J Immunother Cancer. 2018;6:56. doi:10.1186/s40425-018-0343-9.
- Guaraldi G, Meschiari M, Cozzi-Lepri A, Milic J, Tonelli R, Menozzi M, Franceschini E, Cuomo G, Orlando G, Borghi V, et al. Tocilizumab in patients with severe COVID-19: a retrospective cohort study. Lancet Rheumatol. 2020;2:e474–e84. doi:10.1016/S2665-9913(20)30173-9.
- Grupp SA, Kalos M, Barrett D, Aplenc R, Porter DL, Rheingold SR, Teachey DT, Chew A, Hauck B, Wright JF, et al. Chimeric antigen receptor-modified T cells for acute lymphoid leukemia. N Engl J Med. 2013;368:1509–18. doi:10.1056/NEJMoa1215134.
- Kaplanski G, Marin V, Montero-Julian F, Mantovani A, Farnarier C. IL-6: a regulator of the transition from neutrophil to monocyte recruitment during inflammation. Trends Immunol. 2003;24:25–29. doi:10.1016/s1471-4906(02)00013-3.
- Stone JH, Tuckwell K, Dimonaco S, Klearman M, Aringer M, Blockmans D, Brouwer E, Cid MC, Dasgupta B, Rech J, et al. Trial of Tocilizumab in Giant-Cell Arteritis. N Engl J Med. 2017;377:317–28. doi:10.1056/NEJMoa1613849.
- De Benedetti F, Brunner HI, Ruperto N, Kenwright A, Wright S, Calvo I, Cuttica R, Ravelli A, Schneider R, Woo P, et al. Randomized trial of Tocilizumab in systemic juvenile idiopathic arthritis. N Engl J Med. 2012;367:2385–95. doi:10.1056/NEJMoa1112802.
- Bijlsma JWJ, Welsing PMJ, Woodworth TG, Middelink LM, Petho-Schramm A, Bernasconi C, Borm MEA, Wortel CH, Ter Borg EJ, Jahangier ZN, et al. Early rheumatoid arthritis treated with Tocilizumab, methotrexate, or their combination (U-Act-Early): a multicentre, randomised, double-blind, double-dummy, strategy trial. Lancet. 2016;388:343–55. doi:10.1016/S0140-6736(16)30363-4.
- Yoshizaki K, Murayama S, Ito H, Koga T. The role of Interleukin-6 in Castleman disease. Hematol Oncol Clin North Am. 2018;32:23–36. doi:10.1016/j.hoc.2017.09.003.
- van Rhee F, Wong RS, Munshi N, Rossi JF, Ke XY, Fossa A, Simpson D, Capra M, Liu T, Hsieh RK, et al. Siltuximab for multicentric Castleman’s disease: a randomised, double-blind, placebo-controlled trial. Lancet Oncol. 2014;15:966–74. doi:10.1016/S1470-2045(14)70319-5.
- Kishimoto T. IL-6: from its discovery to clinical applications. Int Immunol. 2010;22:347–52. doi:10.1093/intimm/dxq030.
- Kishimoto T, Akira S, Narazaki M, Taga T. Interleukin-6 family of cytokines and gp130. Blood. 1995;86:1243–54. https://www.ncbi.nlm.nih.gov/pubmed/7632928.
- Heinrich PC, Behrmann I, Haan S, Hermanns HM, Muller-Newen G, Schaper F. Principles of interleukin (IL)-6-type cytokine signalling and its regulation. Biochem J. 2003;374:1–20. doi:10.1042/BJ20030407.
- Zegeye MM, Lindkvist M, Falker K, Kumawat AK, Paramel G, Grenegard M, Sirsjö A, Ljungberg LU. Activation of the JAK/STAT3 and PI3K/AKT pathways are crucial for IL-6 trans-signaling-mediated pro-inflammatory response in human vascular endothelial cells. Cell Commun Signal. 2018;16:55. doi:10.1186/s12964-018-0268-4.
- Rose-John S. IL-6 trans-signaling via the soluble IL-6 receptor: importance for the pro-inflammatory activities of IL-6. Int J Biol Sci. 2012;8:1237–47. doi:10.7150/ijbs.4989.
- Kallen KJ. The role of transsignalling via the agonistic soluble IL-6 receptor in human diseases. Biochim Biophys Acta. 2002;1592:323–43. doi:10.1016/s0167-4889(02)00325-7.
- Wolf J, Rose-John S, Garbers C. Interleukin-6 and its receptors: a highly regulated and dynamic system. Cytokine. 2014;70:11–20. doi:10.1016/j.cyto.2014.05.024.
- Chalaris A, Garbers C, Rabe B, Rose-John S, Scheller J. The soluble Interleukin 6 receptor: generation and role in inflammation and cancer. Eur J Cell Biol. 2011;90:484–94. doi:10.1016/j.ejcb.2010.10.007.
- Heink S, Yogev N, Garbers C, Herwerth M, Aly L, Gasperi C, Husterer V, Croxford AL, Möller-Hackbarth K, Bartsch HS, et al. Trans-presentation of IL-6 by dendritic cells is required for the priming of pathogenic TH17 cells. Nat Immunol. 2017;18:74–85. doi:10.1038/ni.3632.
- Boulanger MJ, Chow DC, Brevnova EE, Garcia KC. Hexameric structure and assembly of the interleukin-6/IL-6 alpha-receptor/gp130 complex. Science. 2003;300:2101–04. doi:10.1126/science.1083901.
- Varghese JN, Moritz RL, Lou MZ, Van Donkelaar A, Ji H, Ivancic N, Branson KM, Hall NE, Simpson RJ. Structure of the extracellular domains of the human interleukin-6 receptor alpha -chain. Proc Natl Acad Sci U S A. 2002;99:15959–64. doi:10.1073/pnas.232432399.
- Simpson RJ, Hammacher A, Smith DK, Matthews JM, Ward LD. Interleukin-6: structure-function relationships. Protein Sci. 1997;6:929–55. doi:10.1002/pro.5560060501.
- Kang S, Tanaka T, Narazaki M, Kishimoto T. Targeting Interleukin-6 Signaling in Clinic. Immunity. 2019;50:1007–23. doi:10.1016/j.immuni.2019.03.026.
- Garbers C, Heink S, Korn T, Rose-John S. Interleukin-6: designing specific therapeutics for a complex cytokine. Nat Rev Drug Discov. 2018;17:395–412. doi:10.1038/nrd.2018.45.
- Jones SA, Scheller J, Rose-John S. Therapeutic strategies for the clinical blockade of IL-6/gp130 signaling. J Clin Invest. 2011;121:3375–83. doi:10.1172/JCI57158.
- Fischer M, Goldschmitt J, Peschel C, Brakenhoff JP, Kallen KJ, Wollmer A, Grötzinger J, Rose-John S. I. . I. A bioactive designer cytokine for human hematopoietic progenitor cell expansion. Nat Biotechnol. 1997;15:142–45. doi:10.1038/nbt0297-142.
- Peters M, Blinn G, Solem F, Fischer M, Meyer Zum Buschenfelde KH, Rose-John S. In vivo and in vitro activities of the gp130-stimulating designer cytokine Hyper-IL-6. J Immunol. 1998;161:3575–81. https://www.ncbi.nlm.nih.gov/pubmed/9759879.
- Adams R, Burnley RJ, Valenzano CR, Qureshi O, Doyle C, Lumb S, Del Carmen Lopez M, Griffin R, McMillan D, Taylor RD, et al. Discovery of a junctional epitope antibody that stabilizes IL-6 and gp80 protein:protein interaction and modulates its downstream signaling. Sci Rep. 2017;7:37716. doi:10.1038/srep37716.
- Wei LH, Kuo ML, Chen CA, Chou CH, Lai KB, Lee CN, Hsieh C-Y. Interleukin-6 promotes cervical tumor growth by VEGF-dependent angiogenesis via a STAT3 pathway. Oncogene. 2003;22:1517–27. doi:10.1038/sj.onc.1206226.
- Catar R, Witowski J, Zhu N, Lucht C, Derrac Soria A, Uceda Fernandez J, Chen L, Jones SA, Fielding CA, Rudolf A, et al. IL-6 trans-signaling links inflammation with angiogenesis in the peritoneal membrane. J Am Soc Nephrol. 2017;28:1188–99. doi:10.1681/ASN.2015101169.
- Jones GW, McLoughlin RM, Hammond VJ, Parker CR, Williams JD, Malhotra R, Scheller J, Williams AS, Rose-John S, Topley N, et al. Loss of CD4+ T cell IL-6R expression during inflammation underlines a role for IL-6 trans signaling in the local maintenance of Th17 cells. J Immunol. 2010 Feb 15, 184(4):2130–39. doi:10.4049/jimmunol.0901528.
- Castell JV, Gomez-Lechon MJ, David M, Andus T, Geiger T, Trullenque R, Fabra R, Heinrich PC. Interleukin-6 is the major regulator of acute phase protein synthesis in adult human hepatocytes. FEBS Lett. 1989;242:237–39. doi:10.1016/0014-5793(89)80476-4.
- Paonessa G, Graziani R, De Serio A, Savino R, Ciapponi L, Lahm A, Salvati AL, Toniatti C, Ciliberto G. Two distinct and independent sites on IL-6 trigger gp 130 dimer formation and signalling. EMBO J. 1995;14:1942–51. https://www.ncbi.nlm.nih.gov/pubmed/7744001.
- Barton VA, Hudson KR, Heath JK. Identification of three distinct receptor binding sites of murine interleukin-11. J Biol Chem. 1999;274:5755–61. doi:10.1074/jbc.274.9.5755.
- Mihara M, Kasutani K, Okazaki M, Nakamura A, Kawai S, Sugimoto M, Matsumoto Y, Ohsugi Y. Tocilizumab inhibits signal transduction mediated by both mIL-6R and sIL-6R, but not by the receptors of other members of IL-6 cytokine family. Int Immunopharmacol. 2005;5:1731–40. doi:10.1016/j.intimp.2005.05.010.
- Schuster B, Kovaleva M, Sun Y, Regenhard P, Matthews V, Grotzinger J, Rose-John S, Kallen K-J. Signaling of human ciliary neurotrophic factor (CNTF) revisited. The interleukin-6 receptor can serve as an alpha-receptor for CTNF. J Biol Chem. 2003;278:9528–35. doi:10.1074/jbc.m210044200.
- Garbers C, Spudy B, Aparicio-Siegmund S, Waetzig GH, Sommer J, Holscher C, Rose-John S, Grötzinger J, Lorenzen I, Scheller J, et al. An interleukin-6 receptor-dependent molecular switch mediates signal transduction of the IL-27 cytokine subunit p28 (IL-30) via a gp130 protein receptor homodimer. J Biol Chem. 2013;288:4346–54. doi:10.1074/jbc.M112.432955.
- Lokau J, Nitz R, Agthe M, Monhasery N, Aparicio-Siegmund S, Schumacher N, Wolf J, Möller-Hackbarth K, Waetzig GH, Grötzinger J, et al. Proteolytic Cleavage Governs Interleukin-11 Trans-signaling. Cell Rep. 2016;14:1761–73. doi:10.1016/j.celrep.2016.01.053.
- Lamertz L, Rummel F, Polz R, Baran P, Hansen S, Waetzig GH, Moll JM, Floss DM, Scheller J. et al. Soluble gp130 prevents interleukin-6 and interleukin-11 cluster signaling but not intracellular autocrine responses. Sci Signal. 2018;11. doi:10.1126/scisignal.aar7388.
- Okazaki M, Yamada Y, Nishimoto N, Yoshizaki K, Mihara M. Characterization of anti-mouse interleukin-6 receptor antibody. Immunol Lett. 2002;84:231–40. doi:10.1016/s0165-2478(02)00202-x.
- Schett G, Elewaut D, McInnes IB, Dayer JM, Neurath MF. How cytokine networks fuel inflammation: toward a cytokine-based disease taxonomy. Nat Med. 2013;19:822–24. doi:10.1038/nm.3260.
- Choy EH, De Benedetti F, Takeuchi T, Hashizume M, John MR, Kishimoto T. Translating IL-6 biology into effective treatments. Nat Rev Rheumatol. 2020;16:335–45. doi:10.1038/s41584-020-0419-z.
- Shaw S, Bourne T, Meier C, Carrington B, Gelinas R, Henry A, Popplewell A, Adams R, Baker T, Rapecki S, et al. Discovery and characterization of olokizumab: a humanized antibody targeting interleukin-6 and neutralizing gp130-signaling. MAbs. 2014;6:774–82. doi:10.4161/mabs.28612.
- Köhler G, Milstein C. Continuous cultures of fused cells secreting antibody of predefined specificity. Nature. 1975;256(5517):495–97. doi:10.1038/256495a0.