
ABSTRACT
Triggering receptor expressed on myeloid cells 2 (TREM2) plays a crucial role in regulating microglial functions and removal of amyloid plaques in Alzheimer’s disease (AD). However, therapeutics based on this knowledge have not been developed due to the low antibody brain penetration and weak TREM2 activation. In this study, we engineered a TREM2 bispecific antibody to potently activate TREM2 and enter the brain. To boost TREM2 activation, we increased the valency of bivalent anti-TREM2 Ab2 IgG to tetra-variable domain immunoglobulin (TVD-Ig), thus improving the EC50 of amyloid-β oligomer (oAβ)-lipid microglial phagocytosis by more than 100-fold. Ab2 TVD-Ig treatment also augmented both microglia migration toward oAβ and microglia survival by 100-fold over the bivalent IgG antibody. By targeting the transferrin receptor (TfR), the brain-penetrating Ab2 TVD-Ig/αTfR bispecific antibody realized broad brain parenchyma distribution with a 10-fold increase in brain antibody concentration. Ab2 TVD-Ig/αTfR treatment of 5-month-old 5XFAD mice significantly boosted microglia-plaque interactions and enhanced amyloid plaque phagocytosis by microglia. Thus, potent TREM2 activation by a multivalent agonist antibody coupled with TfR-mediated brain entry can boost microglia clearance of amyloid plaques, which suggests the antibody has potential as an AD treatment.
List of abbreviations AD: Alzheimer’s disease; Ab: antibody; APOE: apolipoprotein E; Aβ: amyloid beta; BBB: blood–brain barrier; BLI: bio-layer interferometry; CNS: central nervous system; CSF: colony-stimulating factor; CytoD: cytochalasin d; DAM: microglia type associated with neurodegenerative diseases; DAP12: DNAX-activation protein 12; TVD-Ig: tetra-variable domain immunoglobulin; ECD: extracellular domain; ELISA: enzyme-linked immunoassay; ESC: embryonic stem cell; hMGLs: human embryonic stem cell-derived microglia-like lines; IBA1: ionized calcium-binding adaptor molecule 1; ITAM: immunoreceptor tyrosine-based activation motif; KiH: knob-into-hole; NFAT: nuclear factor of activated t-cells; PC: phosphatidylcholine; PK: pharmacokinetics; PS: phosphatidylserine; pSYK: phosphorylated spleen tyrosine kinase; scFv: single-chain variable fragment; SEC: size-exclusion chromatography; sTREM2: soluble triggering receptor expressed on myeloid cells 2; SYK: spleen tyrosine kinase; TfR: transferrin receptor; TREM2: triggering receptor expressed on myeloid cells 2.
Introduction
Alzheimer’s disease (AD) is a neurodegenerative disorder affecting more than 1 in 10 older Americans and is a leading cause of death.Citation1 Memory loss and cognitive decline also significantly affect the quality of life of AD patients. Pathologically, AD has the hallmarks of parenchymal deposition of extracellular amyloid-β oligomers (oAβ) and insoluble Aβ plaques, intraneuronal tau neurofibrillary tangles, neuronal loss, and synaptic dysfunction.Citation2,Citation3 As the brain’s resident immune phagocytes, microglia play a crucial role in regulating the amyloid pathology by clustering around Aβ plaques, forming a protective barrier to compact amyloid fibrils, and reducing neurotoxicity.Citation4,Citation5 Current anti-amyloid therapeutics also rely on microglia for the clearance of amyloid plaques, highlighting the importance of these cells.Citation6–9 Of the many genetic factors identified for late-onset AD, microglia-related coding variants such as triggering receptor expressed on myeloid cells 2 (TREM2) are among the most prominent.Citation10 Crucial roles of TREM2 in microglia and AD are revealed by the loss-of-function mutation variant R47H, which is associated with a several-fold increased risk of AD.Citation11
TREM2 is a single-pass receptor with an IgV-like domain expressed on the microglia surface. Known ligands of TREM2 include anionic and zwitterionic lipids, apolipoproteins, and oAβ.Citation11,Citation12 TREM2–ligand interactions are crucial in regulating central nervous system (CNS) homeostasis, including microglial phagocytosis of apoptotic neurons, damaged myelin, and amyloid plaques.Citation11–15 TREM2 signaling regulates key microglial functions, including metabolism, proliferation, survival, cytokine release, and accumulation around amyloid plaques.Citation11,Citation16 TREM2 deficiency reduces microglia clustering around plaques and microgliosis in 5XFAD and APPPS1 mouse models of AD.Citation13,Citation15 Additionally, elevated TREM2 expression augmented microglial responses to amyloid plaque, upregulated genes related to microglial phagocytosis, and reduced amyloid burden in 5XFAD mice.Citation17 Overall, these findings suggest that activating the TREM2 pathway may benefit AD by modifying microglial functions.
Several recently reported TREM2 agonistic antibodies showed limited biological effects in AD mouse models.Citation18–22 Due to limited brain entry, the TREM2 antibodies need to be administered at high doses to achieve a measurable biological impact on the brain. Even inside the brain, the IgG TREM2 agonistic antibodies showed suboptimal effects on amyloid pathology, which suggests a need for more potent TREM2 activation.Citation20
In this study, we aimed to discover and engineer highly potent TREM2 agonistic antibodies and test for their biological effects on microglial functions and amyloid pathology in cell-based assays in vitro and AD mouse models in vivo. By engineering the valency of bivalent IgG to tetravalent TVD-Ig, we improved the efficacy of the TREM2 agonist antibody by more than 100-fold in cell-based assays in vitro. To increase antibody brain entry, we engineered a bispecific antibody that targets the mouse transferrin receptor (TfR) for delivery crossing the blood–brain barrier (BBB), resulting in a more than 10-fold increase in TREM2 antibody brain entry. Treatment of 5XFAD mice with amyloid plaque accumulation in the brain with the αTREM2αTfR bispecific antibody showed significant microglial clustering and phagocytosis of amyloid plaques. Our results demonstrated the feasibility of engineering highly effective TREM2 targeting antibody therapies for the treatment of early-onset AD.
Results
The Ab2 antibody activates TREM2 without interfering with ligand–TREM2 interactions
We designed a strategy to screen TREM2 agonist antibodies that do not block TREM2 interaction with its ligands (). Nine positive single-chain variable fragments (scFv) clones were identified by panning a human scFv phage-displayed antibody library against the TREM2 extracellular domain (ECD). We then converted the nine scFv clones into human IgG1 antibodies (with LALAPG mutations (L234A, L235A, and P329G)Citation23) for further characterization. While all nine IgG1 antibodies were confirmed to bind to the TREM2 ECD protein in enzyme-linked immunoassay (ELISA), only four antibodies (clones 2, 6, 8, and 19) showed binding to cell surface-expressed TREM2 on HEK293T cell by flow cytometry ().
Figure 1. Discovery of a TREM2 agonist antibody that activates TREM2 without blocking TREM2–ligand interactions. (a) Illustration of the TREM2 agonist antibody screening strategy. (b) Flow cytometry showing candidate antibodies binding to cell surface TREM2 expressed on HEK293T cells. MFI: mean fluorescence intensity, n = 3 independent repeats. (c) Flow cytometry of TREM2-DAP12 NFAT-EGFP reporter cells showing the ligand competition profiles of the antibody candidates at 10 nM. n = 3 independent repeats. (d) Titration curves of antibody candidates in activating TREM2-DAP12 NFAT-EGFP reporter cells. The EC50 of Ab2 is labeled next to its titration curve. n = 3 independent repeats. (e) Titration curves of Ab2 for stimulating oAβ-lipid phagocytosis in hMGLs. MFI: mean fluorescence intensity. The EC50 of Ab2 is labeled next to its titration curve. n = 3 independent repeats. (f) Representative immunofluorescence images show that Ab2 stimulates oAβ-lipid phagocytosis in hMGLs. Scale bar = 10 μm. (g) Representative immunofluorescence images showing Ab2 binding to TREM2 expressed on HEK293T cell surface. Scale bar = 20 μm. (h) Representative immunofluorescence images showing Ab2 binding to hMGLs. Scale bar = 20 μm. For all the data presented, a bar graph with error bars represents the mean ± SD.
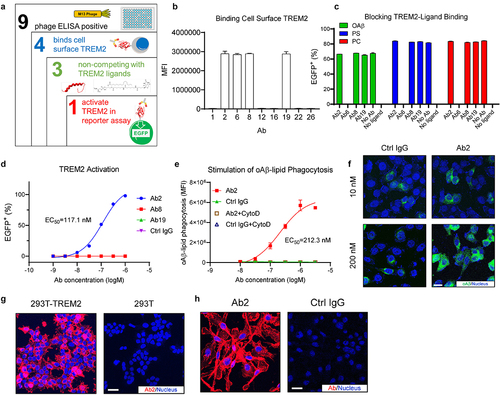
Interactions between TREM2 and its ligands, such as oAβ, phosphatidylcholine (PC), and phosphatidylserine (PS), have been shown to modulate microglia functions such as clustering around plaques, microglia metabolism and survival, and plaque-associated microgliosis.Citation13 Therefore, the agonist TREM2 antibodies should not interfere with any natural ligand binding. We next screened the four antibodies binding cell-surface TREM2 for their competition with the TREM2 natural ligands using a nuclear factor of activated T cells (NFAT)-enhanced green fluorescent protein (EGFP) reporter cell system that expresses TREM2- DNAX-activation protein 12 (TREM2-DAP12). The reporter cell line was constructed based on designs described previously.Citation13,Citation24 Ligand-TREM2 binding activates the immunoreceptor tyrosine-based activation motifs (ITAMs) of DAP12 phosphorylate, which further phosphorylate spleen tyrosine kinase (SYK) and trigger a series of signaling cascades leading to NFAT activation. In the NFAT-EGFP reporter cell system, ligand–TREM2 interactions trigger EGFP expression, which is downstream of NFAT-responsible elements.Citation25 As shown in , three of the four antibodies (Ab2, 8, and 19) did not exhibit antagonism against any of the three ligands. Using the same TREM2-DAP12 NFAT EGFP reporter cells, we tested if Ab2, 8, and 19 can activate TREM2 signaling in the absence of ligands. Ab2, but not Ab8 or Ab19, showed concentration-dependent activation of TREM2 signaling with an EC50 of 117.1 nM (), suggesting Ab2 is a TREM2 agonist antibody.
Given the positive connection between TREM2 activation and microglial phagocytosis of amyloid beta-lipid complexes,Citation26 we next studied if the TREM2 agonist antibody Ab2 can promote microglial phagocytosis of the oAβ-lipid complexes using human embryonic stem cell (ESC)-derived microglia-like lines (hMGLs), which were generated by in vitro differentiation of human ESC based on protocols described previously.Citation27,Citation28 As shown in , Ab2-treated microglia showed a concentration-dependent increase of oAβ-lipid phagocytosis, with an EC50 of 405.2 nM. We validated that the observed fluorescence signals were from increased phagocytosis by side-by-side co-treatment with cytochalasin d (CytoD), which inhibits actin–cofilin interaction and thus inhibits phagocytosis. As expected, CytoD treatment abolished the differences in fluorescent signals between the treatment groups (). Using fluorescent-labeled oAβ-lipid, we observed a significant increase in oAβ-lipid phagocytosis by microglia treated with Ab2 at 200 nM over control (Ctrl) IgG-treated microglia (). However, Ab2 at 10 nM showed no differences in promoting oAβ-lipid phagocytosis as compared to Ctrl IgG. This dose-dependent TREM2 activation by Ab2 is consistent with the titration curve data shown in . Taken together, these results indicate that Ab2 can enhance the microglial phagocytosis of the oAβ-lipid complexes by activating the TREM2 signaling pathway.
Ab2 binding to cell surface TREM2 was validated by immunofluorescent staining. As shown in , Ab2 showed strong cell surface staining to only TREM2-expressing HEK293T cells but not to the parent HEK293T cells. Ab2 also showed specific binding to microglia when compared to the Ctrl IgG in immunofluorescent imaging of ESC line (H9)-derived hMGLs (), in comparison to Ctrl IgG.
Engineering Ab2 from bivalency to tetravalency improves TREM2 activation by 100-fold in vitro
Although Ab2 demonstrates TREM2 agonist activities, the EC50 values of 117.1 nM would not be achievable in the brain by peripheral administration. Limited by the poor antibody penetration through BBB, less than 0.1% of the antibody administered peripherally will enter the CNS resulting in a low concentration of about 1 nM.Citation29 Therefore, we conducted antibody engineering to improve the EC50 values of 117.1 nM. It has been reported that increasing the valency from bivalent to tetravalent improved the antibody-mediated crosslinking of receptors.Citation30–32 Since TREM2 activation also requires receptor crosslinking, we engineered Ab2 into six different formats with tetravalent binding to TREM2 (). We next titrated the six engineered antibodies in the TREM2-DAP12 reporter system and all six tetravalent formats showed significantly improved TREM2 activation over the original Ab2 (). The fold-of-increase ranges from 10 to 300-fold. The TVD-Ig format showed the strongest TREM2 activation with an EC50 value of 0.31 nM ().
Figure 2. Engineering of TREM2 agonist Ab2 as TVD-Ig boosts the potency by more than 100-fold. (a) Illustration showing the 6 antibody formats used in the engineering study of Ab2. Although not depicted, all antibodies bear the LALAPG mutations in the Fc region which abolish the Fc-mediated effector functions of the antibodies. (b) Titration curves of various Ab2 formats in activating TREM2-DAP12 NFAT-EGFP reporter cells. The EC50 values of Ab2 TVD-Ig and IgG formats are labeled next to their respective titration curves. n = 3 independent repeats. (c). Immunoblotting shows the increased phosphorylation of SYK (as pSYK) of hMGLs treated with the Ab2 antibodies. (d) Titration curves of antibody-mediated SYK phosphorylation in hMGLs. Y-axis plots the fold change normalized to beta-actin and the untreated cell control. n = 3 independent repeats. (e) Titration curves of antibody-mediated stimulation of oAβ-lipid phagocytosis in hMGLs. MFI: mean fluorescence intensity. n = 3 independent repeats. (f) Representative immunofluorescence images showing Ab2 TVD-Ig (10 nM) stimulates oAβ-lipid phagocytosis in hMGLs, but Ab2 IgG shows no effect. Scale bar = 10 μm. (g) Representative immunofluorescence images show Ab2 TVD-Ig (10 nM) stimulates the migration of hMGLs toward oAβ-lipid, but Ab2 IgG shows no effect. Scale bar = 70 μm. (h) Titration curves of antibody-mediated stimulation of hMGLs migration toward oAβ-lipid. Y-axis presents the percentage of migration, which was calculated based on the migrated cell number divided by the total cell number. n = 3 independent repeats. (i) Titration curves of antibody-mediated stimulation of hMGLs survival under low CSF1 concentration (5 ng/mL). Y-axis presents percentage luminescence values produced by the ATP from live cells. n = 3 independent repeats. For all the data presented, a bar graph with error bars represents the mean ± SD.
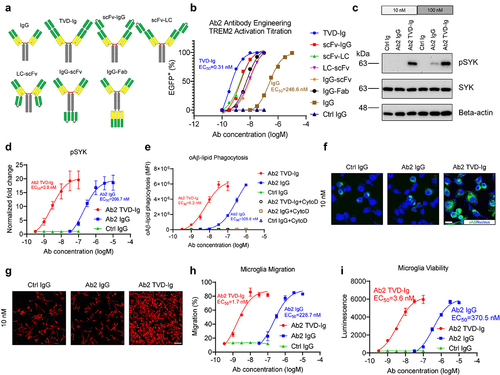
TREM2 signaling triggers the phosphorylation of SYK, which serves as a direct proof of TREM2 activation.Citation11,Citation33 We next tested the effects of Ab2 TVD-Ig in TREM2 activation by quantifying phosphorylated spleen tyrosine kinase (pSYK) level change in hMGLs, and Ab2 TVD-Ig-treated microglia showed a significant increase in phosphorylated SYK at both 10 nM and 100 nM concentrations (). In contrast, microglia treated by the original bivalent Ab2 only showed a minor increase in pSYK level at the 100 nM concentration when compared to the Ctrl IgG (). Further titration showed a concentration-dependent increase of pSYK levels by both Ab2 TVD-Ig and Ab2 IgG when compared to Ctrl IgG treatment (). However, Ab2 TVD-Ig demonstrated a high potency with an EC50 value of 2.8 nM, which is 73.5-fold more potent than that of Ab2 IgG (EC50 = 206.7 nM). Similarly, both Ab2 TVD-Ig- and Ab2 IgG-treated microglia showed a concentration-dependent increase of oAβ-lipid phagocytosis in comparison to the Ctrl IgG treatment, but the tetravalent Ab2 TVD-Ig (EC50 = 6.2 nM) showed a 49-fold increase in oAβ-lipid phagocytosis over the original bivalent Ab2 IgG EC50 = 305.6 nM) (). Immunofluorescence imaging showed that Ab2 TVD-Ig at 10 nM significantly enhanced oAβ-lipid microglial phagocytosis over the original bivalent Ab2 IgG at the same concentration ().
Microglia need to migrate toward amyloid to initiate Aβ removal and attenuate plaque toxicity.Citation13 TREM2 plays a critical role in regulating microglial migration toward amyloid.Citation27,Citation34 We studied if the tetravalent Ab2 TVD-Ig can enhance microglial migration toward oAβ-lipid complexes. In Transwell assays, Ab2 TVD-Ig at 10 nM significantly improved the migration of microglia toward oAβ-lipid over the original Ab2 IgG (). Further titration studies showed an EC50 of 1.7 nM for Ab2 TVD-Ig, which is 134.5-fold more potent than that of the original Ab2 IgG EC50 = 228.7 nM ().
TREM2 signaling promotes microglia survival, and the synergism between TREM2 and colony-stimulating factor-1 receptor (CSF1R) is crucial in plaque-associated microgliosis.Citation13 We tested whether Ab2 TVD-Ig can improve microglia survival under low colony-stimulating factor (CSF) concentration (5 ng/mL). As shown in , Ab2 TVD-Ig showed significantly stronger promotion of microglia survival than that of the bivalent Ab2 IgG antibody, as determined by an ultra-sensitive luminescence assay measuring ATP levels in live cells. The EC50 value for Ab2 TVD-Ig is 3.6 nM, which is 103-fold more potent than that of the original Ab2 IgG (EC50 = 370.5 nM).
Tetravalent TREM2 binding potently triggers TREM2 clustering on microglia without altering cellular TREM2 levels
TREM2 signals through association with DAP12. TREM2 activation triggers the phosphorylation of ITAMs in DAP12, SYK recruitment and phosphorylation, and downstream signaling cascades.Citation35 Ligand–TREM2 interaction signaling through the initiation of ITAM-mediated activation often requires the clustering of receptors by ligand.Citation36 Therefore, TREM2 activation often requires surface-coated ligands, cell surface-presented ligands, or large multimeric complexes.Citation18,Citation24,Citation26 We next examined if the enhanced TREM2 activation by the tetravalent Ab2 antibody is the result of increased receptor clustering by measuring the molecular size of antibody-TREM2 complexes using size-exclusion chromatography (SEC). The original bivalent Ab2 IgG antibody and TREM2 formed a complex with a retention time of about 37 min, and in contrast, the tetravalent Ab2 TVD-Ig showed a significantly larger complex size with TREM2 as indicated by the reduced retention time to 20–25 mins (), which suggests that the enhanced TREM2 activation by the tetravalent Ab2 TVD-Ig is the result of increased TREM2 clustering on microglia.
Figure 3. TREM2 activation by Ab2 TVD-Ig induces strong TREM2 clustering without changing TREM2 cellular distribution. (a) SEC profiles showing Ab2 TVD-Ig induces TREM2 clustering as indicated by the significantly larger complex sizes than that between Ab2 IgG and TREM2. (b) Representative immunofluorescence images showing Ab2 TVD-Ig (10 nM) stimulates TREM2 clustering in hMGLs, while Ab2 IgG only shows cell surface staining. Scale bar = 20 μm. (c) Flow cytometry showing TREM2 cell surface levels in antibody-treated hMGLs. MFI: mean fluorescence intensity. The figure legend labels the antibody treatment and the staining marker. n = 3 independent repeats. (d) Representative immunoblotting data showing sTREM2 levels in the supernatants of antibody-treated hMGLs. (e) Quantification of the immunoblotting data in D. Y-axis plots the fold change normalized to APP and the untreated cell control. n = 3 independent repeats. (f) Representative immunoblotting data showing total TREM2 levels in the antibody-treated hMGLs. (g) Quantification of the immunoblotting data in F. Y-axis plots the fold change normalized to calnexin and the untreated cell control. n = 3 independent repeats. For all the data presented, a bar graph with error bars represents the mean ± SD. For the statistical analysis, ns = not statistically different, two-tailed Student t-test.
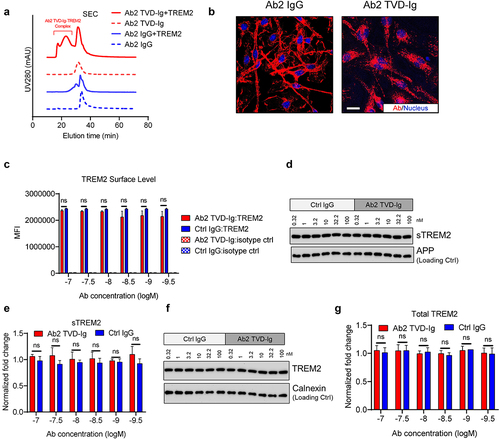
To further corroborate the SEC data, we visualized the clustering of TREM2 in microglia by immunofluorescent imaging. As shown in , hMGLs treated with 10 nM of Ab2 TVD-Ig showed aggregated and dot-like structures, which most likely represent the clustering of TREM2 molecules. In contrast, the bivalent Ab2 IgG at the same concentration showed evenly TREM2 binding on the cell surface of hMGLs. The SEC data and immunofluorescence imaging together support the hypothesis that tetravalent Ab2 TVD-Ig triggers potent TREM2 activation by inducing TREM2 clustering on microglia.
Ulland et al. observed a decrease in TREM2 surface level when microglia are activated, and the decrease was attributed to the release of soluble TREM2 (sTREM2) due to protease cleavage.Citation11 Without microglial surface TREM2 expression, external antibodies or ligands will not be able to activate the TREM2 pathway. The importance of continuous TREM2 availability inspired Schlepckow et al. to design an antibody-based strategy to block the α-secretase-mediated TREM2 shedding.Citation18 We, therefore, quantified TREM2 level changes in microglia when treated with Ab2 TVD-Ig by flow cytometry. As shown in , Ab2 TVD-Ig-treated microglia showed similar levels of TREM2 on the microglia cell surface as compared to that of the Ctrl IgG. No significant difference in TREM2 levels was observed across multiple antibody concentration points ranging from 0.1 to 100 nM (), indicating that TREM2 activation by Ab2 TVD-Ig does not reduce cell surface TREM2 levels.
Increased sTREM2 production was observed with lipopolysaccharide or interferon γ-mediated myeloid cell activation.Citation11 Considering that sTREM2 potentially modulates plaque pathology and serves as a biomarker for AD,Citation34,Citation37,Citation38 we studied whether sTREM2 levels change upon Ab2 TVD-Ig treatment. Using immunoblotting, we quantified sTREM2 levels in the culture supernatant of hMGL after antibody treatment. Ab2 TVD-Ig-treated hMGLs showed similar levels of sTREM2 production as compared to that of the Ctrl IgG across multiple antibody concentration points ranging from 0.1 to 100 nM (), indicating that TREM2 activation by Ab2 TVD-Ig does not alter sTREM2 levels. We also measured the change in total TREM2 level in microglia after antibody treatment by immunoblotting. Similar levels of total TREM2 were observed in Ab2 TVD-Ig-treated microglia as compared to that of the Ctrl IgG and across multiple antibody concentration points ranging from 0.1 to 100 nM (), indicating that TREM2 activation by Ab2 TVD-Ig does not alter the total TREM2 level in microglia. Collectively, TREM2 activation by Ab2 TVD-Ig does not alter the levels of cell surface TREM2, sTREM2, and total TREM2.
Efficient brain delivery of the TREM2 agonist antibody-mediated by TfR
While the tetravalent Ab2 TVD-Ig activates TREM2 and promotes crucial microglial functions with EC50 values in the 1–10 nM range in vitro, a pharmacologically effective concentration in the brain is still not achievable by peripheral injection due to BBB. Bispecific antibodies targeting the TfR transcytosis pathway have been shown to significantly improve the brain entry of recombinant proteins and antibodies.Citation29,Citation39–42 Using anti-mouse TfR bispecific antibodies, we recently successfully achieved significant improvement of antibody brain entry over 10-fold.Citation43 We next engineered bispecific antibodies that engage both TREM2 and mouse TfR to facilitate the TREM2 antibody brain delivery. As shown in , the Ab2 TVD-Ig was fused to the monovalent scFv αTfR to create the bispecific antibody Ab2 TVD-Ig/αTfR. The monovalent scFv αTfR binds TfR, allowing the receptor-mediated transcytosis to transport the antibody across the BBB. We choose the monovalent scFv αTfR based on our findings that bivalent αTf is trapped inside the blood vasculature, resulting in poor brain parenchyma antibody distribution.Citation44
Figure 4. Ab2 TVD-Ig/αTfR bispecific antibody shows broad brain parenchyma distribution with more than 10-fold increased brain concentration. (a) Illustration showing the design of Ab2 TVD-Ig/αTfR and the corresponding control bispecific antibodies. (b) Sandwich BLI study showing the single-molecule incorporation of both Ab2 and αTfR in the Ab2 TVD-Ig/αTfR bispecific antibody. The corresponding proteins involved in each binding phase were labeled in the shaded area. “Wash” means dipping the sensor into a blank kinetics buffer to allow free dissociation. (c) Titration curves of TREM2-DAP12 NFAT-EGFP reporter cells treated by the antibodies. The EGFP+ percentage was measured by flow cytometry. n = 3 independent repeats. (d) Illustration of the ELISA design for the quantification of Ab2 TVD-Ig/αTfR or Ab2 TVD-Ig/Ctrl in the brain lysate or serum. (e) Antibody concentrations in perfused brains 24 hours after treatment (20 mg/kg through intraperitoneal injection). n = 5 independent mice. (f) Antibody concentrations in serum 24 hours after treatment as described in E. n = 5 independent mice. (g) Brain/serum antibody concentration ratios 24 hours after treatment as described in E&F. The ratios presented in Y-axis were calculated by brain antibody concentration (nM) divided by serum antibody concentration (μM) × 100. n = 5 independent mice. (h) Representative immunofluorescence images showing the antibody distribution in mouse brains 24 hours after treatment (20 mg/kg through intraperitoneal injection). To detect Ab2 distribution, streptavidin-Alexa Fluor 555 was used. The same brain slices were also co-stained with CD31 (blood vessel) and TO-PRO-3 (nucleus) to allow co-localization visualization. Scale bar = 20 μm. For all the data presented, a bar graph with error bars represents the mean ± SD. For the statistical analysis, ** P < .01, *** P < .001, two-tailed Student t-test.
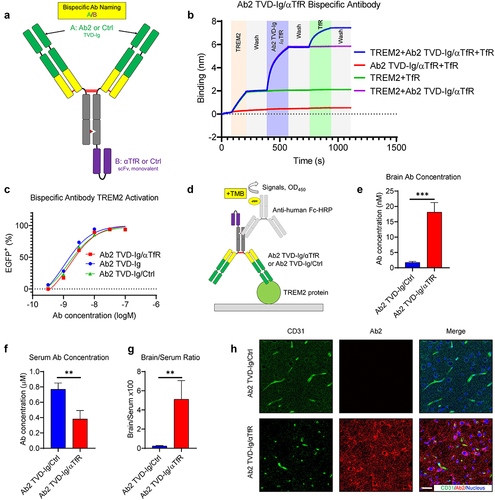
We used the knobs-into-holes strategy to facilitate heterodimerization of antibody heavy chains of the bispecific antibody. Heterodimerization between the two different antibody heavy chains is achieved by the introduction of “knob” mutations (T366W and S354C) into one arm of the heavy chain, and “hole” mutations (T366S, L368A, Y407V, and Y349C) in the other arm.Citation45 In addition to the above-mentioned modifications, we also incorporated LALAPG mutations (L234A, L235A, and P329G) to abolish antibody effector functions.Citation23,Citation46 We used the A/B format to name the different bispecific antibody constructs: “A” represents the TREM2-binding moieties (Ab2 or Ctrl in the TVD-Ig format) at the N-terminus, and “B” represents the TfR-binding moieties (αTfR or Ctrl IgG in a monovalent scFv format) ().
A sandwich bio-layer interferometry (BLI) assay was performed to validate that both Ab2 and αTfR are incorporated into the bispecific antibody (). The bispecific antibody Ab2 TVD-Ig/αTfR was first captured onto the BLI sensors via TREM2 (biotinylated and pre-captured via streptavidin-biotin binding). After equilibrium in a blank buffer, sensors with captured antibodies were next transferred to a solution containing muTfR ECD to confirm binding. Bispecific antibody Ab2 TVD-Ig/αTfR showed binding to both TREM2 and TfR, as demonstrated by the curve “TREM2+ Ab2 TVD-Ig/αTfR+TfR” (). Three “minus-one” control groups (missing one of the TREM2, Ab, or TfR) were included in the analysis. Curve Ab2 TVD-Ig/αTfR+TfR without TREM2 showed a complete flat curve, which confirmed that the observed binding signals are dependent on proteins being captured by TREM2. Curve TREM2+ TfR without Ab abolished TfR binding. Similarly, curve TREM2+ Ab2 TVD-Ig/αTfR without TfR resulted in a flat curve indicating no TfR binding. Taken together, these results indicate that the Ab2 TVD-Ig/αTfR bispecific can interact with both TREM2 and TfR.
We then validated that the Ab2 TVD-Ig/αTfR bispecific antibody retains the TREM2 activation activity using the TREM2 NFAT-EGFP reporter cell system. As shown in , the bispecific antibodies Ab2 TVD-Ig/αTfR and Ab2 TVD-Ig/Ctrl showed a similar level of TREM2 activation in comparison to the monospecific Ab2 TVD-Ig antibody, indicating that the bispecific antibody engineering did not compromise the abilities of bispecific antibodies to activate TREM2. We next studied the plasma and brain antibody concentrations of the bispecific antibodies (Ab2 TVD-Ig/αTfR or Ab2 TVD-Ig/Ctrl) 24 hours after a single intraperitoneal (IP) injection at 20 mg/kg in C57BL6 mice. We designed a sandwich ELISA to measure specifically the antibody concentration without interference from other serum proteins. As shown in , ELISA plates were coated with TREM2 protein, which specifically captures Ab2 TVD-Ig/αTfR or Ab2 TVD-Ig/Ctrl in the brain lysate and serum. The captured bispecific antibodies were then quantified by anti-human Fc-horseradish peroxidase (HRP).
For measuring antibody concentrations in the brain tissues, mice were perfused transcardially with Dulbecco’s phosphate-buffered saline (DPBS) before collecting the brains to avoid contaminating antibodies in the blood. As shown in , the antibody concentrations were 18.1 ± 2.8 nM and 1.7 ± 0.3 nM for Ab2 TVD-Ig/αTfR and Ab2 TVD-Ig/Ctrl, respectively, which represents a 10-fold increase for the bispecific antibody Ab2 TVD-Ig/αTfR over the control Ab2 TVD-Ig/Ctrl antibody.
Serum antibody concentrations were measured using the same sandwich ELISA 24 hours after injection, the antibody concentrations were 0.38 ± 0.09 μM and 0.76 ± 0.07 μM for Ab2 TVD-Ig/αTfR and Ab2 TVD-Ig/Ctrl, respectively (), which represents an average concentration difference of 0.4 μM (50% of Ab2 TVD-Ig/Ctrl). The quicker clearance of Ab2 TVD-Ig/αTfR may be attributed to the broad expression of TfR in the peripheral organs. The brain/serum antibody ratios are 5.11 ± 1.74 and 0.22 ± 0.05 for Ab2 TVD-Ig/αTfR and Ab2 TVD-Ig/Ctrl, respectively, which represents a striking 25-fold increase for the bispecific Ab2 TVD-Ig/αTfR over the Ab2 TVD-Ig/Ctrl control (). To confirm that the detected antibody by ELISA was distributed in the brain parenchyma but not being trapped inside vasculature, we performed immunofluorescence staining of floating brain slices. As shown in , Ab2 TVD-Ig/αTfR treatment showed significant antibody distribution outside of the blood vessel (CD31 staining), indicating that Ab2 TVD-Ig/αTfR was delivered into the brain parenchyma. In contrast, Ab2 TVD-Ig/Ctrl has almost no brain parenchyma staining due to the low antibody concentration (). Moreover, we showed that Ab2 TVD-Ig/Ctrl, Ab2 TVD-Ig/αTfR, and Ctrl/αTfR bispecific antibodies had no effects on the TREM2 surface expression (Fig. S1A), soluble TREM2 production (Fig. S1B), and total cellular TREM2 amount (Fig. S1C) in hMGLs.
TREM2 bispecific antibody improves microglia–plaque interactions
After demonstrating that the tetravalent Ab2 TVD-Ig/αTfR antibody potently activates TREM2 and promotes oAβ-lipid phagocytosis and microglia migration in vitro, we next tested the antibody for its biological effects in 5XFAD mice, which develops spontaneous amyloid plaques. We designed two control groups to show that both Ab2 and αTfR are necessary for the optimal in vivo effects. The Ab2 TVD-Ig/Ctrl construct has the αTfR arm replaced with a control antibody scFv that has no binding to TfR. The Ctrl/αTfR construct has the Ab2 TVD-Ig arm replaced with a Ctrl IgG that does not bind to TREM2.
We used 5-month-old 5XFAD mice that were already accumulated amyloid plaques.Citation47,Citation48 Since our antibody is specific to human TREM2 and does not bind to mouse TREM2, we implanted hMGLs in the bilateral ventricles (), which allow the cells to migrate to other brain regions, such as the cortex and hippocampus.Citation49 Based on the antibody brain PK profile shown in , we decided to administer the antibodies only once by IP injections at 20 mg/kg. The dosage would maintain an effective concentration of antibodies inside the brain during the 4-day experiment period. Antibodies were injected on the same day when the hMGLs were implanted (). To avoid complications of any long-term grafting rejection of human cells by the mice, mice were sacrificed 4 days after the treatment. Although short, the timer period is enough for microglial migration to the cortex through the lateral ventricles.Citation50
Figure 5. Ab2 TVD-Ig/αTfR significantly boosts microglia responses to amyloid plaques in 5XFAD mice. (a) Illustration showing the design of microglia grafting and animal treatment experiment. The microglia were grafted into lateral ventricles, and the antibodies were delivered through intraperitoneal (IP) injection. (b) Representative immunofluorescence staining images of amyloid plaque-microglia co-localization in the cortex of 5-mo-old 5XFAD mice treated by the designated antibodies (20 mg/kg intraperitoneal injection). Scale bar = 20 μm. (c) Quantification of IBA1 area within 30 μm of amyloid plaques in the cortex of mice treated as described in B. n = 5 independent mice. (d) Representative immunofluorescence staining images of amyloid plaque-CD68 co-localization in the cortex of 5XFAD mice treated as described in B. Scale bar = 20 μm. (e) Quantification of CD68 area within 30 μm of amyloid plaques in the cortex of mice treated as described in B. n = 5 independent mice. For all the data presented, a bar graph with error bars represents the mean ± SD. For the statistical analysis, ns = not statistically different, *** P < .001, two-tailed Student t-test.
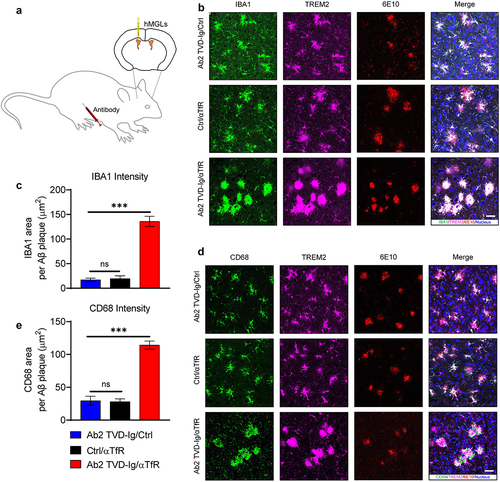
TREM2 has been shown to play key roles in microglia clusters surrounding plaques and the subsequent removal of plaques.Citation13 We collected the brains from the treated mice after perfusion. Floating slices were stained with the 6E10 antibody to label Aβ plaques. We used a human IBA1-specific antibody and a human TREM2-specific-antibody to label human microglia. As shown in , the IBA1 area within 30 µm of plaques was 135.8 ± 9.29 µm2 in the Ab2 TVD-Ig/αTfR treated mice, which represents a significant increase of sevenfold over mice treated with Ab2 TVD-Ig/Ctrl (IBA area = 17.13 ± 3.06 µm2) or Ctrl/αTfR (IBA area = 19.34 ± 5.27 µm2), indicating that the tetravalent Ab2 TVD-Ig/αTfR bispecific antibody significantly increased microglia clustering surrounding the plaques. This observation is consistent with our in vitro cell-based results showing that Ab2-mediated TREM2 activation promotes microglia migration toward the oAβ-lipid complex. We observed significant co-localization of IBA1 and TREM2 staining (), which indicates the expression of TREM2 in hMGLs. This finding is consistent with the previous report that TREM2 is expressed in microglia.Citation13
In addition to the clustering of microglia surrounding the plaques, microglia-mediated phagocytosis is also crucial in the removal of amyloid plaques. The phagocytic marker of microglia CD68 is frequently used to study the phagocytic status of plaque proximal microglia.Citation20,Citation34,Citation48 We stained the floating brain slices of the treated mice with human CD68, human TREM2, and 6E10, and the results showed an observed significant threefold increase of CD68 area (114.21 ± 5.61 µm2) surrounding the plaques in the Ab2 TVD-Ig/αTfR-treated mice over Ab2 TVD-Ig/Ctrl (29.56 ± 6 µm2) or Ctrl/αTfR (28.1 ± 3.82 µm2) (). This observation is consistent with our in vitro cell-based study results showing that Ab2-mediated TREM2 activation promotes microglia phagocytosis of the oAβ-lipid complexes. As expected, we also observed co-localization of CD68 signals with TREM2, which confirms that hMGLs are active in phagocytosis and TREM2 is expressed by hMGLs. In contrast, the Ab2 TVD-Ig/Ctrl and Ctrl/αTfR treatments showed no significant differences from each other in either IBA1/plaque or CD68-plaque colocalization (). Taken together, these results indicate that the biological effect of the Ab2 TVD-Ig/αTfR bispecific antibody is dependent on both Ab2 for potent TREM2 activation and αTfR for efficient brain entry.
Discussion
The TREM2 agonist antibody Ab2 was identified by a series of screening steps that determined whether the antibody binds to cell surface-expressed TREM2; does not compete with TREM2 interaction with its ligands; activates TREM2-DAP12 reporter cells without being coated on the surface or engaging the Fc receptors; and enhances phagocytosis of oAβ-lipid complexes by microglia. One of the challenges of developing TREM2 targeting antibodies for AD treatment is the relatively weak agonist activities of the antibodies in vitro and in vivo.Citation20–22 Our next goal was to increase the efficacy of the TREM2 agonist antibody Ab2 by engineering. By engineering the antibody from bivalency to tetravalency, we were able to improve the EC50 value in the TREM2 reporter cells by 100-fold. The tetravalent Ab2 TVD-Ig was further validated to potently stimulate microglial phagocytosis of oAβ-lipid complexes, microglial migration toward oAβ-lipid, and microglia viability under CSF depletion. Mechanistic studies showed that the tetravalent Ab2 TVD-Ig format enhanced TREM2 activation through increased receptor clustering, but without affecting either cell surface or overall TREM2 levels in microglia. Another challenge in developing TREM2 targeting antibodies for AD treatment is the relatively low brain entry of the antibodies when administered systemically due to the BBB.Citation39,Citation51 By engineering a bispecific antibody targeting both TREM2 and TfR, we successfully increased the brain concentration of Ab2 by 10-fold. More significantly, the tetravalent TREM2-targeting and monovalent TfR-engaging Ab2 TVD-Ig/αTfR bispecific antibody demonstrated potent in vivo efficacy in promoting microglia migration toward amyloid plaques and phagocytosis of amyloid plaques in the 5XFAD mouse model of AD.
When screening for TREM2 agonist antibodies as potential drug candidates for the AD treatment, we placed a special criterion that the antibodies do not interfere with TREM2 interactions with their natural ligands. The interaction of TREM2 and its natural ligands is crucial for the normal functions of microglia, and impediments to TREM2 ligand interactions may result in adverse side effects.Citation16,Citation52 Multiple TREM2 ligands such as phospholipids and oAβ have already been identified to modulate important microglial functions, which include microglia survival, depolarization, response to amyloid plaques, and clearance of plaques and toxic amyloid populations.Citation12,Citation13 In contrast, similar criteria were not considered in reports of other TREM2 agonistic antibodies.Citation18–22
In Wang et al.’s study of TREM2 agonist antibodies, the antibodies need to be coated on surfaces to be active.Citation20 Surface coating of antibodies, however, has been shown to mediate receptor activation by inducing receptor clustering on the cell surface.Citation53 Since solid coating cannot be achieved in vivo, it is expected that the agonist activity of an antibody requiring a surface coating will have suboptimal responses in vivo.Citation18–22 In our TREM2-DAP12 reporter cell assay, Ab2 was presented as a soluble molecule in the culture medium, suggesting that the agnostic activity of the Ab2 can be translated to in vivo efficacy as demonstrated in the 5XFAD mice. Many immune cells including microglia express Fc receptors and engaging Fc receptors by an antibody may have unexpected detrimental effects, such as the potential immune attack of TREM2-positive cells (such as microglia and osteoclasts) by natural killer cells via Fc receptor-mediated immune effector functions, such as antibody-dependent cellular cytotoxicity and antibody-dependent cellular phagocytosis.Citation54–57 More importantly, engaging inhibitory Fc receptors, such as CD32B, may negatively impact TREM2 activation by recruiting phosphatases, such as SH2 domain-containing protein tyrosine phosphatase-1 and SH2 domain-containing protein tyrosine phosphatase-2.Citation33,Citation58 For these reasons, our TREM2 antibodies were engineered to be defective in engaging Fc receptors via introduction of the LALAPG mutations (L234A, L235A, and P329G) in the Fc region of the antibodies. Previously reported TREM2 antibodies were also engineered to avoid interacting with Fc receptors.Citation18–22
It has been reported that microglia are more responsive to oAβ-apolipoprotein complexes than to oAβ alone.Citation26 The increased efficiency for microglial phagocytosis of oAβ-apolipoprotein complexes was attributed to the strong interactions between apolipoprotein and TREM2.Citation26 In comparison, oAβ has been shown to have weak interactions with TREM2.Citation13 More importantly, lipids and apolipoprotein E (APOE) are naturally associated with amyloid plaques.Citation59–63 The interactions between lipids and Aβ fibrils were found to be responsible for the formation of more neurotoxic protofibrils.Citation61,Citation64 Also, the association of APOE and amyloid plaques enhances plaque seeding and impedes plaque clearance.Citation60,Citation65–68 In the microglia in vitro studies, instead of using oAβ alone, we used the complexes of oAβ, phospholipid PS, and APOE. Therefore, we used the more biologically relevant complexes of oAβ, PS, and APOE to validate the functions of TREM2 agonistic antibodies.
Receptors that rely on ITAM for signaling need multivalent ligands to effectively induce receptor clustering and trigger the downstream signaling cascade. In this study, we demonstrated that increasing the antibody valency from bivalent to tetravalent resulted in a 100-fold increase in TREM2 activation. More importantly, we showed that the increased TREM2 activation is manifested as improved microglia functions responding to amyloid plaques. In contrast, all previously reported TREM2 targeting antibodies were tested in the bivalent IgG format, which may explain their suboptimal activation of TREM2.Citation18–22 Similar tetravalency strategies have been used to increase the clustering of receptors, such as the human epidermal growth factor receptor 2 and OX40 (also known as the CD134 or tumor necrosis factor receptor superfamily member 4).Citation30,Citation69,Citation70 Beyond the tetravalency strategies, bi-epitopic tetravalent antibodies could be even a more powerful alternative.Citation30,Citation69,Citation70 Such a strategy may be explored in the future to further improve the potency of the current TREM2 antibodies.
In this study, we demonstrated that TfR-mediated antibody brain delivery increased Ab2 brain concentration by more than 10-fold. Similar strategies have been exploited previously to increase brain concentrations of antibodies targeting beta-secretase 1 or amyloid plaques.Citation40–42,Citation44 A positive correlation between the increased antibody delivery and improved in vivo biological effects was observed in these studies.Citation40–42,Citation44 In comparison, all the reported TREM2 antibodies did not have brain targeting capabilities, and as a result, a much higher dose (100 mg/kg) or much more frequent dosing (twice per week) at a high dose (60 mg/kg) is required to reach effective brain concentration.Citation18,Citation20 Although more complex than the simple bivalent IgG, it is feasible to develop αTfR-containing tetravalent bispecific antibody therapies since bispecific antibodies using αTfR and other targeting strategies have been well studied in clinical trials.Citation40,Citation71–76
In this study, we observed that Ab2 TVD-Ig/αTfR treatment enhanced microglia migration toward amyloid plaques with increased phagocytosis of plaques in the 5XFAD mice. Our observation that TREM2 agonism boosts microglia-plaque interactions is consistent with previous findings with other TREM2 agonistic antibodies.Citation18,Citation20 The results of our study are also consistent with previous findings that TREM2 regulates microglia responses to amyloid plaques, which include clustering around plaques, microglia metabolism and survival, and plaque-associated microgliosis.Citation12,Citation13 The difference between our work and the TREM2 antibodies reported previouslyCitation20 is that our unique αTfR-containing tetravalent TREM2 bispecific antibody design resulted in significantly higher antibody brain concentration and much stronger TREM2 activation, which may explain the significantly enhanced microglia clustering and phagocytosis of plaques.
Our study has several limitations. Before collecting the brain tissue, the mice were extensively perfused with PBS in order to remove blood and avoid interference. The brain tissue was then homogenized, and the antibody concentrations in the lysate were quantified by sandwich ELISA. Such a method has been used previously to quantify TfR-mediated antibody brain delivery without capillary depletion.Citation41,Citation42 We acknowledge that antibodies bound to brain vasculature would also be detected in the ELISA assay, and therefore we validated the ELISA results by immunostaining to visualize true antibody distribution in brain parenchyma.Citation43 Future studies should consider using capillary depletion to remove any interference from TfR antibodies bound to the capillary to provide a more accurate quantification of antibody distribution in the brain tissue.Citation77
In this study, we did not investigate whether Ab2-based TREM2 agonism affects TREM2 R47H or other mutants. Previously, a genetic association study showed R47H variant in 22 of 1091 AD cases versus five of 1,105 controls with an odds ratio of 4.5.Citation10 Considering the significant impact on TREM2 functions by the mutants, future experiments should thoroughly study the effects of Ab2 TVD-Ig on known TREM2 mutants.Citation11
Since the Ab2 antibody is specific to the human TREM2 and not cross-reactive to the mouse TREM2, we carried out the in vivo studies by implanting hMGLs in the brains of 5XFAD mice. However, such a model prevents us from conducting long-term efficacy studies due to the rejection of hMGLs in the immunocompetent 5XFAD mice. In future studies, we could use an immunodeficient 5XFAD model that expresses human cytokines CSF1, IL3, SCF, and GM-CSF.Citation27,Citation78 Although the immunodeficient model was demonstrated for successful long-term grafting of human microglia into mice, complications were observed in immunodeficient Rag-5XFAD mice, which showed significantly quicker amyloid pathology due to the lack of adaptive immune system.Citation78 Long-term studies in the future may also use human TREM2 knock-in 5XFAD mice, as used by Wang et al.Citation20 In future experiments, a more thorough study of microglia activation phenotype is needed. Microglia activation may have distinct phenotypes, inflammatory (or M1 state) and anti-inflammatory (or M2 state).Citation79,Citation80 Therefore, a detailed study to dissect the exact microglia phenotype after TREM2 agonistic antibody treatment, particularly after in vivo treatment, is a crucial experiment to understand the mechanisms.
In addition, the αTfR used in the Ab2 TVD-Ig/αTfR construct is mouse specific. Therefore, Ab2 TVD-Ig/αTfR is a proof-of-concept molecule in a mouse model of AD. For drug discovery purposes, we have generated an Ab2 TVD-Ig bispecific construct with a human TfR-specific antibody, which will facilitate delivery of the molecule crossing the human BBB. The molecule is currently in preclinical development. Part of the preclinical development is a GMP CMC package with thorough biophysical and biological characterization of the lead molecule, which is out of the scope of this study.
Overall, we have demonstrated the feasibility of engineering a potent TREM2 antibody with remarkable efficacy in improving amyloid pathology in vitro and in vivo models of AD and provided proof of concept of developing the antibody as a potential therapy for AD treatment.
Materials and methods
Cell lines
HEK293T was acquired from the American Type Culture Collection and cultured in DMEM+10% fetal bovine serum (FBS). The 2B4 NFAT-GFP reporter cell line was cultured in RPMI-1640 + 10% FBS.
Panning of phage-displayed scFv antibody libraries
A phage-displayed scFv antibody library was constructed previously.Citation81 Panning of the library for TREM2-specific antibodies was carried out as described with modifications.Citation81 Briefly, MaxiSorp Nunc-Immuno tubes (Thermo Fisher Scientific) were coated with 20 μg/mL TREM2-His in DPBS overnight at 4°C. Unbound antigen was removed after washing with DPBS. After blocking the surface with 5% milk in DPBS, the phage library was incubated with the coated TREM2 for 2 hours at room temperature (RT) in 5% milk. After washing with PBS+0.05% tween-20 to remove unbound phage, captured phage was eluted by incubating with 100 mM triethanolamine for 20 min. Eluted phage-infected log-phase growing E. coli TG1 and then were amplified on 2x YTAG agar 500 cm2 square plate (Corning) at 30°C overnight. The amplified phage-infected TG1 was used to prepare the phage for the next round of panning using the M13 KO7 helper phage. The enrichment process was carried out in three rounds using the output from the previous round as the input for the next round.
After three rounds of panning, the output titer was measured and single colonies were used to prepare phage for ELISA. High-binding ELISA plates (Corning) were coated with TREM2-His at 2 μg/mL overnight at 4°C. After blocking with 5% milk in PBS, phage prepared from single TG1 colonies in 5% milk PBS was incubated with coated TREM2 for 1 hour at RT. After washing with PBS+0.05% Tween-20, anti-M13-HRP (Santa Cruz Biotechnology) was added at 1:2000 concentration and incubated for 1 hour at RT. After washing with PBS+0.05% Tween-20, TMB substrate (Thermo Fisher Scientific) was added and incubated for 5 min before being stopped by 1 N H2SO4. Optical density (OD) values were read at 450 nm. The top 20% of high-binding clones were selected for further characterization. Phagemids were extracted using Qiagen BioRobot Universal System in 96-well format. After DNA sequencing, sequences were analyzed using IMGT V-quest (www.imgt.org/IMGTindex/V-QUEST.php) to identify antibody sequences with unique CDR3 regions.
Construction and production of antibodies
Unique scFv clones were converted into human IgG1 using mixed universal primers with degeneracy.Citation81 Individual heavy and light variable chains were amplified using PrimeStar GXL polymerase (Takara Bio). Gel-purified variable chain fragments were cloned into digested vectors using In-Fusion HD cloning enzyme mix (Takara Bio). After the converted plasmid was sequenced, sequence-verified IgG plasmids were transfected into Expi 293 cells at the 2-mL scale. The ratio between the heavy chain and light chain plasmids is 1:1. After culturing for 5 days, cells were removed and antibody-containing supernatant was collected for screening assay.
For constructing various antibody formats and bispecific antibodies, the corresponding gene fragments were fused in the following manner: the desired gene fragments were first amplified using PrimeStar GXL polymerase (Takara Bio), and up to 3 fragments were then fused to create the whole or part of the antibody format using In-fusion HD cloning enzyme mix (Takara Bio) until the desired constructs were made. When expressing the antibodies in Expi293 F cells, the heavy chain and light chain plasmids were co-transfected at equal ratios. Expi293-produced antibodies were purified using CaptivA Protein A affinity resin (Repligen) and eluted with 0.1 M glycine (pH = 2.5) and then neutralized with 1/20 volume 1 M Tris-HCl (pH = 9). Buffer exchange to DPBS was done using Amicon Ultra-15 ultrafiltration units (Mw cutoff = 30k) (MilliporeSigma).
Immunofluorescence studies
Cells were seeded in 8-well chamber slides (Thermo Scientific) at indicated density the night before conducting the assay. For 293 T and 293 T-TREM2, the density is 4 × 10⁴ cells per well. For microglia, the density is 5 × 10⁴ cells per well.
The microglia phagocytosis assay was carried out as follows. After overnight culture, 1 μM oAβ-lipid (Alexa Fluor 555 labeled) was mixed with indicated antibodies and incubated with cells for 2 hours in 1% bovine serum albumin (BSA) PBS. After the phagocytosis experiment, the cells were fixed for 15 min in 4% paraformaldehyde (PFA) at 4°C. The nucleus was labeled with TO-PRO-3 (Thermo Scientific, T3605) at 1 μM for 15 min at RT. The cells were then mounted using ProLong Gold Antifade Mountant (Thermo Scientific, P36930) and imaged using Leica TCS SP5 confocal microscope.
For 293 T and 293 T-TREM2 surface staining, overnight cultured cells were washed once with DPBS to remove the medium and then blocked in 1% BSA PBS for 1 hour. After fixing 15 min in 4% PFA at 4°C, the cells were washed once by DPBS to remove PFA. Ab2 (100 nM) was added in 1% BSA PBS for 1 hour, and excessive Ab2 was washed away by DPBS 3 times. Anti-human Alexa Fluor 488 (Jackson Immunoresearch, 109–545-088) was added at 1 μg/mL for 1 hour in 1% BSA PBS. The nucleus was labeled with TO-PRO-3 (Thermo Scientific, T3605) at 1 μM for 15 min at RT. The cells were then mounted using ProLong Gold Antifade Mountant (Thermo Scientific, P36930) and imaged using Leica TCS SP5 confocal microscope.
For microglia antibody staining, the procedure was similar to the 293 T staining procedure described above, except biotinylated Ab2 (prepared in-house using Sulfo-NHS-Biotin, ThermoFisher, 21217) was used and the signal was detected by streptavidin-Alexa Fluor 488 (Jackson Immunoresearch, 016–540-084). During the entire blocking and incubation, 0.1 mg/mL human IgG1 Fc fragment (Jackson Immunoresearch, 009–000-008) was added together with 1% BSA PBS to block interactions with Fc receptors.
Microglia viability
Human ESC line (H9)-derived hMGLs were prepared as previously described.Citation28 Differentiated cells were washed and resuspended in basic culture media (DMEM/F12, insulin 0.02 mg/mL, holo-transferrin 0.01 mg/mL, sodium selenite 13.4 µg/mL, B27 2% v/v, N2, 0.5% v/v, monothioglycerol 0.2 mM, glutamax 1x, and NEAA 1x) with designated antibodies and 5 ng/ml human M-CSF (Biolegend). After 5 days of treatment, cellular ATP levels were measured by luminescence detection to indicate cell viability with CellTiter-Glo (Promega).
Size exclusion chromatography
SEC profiles of TREM2 antibody and TREM2/antibody complexes were determined by the ÄKTA pure protein purification system (Cytiva). Briefly, purified antibodies and human TREM2-His (Sino Biological, 11084-H08H) were mixed at a 2:1 ratio with the antibody at 1 mg/mL concentration. A total of 100 µl of the mixture was injected and run at 36 mL at 0.5 ml/min using an isocratic gradient over a Superose 6 Increase 10/300 GL column in 1X PBS, pH 7.4 running buffer.
Immunostaining of mouse brain sections
Brains were collected, with one half flash-frozen in liquid nitrogen and the other half prepared for cryo-sectioning. For immunofluorescence, half of the mouse brains were dipped into 4% PFA for 1 day, then 30% sucrose for 2 days before being embedded into OCT medium (Sakura) and sectioned using Leica Cryostat CM1950 into 40 μm floating coronal sections. The floating sections were stored at 4°C in PBS with 0.01% sodium azide until use.
Floating sections were first blocked in 1% BSA PBS with 0.3% Triton X-100 for 2 hours, then stained with corresponding antibodies: CD31 (1:500, R&D system, AF3628), streptavidin-Alexa Fluor 488 (1:500, Jackson Immunoresearch, 016–540-084), IBA1 (1:1000, Abcam, ab5076), 6E10 (1:500, Biolegend, 803019), and CD68 (1:500 Biolegend, 333812), or TREM2 (1:1000, Thermo Fisher, 27599-1-AP) in 1% BSA PBS with 0.3% Triton X-100 overnight at 4°C with gentle shaking. After washing in PBS 0.3% Triton X-100, corresponding secondary antibodies with fluorescent labeling were incubated with brain slices for 2 hours at 4°C with gentle shaking. The nucleus was stained with TO-PRO-3 (1 µM) in DPBS for 30 min and then mounted using ProLong Gold Antifade Mountant (Thermo Scientific). Brain slices were imaged using a Leica TCS SP5 confocal microscope. The quantification was done using ImageJ as previously described.Citation48,Citation82 For quantification of the fluorescent intensity of indicated markers in the mouse cortex and hippocampus, images were analyzed by ImageJ, and the background was subtracted by the software before quantification.
Bispecific antibody validation by BLI
Streptavidin sensors (Fortebio) were used to capture biotinylated TREM2 proteins (Sino Biological, 11084-H08H). During all incubation steps, samples were kept at RT with 1000 rpm shaking. In the TREM2 loading step, 100 nM biotinylated TREM2 proteins were incubated with the sensors for the designated time. In the bispecific antibody interaction steps, 200 nM antibodies were used. In the muTfR incubation step, 100 nM muTfR-His (Sino Biological, 50741-M07H) were used. Between incubations, the sensors were dipped into blank kinetic buffers to allow the free dissociation of proteins.
Immunoblotting
Cell lysate or brain lysate were obtained by lysing cells or brain tissues using NP-40 lysis buffer (1% NP40, 50 mM Tris-HCl, pH = 8, 150 mM NaCl) with Halt Protease and Phosphatase Inhibitor Cocktail (100X) (Thermo Fisher) for 1 hour with shaking. After removing debris by centrifugation at 14,000 rpm for 10 min, the total protein amount was normalized by Pierce BCA Protein Assay Kit (Thermo Fisher). Protein samples were resolved by 10% SDS-polyacrylamide gels (Bio-Rad) and later transferred onto Immun-Blot PVDF membranes (Bio-Rad). Proteins were probed with specific primary antibodies and secondary antibodies diluted in 5% BSA TBST.Citation12,Citation83,Citation84 Antibodies used were SYK (1:1000, Cell Signaling Technology, 13198S), pSYK (1:1000, Cell Signaling Technology, 2710), ACTB (1:1000, Cell Signaling Technology, 4970), APP (1:500, Millipore Sigma, MABN2297), sTREM2, and TREM2 (1:500, Millipore Sigma, MABN755), Calnexin (1:1000, Abcam, ab22595). The immunoreactive bands were visualized with the West Pico PLUS Chemiluminescent Substrate (Thermo Fisher). The immunoreactive bands were quantified using ImageJ. Three independent treatment replicates were conducted with the representative immunoblot shown.
Antibody brain distribution study
The C57BL/6 mice were used to investigate the antibody distribution after peripheral administration. For mouse experiments, one individual would randomize the animals, plates, and slides, and another would analyze them. The sample size for all experiments was held at five mice per group based on the design of previous studies.Citation18,Citation21 All procedures were performed following National Institutes of Health guidelines and approval from the University of Texas Health Science Center at Houston Institutional Animal Care and Use Committee. All in vitro experiments were performed at least twice, each with at least three technical repeats.
C57BL6 mice (female, 8-week-old, Jackson Laboratory) were randomly grouped into five mice per group. Mice received IP injection of antibodies in 0.2 mL DPBS. Blood was collected 24 hours after injection via tail vein and the mice then received transcardial perfusion at 2 mL/min by DPBS for 10 min. The brain tissues were processed as described above for immunofluorescent staining or biochemical analysis.
Measurement of antibody concentration in brain and serum
High-binding ELISA plates (Corning) were coated with human TREM2 (Sino Biological) at 2 μg/mL overnight at 4°C. After blocking with 1% BSA PBS, individual brain lysates were incubated with coated capture antigen for 2 hours at RT. After washing with PBS+0.05% Tween-20, anti-human Fc-HRP (Jackson ImmunoResearch, 109-035-088) was added at 1:5000 concentration and incubated for 1 hour at RT. After washing with PBS+0.05% Tween-20, TMB substrate (Thermo Fisher Scientific) was added and incubated for 5 min before being stopped by 1 N H2SO4. The OD values were read at 450 nm. Standard curves were established for individual antibodies using purified corresponding bispecific antibodies following the same method listed above.
NFAT-GFP reporter assay
The TREM2-DAP12 reporter construct was generated by fusing human TREM2 (aa 19–169) with huDAP12 (aa 28–113) with D50A mutation. The original signal peptide of TREM2 was replaced by a leader sequence from the mouse immunoglobulin κ light chain. A HA tag was introduced to the N-terminus of TREM2. All chimeric reporter genes were cloned into pCDH-CMV-MCS-IRES-Puro. The 2B4 reporter cells transduced with individual reporter constructs were generated by lentivirus transduction. To prepare lentivirus particles, pCMV-VSV-G (Addgene 8454), pCMV delta R8.2 (Addgene 12263), and individual pCDH transfer plasmids containing GOI were transfected into HEK293T cells. The 2B4 NFAT-GFP parental reporter cells were transduced with lentivirus supernatant (1:1 diluted in RPMI-1640) overnight under the presence of 10 μg/mL polybrene (Santa Cruz Biotechnology). After 48 hours of transduction, the cells were selected with 1 μg/mL puromycin until a sufficient number of cells with transgene emerged.
For the reporter assay, ligands were coated onto a 96-well cell culture plate at their optimal concentrations determined in preliminary experiments: oAβ (1 μM in DPBS, overnight, 4°C), PS (0.1 mg/mL in methanol, RT until fully evaporated), and PC (L-α-phosphatidylcholine, purchased from Avanti Polar Lipids, 0.03 mg/mL in methanol, RT until fully evaporated). After ligand coating, unbound ligands were removed by washing with DPBS 3 times. A total of 100,000 reporter cells were seeded into individual wells (96-well plate) in a 0.1 mL complete medium with 1 μg/mL puromycin with designated soluble antibody treatments. After overnight culturing, GFP positive populations were read using an iQue3 high throughput flow cytometer (Sartorius) with at least 10,000 live cells collected.
Preparation of oAβ-lipoprotein complexes
L-α-phosphatidylserine (PS) and 1,2-dimyristoyl-sn-glycero-3-phosphocholine (DMPC) were purchased from Avanti Polar Lipids as powder. PS and DMPC were dissolved in chloroform at 10 mg/mL and mixed at a ratio of 1:4 (PC: DMPC). Chloroform was evaporated under vacuum and formed a thin layer containing a mixture of PS and DMPC. DPBS was added to rehydrate the lipid mixture to 5 mg/mL, and the liposomes were formed by sonication on ice until the solution became translucent. To prepare oAβ-lipoprotein complexes, PS/DMPC liposomes and APOE3 were mixed at final concentrations of 1 mg/mL for PS/DMPC liposomes and 0.25 mg/mL for human APOE3. The mixture was incubated at 18°C for 15 min and 30°C for 15 min for 3 cycles.Citation85 The FAM-labeled oAβ was then added to the lapidated APOE at a final concentration of 1 μM and incubated at RT for 1 hour.
Microglia phagocytosis assay
HMGLs were prepared as previously described.Citation28 For phagocytosis experiments, microglia were seeded in a poly-D-lysine coated 96-well plate in RMPI-1640 without serum or cytokines. oAβ-lipoprotein complex was diluted to a concentration equivalent to 100 nM FAM-oAβ with 1% BSA. The medium in the cell culture plate was replaced with the diluted oAβ-lipoprotein complex and incubated at 37°C for 2 hours. After phagocytosis, cells were detached by trypsin for 5 min, and cell surface-bound FAM-oAβ was quenched by adding trypan blue to 0.2% and incubated for 5 min. The cells were then transferred into a V-bottom 96-well plate and washed twice by 350 g 5 min centrifugation. With CytoD treatment, 10 μM CytoD was pre-incubated with cells for 30 min at 37°C and constantly present during the phagocytosis experiment. The phagocytosis was quantified using an iQue3 high throughput flow cytometer (Sartorius).
Microglia migration in Transwell assays
Human ESC line (H9)-derived hMGLs were prepared as previously described.Citation28 Cells were seeded in a Transwell insert (PET membrane, 8 µm pore size, Corning 3374) in basic culture media (DMEM/F12, insulin 0.02 mg/mL, holo-transferrin 0.01 mg/mL, sodium selenite 13.4 µg/mL, B27 2% v/v, N2, 0.5% v/v, monothioglycerol 0.2 mM, glutamax 1x, and NEAA 1x) without serum or cytokines. Corresponding treatments were added into both the migration and receiver chambers at designated concentrations. Only the receiver (bottom) chambers contain a 0.5 µM oAβ-lipid complex. Cells were cultured for 24 hours at 37°C with 5% CO2. After incubation, the cells were washed three times with DPBS, fixed in 4% PFA for 10 min, and then stained with 0.05% crystal violet for 10 min. Unbound crystal violet was removed by washing with DPBS, and the plate was allowed to air-dry. Cell number was quantified by eluting cell-bound crystal violet in 33% acetic acid in H2O (100 rpm shaking, 10 min) according to the manufacturer’s protocol and literature.Citation86 The amount of crystal violet was quantified by measuring absorbance at 590 nm using a plate reader. For quantifying migrated cells, unmigrated cells that remain inside the Transwell insert were removed using moistened cotton swabs. Migration percentage was calculated by dividing OD values of migrated cells over OD values of total cells. For imaging microglia migration, the assay was conducted similarly, except that the microglia cells were pre-labeled with 1 μM CFSE (Thermo) for 15 min at 37°C. The migrated cells were imaged using Nikon Eclipse TE2000E Widefield Fluorescence Microscope.
Efficacy studies in 5XFAD mice
The goal of this study was to establish evidence in transgenic mouse models of AD that activation of TREM2 signaling by engineered antibodies could modify microglia-amyloid interactions in mouse brains. The 5XFAD mice were obtained from the Jackson Laboratory (Bar Harbor, ME). Mice were housed 4–5 mice per cage in a pathogen-free mouse facility with ad libitum access to food and water on a 12 hr light/dark cycle. Female mice were used for all experiments under the consideration that female mice are less aggressive to handling.
The animal experiments were conducted according to the institutional guidelines with approved protocols. 5XFAD mice (B6. Cg-Tg(APPSwFlLon, PSEN1*M146L*L286V)6799Vas/Mmjax, female, 8-week-old, MMRRC) were purchased and randomly grouped into five mice per group. Microglia implantation experiments started when the mice reached 5-mo-old age. To implant the microglia, 2 × 10⁵ hMGLs were injected into the bilateral ventricles under anesthesia. Stereotaxic injection of microglia (2 µL on each side) was delivered through a Neuro syringe (Hamilton 1701 RN) into the lateral ventricles at a controlled speed of 0.5 µL/min. The treatment was delivered on the same day immediately after the microglia implantation by IP injection at 20 mg/kg in 0.2 mL PBS. The mice were sacrificed 4 days after injection, and the brain tissues were processed as described above for immunofluorescent staining or biochemical analysis.
Statistical analysis
GraphPad Prism (v8, GraphPad Software) was used to generate plots and perform statistical analysis. Data were presented as means ± SD (** P < .001, *** P < .0001, and ns = not statistically different). Student’s t-test was used for comparisons between two different groups. For comparisons among multiple groups, analysis of variance (ANOVA) followed by appropriate post hoc testing was used and is specified for each experiment in the figure legends. All samples or animals were included in the statistical analysis unless otherwise specified.
Authors’ contributions
Conceptualization, PZ, NZ, ZA; Methodology, PZ, YX, XF, LL, XL; Resources, NZ, ZA, HA, QT; writing, NZ, ZA, PZ; Supervision, NZ, ZA; Project administration, NZ, ZA; Funding acquisition, NZ, ZA. All authors read and approved the final manuscript.
Data availability
The datasets used and/or analyzed during the current study are available from the corresponding author on reasonable request.
Supplemental Material
Download MS Word (279.3 KB)Acknowledgments
We thank the Fluorescence Core and Dr Zhengmei Mao at the UTHealth at Houston for the confocal microscope instrument and relevant training. We thank Dr Hui Zheng from Baylor College of Medicine for discussing the design of experiments in 5XFAD models.
Disclosure statement
The University of Texas System has filed a patent application on the TfR and TREM2 targeting antibodies and PZ, NZ, and ZA are named inventors of the patent application.
Supplementary material
Supplemental data for this article can be accessed online at https://doi.org/10.1080/19420862.2022.2107971
Additional information
Funding
References
- Bondi MW, Edmonds EC, Salmon DP. Alzheimer’s disease: past, present, and future. J Int Neuropsychol Soc. 2017;23:818–17. doi:10.1017/S135561771700100X.
- Long JM, Holtzman DM. Alzheimer disease: an update on pathobiology and treatment strategies. Cell. 2019;179:312–39. doi:10.1016/j.cell.2019.09.001.
- Holtzman DM, Morris JC, Goate AM. Alzheimer’s disease: the challenge of the second century. Sci Transl Med. 2011;3:77sr1–sr1. doi:10.1126/scitranslmed.3002369.
- Lee CY, Landreth GE. The role of microglia in amyloid clearance from the AD brain. J Neural Transm. 2010;117:949–60. doi:10.1007/s00702-010-0433-4.
- Sarlus H, Heneka MT. Microglia in Alzheimer’s disease. J Clin Invest. 2017;127:3240–49. doi:10.1172/JCI90606.
- van Dyck CH. Anti-amyloid-β monoclonal antibodies for Alzheimer’s disease: pitfalls and promise. Biol Psychiatry. 2018;83:311–19. doi:10.1016/j.biopsych.2017.08.010.
- Bohrmann B, Baumann K, Benz J, Gerber F, Huber W, Knoflach F, Messer J, Oroszlan K, Rauchenberger R, Richter WF, et al. Gantenerumab: a novel human anti-Aβ antibody demonstrates sustained cerebral amyloid-β binding and elicits cell-mediated removal of human amyloid-β. J Alzheimer’s Dis. 2012;28:49–69. doi:10.3233/JAD-2011-110977.
- Sevigny J, Chiao P, Bussière T, Weinreb PH, Williams L, Maier M, Dunstan R, Salloway S, Chen T, Ling Y, et al. The antibody aducanumab reduces Aβ plaques in Alzheimer’s disease. Nature. 2016;537:50–56. doi:10.1038/nature19323.
- Bard F, Cannon C, Barbour R, Burke R-L, Games D, Grajeda H, Guido T, Hu K, Huang J, Johnson-Wood K, et al. Peripherally administered antibodies against amyloid β-peptide enter the central nervous system and reduce pathology in a mouse model of Alzheimer disease. Nat Med. 2000;6:916–19. doi:10.1038/78682.
- Guerreiro R, Wojtas A, Bras J, Carrasquillo M, Rogaeva E, Majounie E, Cruchaga C, Sassi C, Kauwe JS, Younkin S, et al. TREM2 variants in Alzheimer’s disease. N Engl J Med. 2013;368:117–27. doi:10.1056/NEJMoa1211851.
- Ulland TK, Colonna M. TREM2 - a key player in microglial biology and Alzheimer disease. Nat Rev Neurol. 2018;14:667–75. doi:10.1038/s41582-018-0072-1.
- Zhao Y, Wu X, Li X, Jiang LL, Gui X, Liu Y, Sun Y, Zhu B, Piña-Crespo JC, Zhang M, et al. TREM2 is a receptor for β-amyloid that mediates microglial function. Neuron. 2018;97:1023–31.e7. doi:10.1016/j.neuron.2018.01.031.
- Wang Y, Cella M, Mallinson K, Ulrich JD, Young KL, Robinette ML, Gilfillan S, Krishnan GM, Sudhakar S, Zinselmeyer BH, et al. TREM2 lipid sensing sustains the microglial response in an Alzheimer’s disease model. Cell. 2015;160:1061–71. doi:10.1016/j.cell.2015.01.049.
- Krasemann S, Madore C, Cialic R, Baufeld C, Calcagno N, El Fatimy R, Beckers L, O’Loughlin E, Xu Y, Fanek Z, et al. The TREM2-APOE pathway drives the transcriptional phenotype of dysfunctional microglia in neurodegenerative diseases. Immunity. 2017;47:566–81.e9. doi:10.1016/j.immuni.2017.08.008.
- Jay TR, Miller CM, Cheng PJ, Graham LC, Bemiller S, Broihier ML, Xu G, Margevicius D, Karlo JC, Sousa GL, et al. TREM2 deficiency eliminates TREM2+ inflammatory macrophages and ameliorates pathology in Alzheimer’s disease mouse models. J Exp Med. 2015;212:287–95. doi:10.1084/jem.20142322.
- Deczkowska A, Weiner A, Amit I. The physiology, pathology, and potential therapeutic applications of the TREM2 signaling pathway. Cell. 2020;181:1207–17. doi:10.1016/j.cell.2020.05.003.
- Lee CYD, Daggett A, Gu X, Jiang LL, Langfelder P, Li X, Wang N, Zhao Y, Park CS, Cooper Y, et al. Elevated TREM2 gene dosage reprograms microglia responsivity and ameliorates pathological phenotypes in Alzheimer’s disease models. Neuron. 2018;97:1032–48.e5. doi:10.1016/j.neuron.2018.02.002.
- Schlepckow K, Monroe KM, Kleinberger G, Cantuti-Castelvetri L, Parhizkar S, Xia D, Willem M, Werner G, Pettkus N, Brunner B, et al. Enhancing protective microglial activities with a dual function TREM2 antibody to the stalk region. EMBO Mol Med. 2020;12:e11227. doi:10.15252/emmm.201911227.
- Cheng Q, Danao J, Talreja S, Wen P, Yin J, Sun N, Li CM, Chui D, Tran D, Koirala S, et al. TREM2-activating antibodies abrogate the negative pleiotropic effects of the Alzheimer’s disease variant Trem2(R47H) on murine myeloid cell function. J Biol Chem. 2018;293:12620–33. doi:10.1074/jbc.RA118.001848.
- Wang S, Mustafa M, Yuede CM, Salazar SV, Kong P, Long H, Ward M, Siddiqui O, Paul R, Gilfillan S, et al. Anti-human TREM2 induces microglia proliferation and reduces pathology in an Alzheimer’s disease model. J Exp Med. 2020;217. doi:10.1084/jem.20200785
- Fassler M, Rappaport MS, Cuño CB, George J. Engagement of TREM2 by a novel monoclonal antibody induces activation of microglia and improves cognitive function in Alzheimer’s disease models. J Neuroinflammation. 2021;18:19. doi:10.1186/s12974-020-01980-5.
- Price BR, Sudduth TL, Weekman EM, Johnson S, Hawthorne D, Woolums A, Wilcock DM. Therapeutic Trem2 activation ameliorates amyloid-beta deposition and improves cognition in the 5XFAD model of amyloid deposition. J Neuroinflammation. 2020;17:238. doi:10.1186/s12974-020-01915-0.
- Wang X, Mathieu M, Brezski RJ. IgG Fc engineering to modulate antibody effector functions. Protein Cell. 2018;9:63–73. doi:10.1007/s13238-017-0473-8.
- Song W, Hooli B, Mullin K, Jin SC, Cella M, Ulland TK, Wang Y, Tanzi RE, Colonna M. Alzheimer’s disease-associated TREM2 variants exhibit either decreased or increased ligand-dependent activation. Alzheimer’s Dementia. 2017;13:381–87. doi:10.1016/j.jalz.2016.07.004.
- Ohtsuka M, Arase H, Takeuchi A, Yamasaki S, Shiina R, Suenaga T, Sakurai D, Yokosuka T, Arase N, Iwashima M, et al. NFAM1, an immunoreceptor tyrosine-based activation motif-bearing molecule that regulates B cell development and signaling. Proc Natl Acad Sci U S A. 2004;101:8126–31. doi:10.1073/pnas.0401119101.
- Yeh FL, Wang Y, Tom I, Gonzalez LC, Sheng M. TREM2 binds to apolipoproteins, including APOE and CLU/APOJ, and thereby facilitates uptake of amyloid-beta by microglia. Neuron. 2016;91:328–40. doi:10.1016/j.neuron.2016.06.015.
- Abud EM, Ramirez RN, Martinez ES, Healy LM, Nguyen CHH, Newman SA, Yeromin AV, Scarfone VM, Marsh SE, Fimbres C, et al. iPSC-Derived human microglia-like cells to study neurological diseases. Neuron. 2017;94:278–93.e9. doi:10.1016/j.neuron.2017.03.042.
- Liu T, Zhu B, Liu Y, Zhang X, Yin J, Li X, Jiang L, Hodges AP, Rosenthal SB, Zhou L, et al. Multi-omic comparison of Alzheimer’s variants in human ESC-derived microglia reveals convergence at APOE. J Exp Med. 2020;217. doi:10.1084/jem.20200474
- Pardridge WM. Drug transport across the blood–brain barrier. J Cerebral Blood Flow Metab. 2012;32:1959–72. doi:10.1038/jcbfm.2012.126.
- Yang Y, Yeh SH, Madireddi S, Matochko WL, Gu C, Pacheco Sanchez P, Ultsch M, De Leon Boenig G, Harris SF, Leonard B, et al. Tetravalent biepitopic targeting enables intrinsic antibody agonism of tumor necrosis factor receptor superfamily members. mAbs. 2019;11:996–1011. doi:10.1080/19420862.2019.1625662.
- Schanzer J, Jekle A, Nezu J, Lochner A, Croasdale R, Dioszegi M, Zhang J, Hoffmann E, Dormeyer W, Stracke J, et al. Development of tetravalent, bispecific CCR5 antibodies with antiviral activity against CCR5 monoclonal antibody-resistant HIV-1 strains. Antimicrob Agents Chemother. 2011;55:2369–78. doi:10.1128/AAC.00215-10.
- Brünker P, Wartha K, Friess T, Grau-Richards S, Waldhauer I, Koller CF, Weiser B, Majety M, Runza V, Niu H, et al. RG7386, a novel tetravalent FAP-DR5 antibody, effectively triggers FAP-dependent, avidity-driven dr5 hyperclustering and tumor cell apoptosis. Mol Cancer Ther. 2016;15:946–57. doi:10.1158/1535-7163.MCT-15-0647.
- Peng Q, Malhotra S, Torchia James A, Kerr William G, Coggeshall KM, Humphrey Mary B. TREM2- and DAP12-Dependent activation of PI3K requires DAP10 and is inhibited by SHIP1. Sci Signal. 2010;3:ra38–ra. doi:10.1126/scisignal.2000500.
- Zhong L, Xu Y, Zhuo R, Wang T, Wang K, Huang R, Wang D, Gao Y, Zhu Y, Sheng X, et al. Soluble TREM2 ameliorates pathological phenotypes by modulating microglial functions in an Alzheimer’s disease model. Nat Commun. 2019;10:1365. doi:10.1038/s41467-019-09118-9.
- Ulrich JD, Ulland TK, Colonna M, Holtzman DM. Elucidating the role of TREM2 in Alzheimer’s Disease. Neuron. 2017;94:237–48. doi:10.1016/j.neuron.2017.02.042.
- Blank U, Launay P, Benhamou M, Monteiro RC. Inhibitory ITAMs as novel regulators of immunity. Immunol Rev. 2009;232:59–71. doi:10.1111/j.1600-065X.2009.00832.x.
- Suárez-Calvet M, Morenas-Rodríguez E, Kleinberger G, Schlepckow K, Araque Caballero MÁ, Franzmeier N, Capell A, Fellerer K, Nuscher B, Eren E, et al. Early increase of CSF sTREM2 in Alzheimer’s disease is associated with tau related-neurodegeneration but not with amyloid-β pathology. Mol Neurodegener. 2019;14:1. doi:10.1186/s13024-018-0301-5.
- Vilalta A, Zhou Y, Sevalle J, Griffin JK, Satoh K, Allendorf DH, De S, Puigdellívol M, Bruzas A, Burguillos MA, et al. Wild-type sTREM2 blocks Aβ aggregation and neurotoxicity, but the Alzheimer’s R47H mutant increases Aβ aggregation. J Biol Chemistry. 2021;296. doi:10.1016/j.jbc.2021.100631
- Banks WA. From blood-brain barrier to blood-brain interface: new opportunities for CNS drug delivery. Nat Rev Drug Discov. 2016;15:275–92. doi:10.1038/nrd.2015.21.
- Kariolis MS, Wells RC, Getz JA, Kwan W, Mahon CS, Tong R, Kim DJ, Srivastava A, Bedard C, Henne KR, et al. Brain delivery of therapeutic proteins using an Fc fragment blood-brain barrier transport vehicle in mice and monkeys. Sci Transl Med. 2020;12(545):eaay1359.
- Yu YJ, Atwal JK, Zhang Y, Tong RK, Wildsmith KR, Tan C, Bien-Ly N, Hersom M, Maloney JA, Meilandt WJ, et al. Therapeutic bispecific antibodies cross the blood-brain barrier in nonhuman primates. Sci Transl Med. 2014;6:261ra154. doi:10.1126/scitranslmed.3009835.
- Yu YJ, Zhang Y, Kenrick M, Hoyte K, Luk W, Lu Y, Atwal J, Elliott JM, Prabhu S, Watts RJ, et al. Boosting brain uptake of a therapeutic antibody by reducing its affinity for a transcytosis target. Sci Transl Med. 2011;3:84ra44. doi:10.1126/scitranslmed.3002230.
- Zhao P, Anami Y, Gao P, Fan X, Li L, Tsuchikama K, Zhang N, An Z. Enhanced anti-angiogenetic effect of transferrin receptor-mediated delivery of VEGF-trap in a glioblastoma mouse model. mAbs. 2022;14:2057269. doi:10.1080/19420862.2022.2057269.
- Niewoehner J, Bohrmann B, Collin L, Urich E, Sade H, Maier P, Rueger P, Stracke JO, Lau W, Tissot AC, et al. Increased brain penetration and potency of a therapeutic antibody using a monovalent molecular shuttle. Neuron. 2014;81:49–60. doi:10.1016/j.neuron.2013.10.061.
- Merchant AM, Zhu Z, Yuan JQ, Goddard A, Adams CW, Presta LG, Carter P. An efficient route to human bispecific IgG. Nat Biotechnol. 1998;16:677–81. doi:10.1038/nbt0798-677.
- Schlothauer T, Herter S, Koller CF, Grau-Richards S, Steinhart V, Spick C, Kubbies M, Klein C, Umaña P, Mössner E. Novel human IgG1 and IgG4 Fc-engineered antibodies with completely abolished immune effector functions. Protein Eng Design Selection. 2016;29:457–66. doi:10.1093/protein/gzw040.
- Forner S, Kawauchi S, Balderrama-Gutierrez G, Kramár EA, Matheos DP, Phan J, Javonillo DI, Tran KM, Hingco E, da Cunha C, et al. Systematic phenotyping and characterization of the 5xFAD mouse model of Alzheimer’s disease. Scientific Data. 2021;8:270. doi:10.1038/s41597-021-01054-y.
- Ghosh A, Comerota MM, Wan D, Chen F, Propson NE, Hwang SH, Hammock BD, Zheng H. An epoxide hydrolase inhibitor reduces neuroinflammation in a mouse model of Alzheimer’s disease. Sci Transl Med. 2020;12(573):eabb1206.
- Svoboda DS, Barrasa MI, Shu J, Rietjens R, Zhang S, Mitalipova M, Berube P, Fu D, Shultz LD, Bell GW, et al. Human iPSC-derived microglia assume a primary microglia-like state after transplantation into the neonatal mouse brain. Proc Natl Acad Sci U S A. 2019;116:25293–303. doi:10.1073/pnas.1913541116.
- Pandya H, Shen MJ, Ichikawa DM, Sedlock AB, Choi Y, Johnson KR, Kim G, Brown MA, Elkahloun AG, Maric D, et al. Differentiation of human and murine induced pluripotent stem cells to microglia-like cells. Nat Neurosci. 2017;20:753–59. doi:10.1038/nn.4534.
- Barar J, Rafi MA, Pourseif MM, Omidi Y. Blood-brain barrier transport machineries and targeted therapy of brain diseases. Bioimpacts. 2016;6(4):225–48. doi:10.15171/bi.2016.30. Epub 2016 Dec 5. PMID: 28265539; PMCID: PMC5326671.
- Dardiotis E, Siokas V, Pantazi E, Dardioti M, Rikos D, Xiromerisiou G, Markou A, Papadimitriou D, Speletas M, Hadjigeorgiou GM. A novel mutation in TREM2 gene causing Nasu-Hakola disease and review of the literature. Neurobiol Aging. 2017;53:194.e13–.e22. doi:10.1016/j.neurobiolaging.2017.01.015.
- Deng M, Gui X, Kim J, Xie L, Chen W, Li Z, He L, Chen Y, Chen H, Luo W, et al. LILRB4 signalling in leukaemia cells mediates T cell suppression and tumour infiltration. Nature. 2018;562:605–09. doi:10.1038/s41586-018-0615-z.
- Stewart R, Hammond SA, Oberst M, Wilkinson RW. The role of Fc gamma receptors in the activity of immunomodulatory antibodies for cancer. J ImmunoTherapy of Cancer. 2014;2:29. doi:10.1186/s40425-014-0029-x.
- Lo Nigro C, Macagno M, Sangiolo D, Bertolaccini L, Aglietta M, Merlano MC. NK-mediated antibody-dependent cell-mediated cytotoxicity in solid tumors: biological evidence and clinical perspectives. Ann Translational Med. 2019;7:105. doi:10.21037/atm.2019.01.42.
- Paloneva J, Mandelin J, Kiialainen A, Bohling T, Prudlo J, Hakola P, Haltia M, Konttinen YT, Peltonen L. DAP12/TREM2 deficiency results in impaired osteoclast differentiation and osteoporotic features. J Exp Med. 2003;198:669–75. doi:10.1084/jem.20030027.
- Guilliams M, Bruhns P, Saeys Y, Hammad H, Lambrecht BN. The function of Fcγ receptors in dendritic cells and macrophages. Nat Rev Immunol. 2014;14:94–108. doi:10.1038/nri3582.
- Maeda A, Kurosaki M, Ono M, Takai T, Kurosaki T. Requirement of SH2-containing protein tyrosine phosphatases SHP-1 and SHP-2 for paired immunoglobulin-like receptor B (PIR-B)-mediated inhibitory signal. J Exp Med. 1998;187:1355–60. doi:10.1084/jem.187.8.1355.
- Kiskis J, Fink H, Nyberg L, Thyr J, Li J-Y, Enejder A. Plaque-associated lipids in Alzheimer’s diseased brain tissue visualized by nonlinear microscopy. Sci Rep. 2015;5:13489. doi:10.1038/srep13489.
- Parhizkar S, Arzberger T, Brendel M, Kleinberger G, Deussing M, Focke C, Nuscher B, Xiong M, Ghasemigharagoz A, Katzmarski N, et al. Loss of TREM2 function increases amyloid seeding but reduces plaque-associated ApoE. Nat Neurosci. 2019;22:191–204. doi:10.1038/s41593-018-0296-9.
- Liao CR, Rak M, Lund J, Unger M, Platt E, Albensi BC, Hirschmugl CJ, Gough KM. Synchrotron FTIR reveals lipid around and within amyloid plaques in transgenic mice and Alzheimer’s disease brain. Analyst. 2013;138:3991–97. doi:10.1039/c3an00295k.
- Namba Y, Tomonaga M, Kawasaki H, Otomo E, Ikeda K. Apolipoprotein E immunoreactivity in cerebral amyloid deposits and neurofibrillary tangles in Alzheimer’s disease and kuru plaque amyloid in Creutzfeldt-Jakob disease. Brain Res. 1991;541:163–66. doi:10.1016/0006-8993(91)91092-F.
- Xiong F, Ge W, Ma C. Quantitative proteomics reveals distinct composition of amyloid plaques in Alzheimer’s disease. Alzheimer’s Dementia. 2019;15:429–40. doi:10.1016/j.jalz.2018.10.006.
- Martins IC, Kuperstein I, Wilkinson H, Maes E, Vanbrabant M, Jonckheere W, Van Gelder P, Hartmann D, D’Hooge R, De Strooper B, et al. Lipids revert inert Abeta amyloid fibrils to neurotoxic protofibrils that affect learning in mice. EMBO J. 2008;27:224–33. doi:10.1038/sj.emboj.7601953.
- Castellano JM, Kim J, Stewart FR, Jiang H, DeMattos RB, Patterson BW, Fagan AM, Morris JC, Mawuenyega KG, Cruchaga C, et al. Human apoE isoforms differentially regulate brain amyloid-β peptide clearance. Sci Transl Med. 2011;3:89ra57. doi:10.1126/scitranslmed.3002156.
- Liu CC, Liu CC, Kanekiyo T, Xu H, Bu G. Apolipoprotein E and Alzheimer disease: risk, mechanisms and therapy. Nat Rev Neurol. 2013;9:106–18. doi:10.1038/nrneurol.2012.263.
- Liu CC, Zhao N, Fu Y, Wang N, Linares C, Tsai CW, Bu G. ApoE4 accelerates early seeding of amyloid pathology. Neuron. 2017;96:1024–32.e3. doi:10.1016/j.neuron.2017.11.013.
- Spangenberg E, Severson PL, Hohsfield LA, Crapser J, Zhang J, Burton EA, Zhang Y, Spevak W, Lin J, Phan NY, et al. Sustained microglial depletion with CSF1R inhibitor impairs parenchymal plaque development in an Alzheimer’s disease model. Nat Commun. 2019;10:3758. doi:10.1038/s41467-019-11674-z.
- Li JY, Perry SR, Muniz-Medina V, Wang X, Wetzel LK, Rebelatto MC, Hinrichs MJ, Bezabeh BZ, Fleming RL, Dimasi N, et al. A biparatopic HER2-targeting antibody-drug conjugate induces tumor regression in primary models refractory to or ineligible for HER2-targeted therapy. Cancer Cell. 2016;29:117–29. doi:10.1016/j.ccell.2015.12.008.
- Oganesyan V, Peng L, Bee JS, Li J, Perry SR, Comer F, Xu L, Cook K, Senthil K, Clarke L, et al. Structural insights into the mechanism of action of a biparatopic anti-HER2 antibody. J Biol Chem. 2018;293:8439–48. doi:10.1074/jbc.M117.818013.
- Boado RJ, Zhang Y, Zhang Y, C-f X, Wang Y, Pardridge WM. Genetic engineering of a lysosomal enzyme fusion protein for targeted delivery across the human blood-brain barrier. Biotechnol Bioeng. 2008;99:475–84. doi:10.1002/bit.21602.
- Boado RJ, Pardridge WM. Brain and organ uptake in the rhesus monkey in vivo of recombinant iduronidase compared to an insulin receptor antibody-iduronidase fusion protein. Mol Pharm. 2017;14:1271–77. doi:10.1021/acs.molpharmaceut.6b01166.
- Giugliani R, Giugliani L, de Oliveira Poswar F, Donis KC, Corte AD, Schmidt M, Boado RJ, Nestrasil I, Nguyen C, Chen S, et al. Neurocognitive and somatic stabilization in pediatric patients with severe mucopolysaccharidosis type I after 52 weeks of intravenous brain-penetrating insulin receptor antibody-iduronidase fusion protein (valanafusp alpha): an open label phase 1-2 trial. Orphanet J Rare Dis. 2018;13:110. doi:10.1186/s13023-018-0849-8.
- Pardridge WM, Boado RJ, Giugliani R, Schmidt M. Plasma pharmacokinetics of valanafusp alpha, a human insulin receptor antibody-iduronidase fusion protein, in patients with mucopolysaccharidosis type I. BioDrugs. 2018;32:169–76. doi:10.1007/s40259-018-0264-7.
- Boado RJ, Lu JZ, Hui EK, Pardridge WM. IgG-single chain Fv fusion protein therapeutic for Alzheimer’s disease: expression in CHO cells and pharmacokinetics and brain delivery in the rhesus monkey. Biotechnol Bioeng. 2010;105:627–35. doi:10.1002/bit.22576.
- Boado RJ, Zhang Y, Zhang Y, Xia C-F, Pardridge WM. Fusion antibody for Alzheimer’s disease with bidirectional transport across the blood-brain barrier and abeta fibril disaggregation. Bioconjug Chem. 2007;18:447–55. doi:10.1021/bc060349x.
- Logan T, Simon MJ, Rana A, Cherf GM, Srivastava A, Davis SS, Low RLY, Chiu C-L, Fang M, Huang F, et al. Rescue of a lysosomal storage disorder caused by Grn loss of function with a brain penetrant progranulin biologic. Cell. 2021;184:4651–68.e25. doi:10.1016/j.cell.2021.08.002.
- Marsh SE, Abud EM, Lakatos A, Karimzadeh A, Yeung ST, Davtyan H, Fote GM, Lau L, Weinger JG, Lane TE, et al. The adaptive immune system restrains Alzheimer’s disease pathogenesis by modulating microglial function. Proc National Academy Sci. 2016;113:E1316–E25. doi:10.1073/pnas.1525466113.
- Cherry JD, Olschowka JA, O’Banion MK. Neuroinflammation and M2 microglia: the good, the bad, and the inflamed. J Neuroinflammation. 2014;11:98. doi:10.1186/1742-2094-11-98.
- Ransohoff RM. A polarizing question: do M1 and M2 microglia exist? Nat Neurosci. 2016;19:987–91. doi:10.1038/nn.4338.
- Zhao S, Zhu Y, Schultz RD, Li N, He Z, Zhang Z, Caron A, Zhu Q, Sun K, Xiong W, et al. Partial leptin reduction as an insulin sensitization and weight loss strategy. Cell Metab. 2019;30:706–19.e6. doi:10.1016/j.cmet.2019.08.005.
- Shihan MH, Novo SG, Le Marchand SJ, Wang Y, Duncan MK. A simple method for quantitating confocal fluorescent images. Biochemistry Biophysics Rep. 2021;25:100916. doi:10.1016/j.bbrep.2021.100916.
- Zhong L, Wang Z, Wang D, Wang Z, Martens YA, Wu L, Xu Y, Wang K, Li J, Huang R, et al. Amyloid-beta modulates microglial responses by binding to the triggering receptor expressed on myeloid cells 2 (TREM2). Mol Neurodegener. 2018;13:15. doi:10.1186/s13024-018-0247-7.
- Chen H-M, van der Touw W, Wang YS, Kang K, Mai S, Zhang J, Alsina-Beauchamp D, Duty JA, Mungamuri SK, Zhang B, et al. Blocking immunoinhibitory receptor LILRB2 reprograms tumor-associated myeloid cells and promotes antitumor immunity. J Clin Invest. 2018;128:5647–62. doi:10.1172/JCI97570.
- Hubin E, Verghese PB, van Nuland N, Broersen K. Apolipoprotein E associated with reconstituted high-density lipoprotein-like particles is protected from aggregation. FEBS Lett. 2019;593:1144–53. doi:10.1002/1873-3468.13428.
- Moore CS, Ase AR, Kinsara A, Rao VT, Michell-Robinson M, Leong SY, Butovsky O, Ludwin SK, Séguéla P, Bar-Or A, et al. P2Y12 expression and function in alternatively activated human microglia. Neurology Neuroimmunol Neuroinflammation. 2015;2:e80. doi:10.1212/NXI.0000000000000080.