
ABSTRACT
The α-Gal epitope consisting of the terminal trisaccharide Galα1,3Galβ1,4GlcNAc exposed on cell or protein surfaces can cause severe immune reactions, such as hypersensitivity reactions, in humans. This epitope is also called the xenotransplantation epitope because it is one of the main reasons for the rejection of non-human organ transplants by the human innate immune response. Recombinant therapeutic proteins expressed in murine cell lines may contain α-Gal epitopes, and therefore their absence or presence needs to be tightly monitored to minimize any undesired adverse effects. The analytical identification of α-Gal epitopes in glycoproteins using the common standard techniques based on liquid chromatography and mass spectrometry is challenging, mainly due to the isobaricity of hexose stereoisomers. Here, we present a straightforward NMR approach to detect the presence of α-Gal in biotherapeutics based on a quick screen with sensitive 1H-1H TOCSY spectra followed by a confirmation using 1H-13C HSQC spectra.
Abbreviations: α-Gal: α1,3-linked galactose; AGC: automatic gain control; CHO: Chinese hamster ovary; CE: capillary electrophoreses coupled to mass spectrometry; COSY: correlation spectroscopy; DSS: 2,2-dimethyl-2-silapentane-5-sulfonate; DTT: dithiothreitol; GlcNAc: N-acetyl glusomamine; HCD: higher-energy collisional dissociation; HMBC: heteronuclear multiple-bond correlation; HPLC: high-performance liquid chromatography; HSQC: heteronuclear single-quantum corre; LacNAc: N-acetyl lactosamine; mAb: monoclonal antibody; MS: mass spectrometry; NMR: nuclear magnetic resonance; NOESY: 2D) nuclear Overhauser spectroscopy; PEG: polyethylenglycol; pH*: observed pH meter reading without correction for isotope effects; PTM: post-translational modification; TCEP: tris(2-carboxyethyl) phosphine hydrochloride; TOCSY: total correlation spectroscopy; xCGE-LIF: multiplex capillary gel electrophoresis with laser-induced fluorescence detection.
Introduction
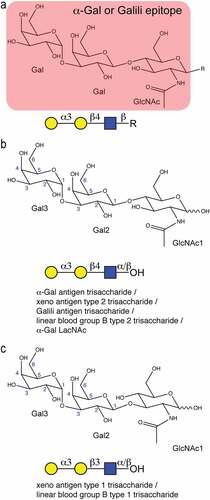
Comprising ~1% of all immunoglobulins, human antibodies that recognize the α-Gal epitope consisting of the terminal carbohydrate Galα1,3Galβ1,4GlcNAcCitation1,Citation2 () are the most abundant. The α-Gal epitope, sometimes also called the Galili epitope, is abundantly expressed on glycoconjugates of most mammals. However, α-Gal is absent in glycoconjugates of humans, apes and Old World monkeys, because they lack an active glycosyltransferase, the UDP-Gal: β-galactosyl α1,3galactosyltransferase, EC 2.4.1.151 (α1,3GT). This loss was estimated to have occurred less than 28 million years ago in common ancestors.Citation1 Instead, these latter mammals produce large quantities of anti-Gal antibodies that specifically recognize the α-Gal epitope. It is hypothesized that these antibodies are part of an innate immune response against zoonotic viruses and protozoa, e.g., Trypanosoma, Plasmodium or Leishmania.Citation3
Figure 1. Chemical and symbolic structures of the α-Gal epitope and the investigated trisaccharides. (a) chemical structure of the α-Gal epitope Galα1,3Galβ1,4GlcNAc that can be attached to any underlying glycan or glycolipid. The symbol presentation of the same trisaccharide is shown below. (b) structure of the investigated α-Gal trisaccharide Galα1,3Galβ1,4GlcNAc with a free reducing end containing a mixture of α- and β-anomers of the first GlcNAc moiety. (c) structure of the studied xeno antigen type 1 trisaccharide Galα1,3Galβ1,3GlcNAc with a free reducing end containing a mixture of α- and β-anomers.
In humans, these anti-Gal antibodies are responsible for the rejection of non-human organ transplants containing the α-Gal epitope, e.g., organs grown in pigs, which induce complement destruction of the organ within minutes to hours.Citation1 The absence of immunogenic epitopes, which can cause undesired immune reactions like hypersensitivity reactions,Citation4 is highly preferred for therapeutic proteins. However, the presence of immunogenic epitopes cannot be totally avoided in all cases, and therefore the exact nature and quantity of these epitopes must be tightly monitored. Many monoclonal antibodies (mAbs) are produced in non-primate mammalian cell lines, which contain the machinery to express α-Gal epitopes and do typically express them.Citation5 In particular, antibodies produced by mouse cell lines such as NS0 or SP2/0 often contain α-Gal epitopes. Despite reports that Chinese hamster ovary (CHO) cell lines typically do not express the α1,3GT, and thus lack α-Gal epitopes,Citation1 certain CHO cells produce α-Gal epitopes under certain conditions.Citation6,Citation7 In addition to the immunogenicity, the in vivo half-life of antibodies containing α-Gal epitopes in the human body is significantly reduced.Citation8
Confirming the absence or presence of α-Gal epitopes in therapeutic proteins by the classical proteomics approach of mass spectrometry (MS) coupled to high-performance liquid chromatography (HPLC) is analytically challenging because the difference between an N-glycan containing Galα1,3Gal and one lacking it lies in the mass difference of one or several hexose moieties (n × 162 Da), which may be galactose, mannose or glucose. More importantly, the key characteristic for immunogenicity is the α1,3 linkage between the terminal galactose and the underlying galactose.Citation9 One possibility to confirm this is the analysis by porous graphitized carbon-liquid chromatography coupled to tandem MS (PGC-MS2).Citation10 However, the sample preparation and data analysis are very elaborate. Treatment with α1,3Gal-specific glycosidases followed by MS is another possibility, but this method is indirect.
Orthogonal methods are desirable for cross-validation of the current analytical methods for α-Gal detection as a critical quality attribute of biopharmaceuticals. Nuclear magnetic resonance (NMR) spectroscopy is a promising tool that has been of limited use in the context of biotherapeutics due to the large molecular sizes, in particular of mAbs, mAb-conjugates or Fc-chimera. This obstacle has been overcome by investigating fully denatured proteins, whose backbone tumbles similarly to a peptide or a small protein, resulting in sufficiently sharp NMR signals of all entities in the protein including post-translational modifications (PTMs) e.g., glycans.11 1H-13C chemical shift correlations that are unique for a certain PTM, such as a certain glyco-epitope, are suitable for the unambiguous detection, identification and quantification of a modification using a single 2D NMR experiment.Citation11–17 With the help of a few oligosaccharides, it was possible to assign the chemical shift correlations of the major N-glycans in a variety of mAbs and other glycoproteins, allowing also quantification.Citation15–17 Sequence-specific assignment is lost when denaturing conditions are applied, but this is considered acceptable for confirming the presence and exact nature of a certain PTM.
Here, we aimed at finding unique NMR signals that would identify α-Gal epitopes in therapeutic proteins and at confirming the previously reported presence of α-Gal in the biotherapeutic mAb cetuximab, which was approved by the US Food and Drug Administration in 2004 for the treatment of head and neck cancer and metastatic colorectal cancer.Citation18 Cetuximab is produced in the mouse myeloma NS0 cell line and was reported to contain α-Gal.Citation19–22 The presence of α-Gal can cause severe side effects in some patients.Citation21,Citation23,Citation24 A biobetter of cetuximab expressed in CHO cells was better tolerated by patients.Citation25 Nevertheless, even CHO cells have been reported to express α-Gal epitopes under certain conditions.Citation6
As a proof of concept, we analyzed commercially available oligosaccharides containing Galα1,3Gal to find characteristic chemical shift correlations that are unique for Galα1,3Gal and screened a variety of biopharmaceuticals under denaturing conditions for those characteristic signals.
Results
The NMR signature of α-Gal epitopes
To explore the NMR signature of the α-Gal epitope and in particular characteristic NMR correlations in denatured glycoproteins, we investigated the two related trisaccharides Galα1,3Galβ1,4GlcNAc () and Galα1,3Galβ1,3GlcNAc () using 2D NMR spectroscopy. The first trisaccharide, also called xenoantigen type 2 or linear blood group B type 2 trisaccharide, represents the α-Gal epitope that is recognized by the anti-Gal antibodies. The second trisaccharide is a rare epitope called xenoantigen type 1 or linear blood group type 1 trisaccharide that is structurally similar, but differs at the linkage between Gal and GlcNAc. Complete 1H and 13C chemical shift assignments for both carbohydrates, including their α- and β-anomeric form at the reducing end ( and ), were obtained using standard 1H-1H and 1H-13C correlation spectra both in plain D2O and 7 M urea-d4 in D2O (pH* 7.4, uncorrected). Denaturing conditions were used for optimal comparison, with spectra of denatured glycoproteins measured under the same conditions. In contrast to other biomolecules, carbohydrates are fairly flexible and, with few exceptions, do not form stable secondary structures.Citation26–28 Therefore, the chemical shifts of uncharged oligosaccharides should not depend very much on the solvent conditions. Neither should there be large differences between small oligosaccharides and glycans attached to denatured proteins. Surprisingly, we observed small, but significant deviations of the resonances between the two conditions for both oligosaccharides (). Many resonances showed deviations between half to three line-widths, either in the 1H,13C or both dimensions. The largest 1H deviations were observed for the two H2 resonances of the terminal Gal3 and the connecting Gal2. For the use of unique chemical shift correlations as evidence for the presence of a certain glyco-epitope in a glycoprotein, it is important that the correlations match exactly. Therefore, the measurements in 7 M urea-d4 in D2O (pH* 7.4) are crucial for the two α-Gal trisaccharides in order to obtain good matches to denatured glycoproteins. Although the signals measured in D2O are all very close to the signals detected in 7 M urea, which allows hypothesizing about the presence of a certain glyco-epitope, an exact match is needed to obtain reliable information. The chemical shift changes seem even more severe in the 2D 1H-1H TOCSY spectrum (Supplementary Fig. S1).
Figure 2. Chemical shift assignments of the α-Gal antigen trisaccharide (Galα1,3Galβ1,4GlcNAc) and the xeno antigen type 1 trisaccharide (Galα1,3Galβ1,3GlcNAc) measured either in D2O (blue) or in 7 M urea-d4/D2O at 298 K and pH* 7.4 (red). (a) Overlay of two 1H-13C HSQC spectra of Galα1,3Galβ1,4GlcNAc measured either in D2O (blue, with assignment) or in 7 M urea-d4/D2O pH* 7.4 (red). The spectra were recorded with multiplicity-editing leading to opposite sign for CH2 groups (green and purple). The spectra were measured with 32 transients, a recycle delay of 1.5 sec and 2048 × 512 points resulting in a total measurement time of 7.5 hours. A schematic presentation of the trisaccharide structure in its α and β anomeric form is shown on the top. At the bottom the anomeric region of the 1H-13C HSQC spectrum is shown. Few 1H-13C three-bond correlations are visible as well (without label) in particular between H2-C3 and H3-C2 of Gal2 and Galα3. (b) Overlay of two 1H-13C HSQC spectra of related xeno antigen type 1 trisaccharide measured either in D2O (blue, with assignment) or in 7 M urea-d4/D2O pH* 7.4 (red). The spectra were recorded with the same parameters as the α-Gal antigen trisaccharide. Asterisks indicate signals of a minor impurity. Its identity and the chemical shift assignments are provided in the Supporting Information (Figure S2 and Table S2).
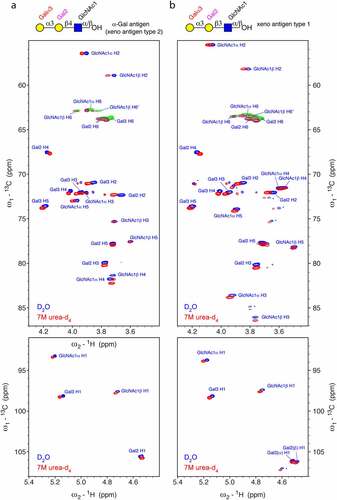
Table 1. Observed chemical shifts of the α-Gal epitope trisaccharide (Galα1,3Galβ1,4GlcNAc) dissolved in 7 M urea-d4 pH* 7.4 (indicated by U) and in plain D2O (indicated by D). The data were measured at 298 K and are referenced to internal DSS. For comparison, previously reported values of Galα1,3Galβ1,4GlcNAcβ-linkerCitation29 are included as well.
One characteristic correlation for the α-Gal epitope is the C1-H1 signal of the terminal Galα1,3 (Gal3) moiety at 98.3 ppm/5.16 ppm (), which is quite isolated. The chemical shift correlations of this anomeric 1H resonance of the terminal Gal are also visible and isolated in the 2D 1H-1H TOCSY spectrum (Supplementary Fig. S1). TheCitation13C chemical shift of C3 of the connected second Gal residue at ~80 ppm (), quite downfield shifted due to the substitution at O3, is unique too. All 1H-13C correlations of the terminal Galα1,3 moiety are basically identical between the two trisaccharides. The signals of the connecting Gal2 (Galβ1,4 or Galβ1,3) occur at similar positions but are not identical as expected. Furthermore, a minor impurity of Galβ1,3Galβ1,3GlcNAc was detected in the sample of Galβα1,3Galβ1,3GlcNAc at an abundance of ~15% (Supplementary Figure S2 and Table S2). The assignment is reported in the Supplementary Table S1.
Detection of α-Gal in therapeutic monoclonal antibodies
In order to recognize a certain glyco-epitope by NMR spectroscopy in denatured proteins, chemical shift correlations unique for this particular epitope must be identified. Any overlap with other common protein and glycan signals must be avoided. 1H-13C HSQC spectra of denatured mAbs, including rituximab, adalimumab, denosumab, trastuzumab and cetuximab, and other proteins were inspected for the typical chemical shift correlations of Galα1,3. All mAbs except cetuximab lacked Galα1,3 signals. However, the 1H-13C HSQC spectrum of cetuximab contained an anomeric signal (98.3 ppm/5.16 ppm) matching that of Galα1,3 (). Other 1H-13C correlations confirmed this finding. In particular, the isolated signal of C5-H5 at 73.8/4.20 ppm of the terminal Galα1,3 is characteristic (red, ), together with the signals of C3-H3, C4-H4 and C5-H5 (80.2/3.78 ppm, 67.7/4.15 ppm and 78.0/3.72 ppm) correlations of the central Gal2 of Galα1,3Galβ1,4GlcNAc (magenta, ). These four signals are already very indicative of the Galili epitope. The signals of the connecting Gal2 fit much better to the spectra of the α-Gal epitope () than to the xeno antigen type 1 epitope (). This agrees with the known structures of N-glycans that contain Galα1,3Galβ1,4GlcNAc ().
Figure 3. Characteristic chemical shift correlations of the α-Gal epitope observed in the 1H-13C HSQC spectrum of cetuximab in 7 M urea-d4 /D2O pH* 7.4 match perfectly to the α-Gal epitope trisaccharide (Galα1,3Galβ1,4GlcNAc). a) Overlay of a 1H-13C HSQC spectrum of cetuximab (blue) and a comparable spectrum of α-Gal epitope trisaccharide (Galα1,3Galβ1,4GlcNAc) measured in 7 M urea-d4/D2O pH* 7.4 (red). The spectrum of Cetuximab was acquired at 500 MHz with 190 transients, a recycle delay of 1.4 sec and 1024 × 512 points. The anomeric region is shown at the bottom. The labels of the terminal Galα1,3 are colored in red and of the connecting galactose at position 6 (Gal6) in magenta. The remaining signal of H2O led to baseline artifacts (negative baseline in green). b) Overlay of a 1H-13C HSQC spectrum of cetuximab (blue) and a comparable spectrum of the xeno antigen type 1 (Galα1,3Galβ1,3GlcNAc) measured in 7 M urea-d4 /D2O pH* 7.4 (red). Signals are similar, but do not match perfectly.
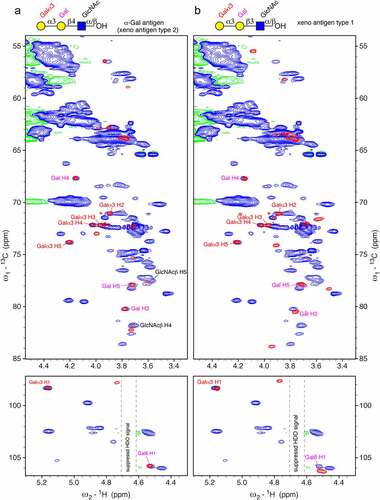
Figure 4. Unique chemical shift correlations of the α-Gal epitope in the 1H-13C HSQC spectrum of cetuximab in 7 M urea-d4 in D2O pH* 7.4 measured at 298 K. a) The schematic presentations of the most abundant glycan species with labels for each residue that correspond to the labels in the spectrum of cetuximab. In addition, we observe terminal mannoses at positions 4 and 4′ labeled as Man4t and Man4′t. b) Part of the 1H-13C HSQC spectrum of cetuximab measured with 190 transients, a recycle delay of 1.4 sec and 1024 × 512 points. Signals of two impurities were identified: polysorbate (Ps) and glycerol. c) Comparable region of the 1H-13C HSQC spectrum of α-Gal epitope trisaccharide (Galα1,3Galβ1,4GlcNAc) measured 7 M urea-d4 in D2O pH* 7.4 at 298 K using 32 transients, a recycle delay of 1.5 sec and 2048 × 512 points.
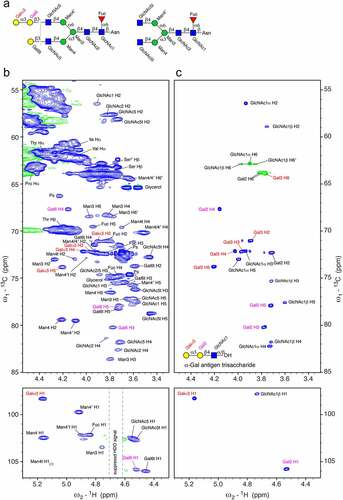
The NMR spectra confirm the presence of the highest abundant glycans previously reported for cetuximab,Citation19,Citation20 as shown in . Galα1,3 was reported to be part of various glycan types, with A2Ga2F and A2Sg1Ga1F as the most abundant ones,Citation19 which agrees with the NMR signals (). Other abundant glycans of the Fc part, such as A2G0F, A2G1F and A2G2F with terminal GlcNAc5 and GlcNAc5ʹ (attached to Man4/4ʹ) or Gal6 (attached to GlcNAc5/5ʹ), were confirmed by NMR spectroscopy as well. Isolated signals of terminal Gal (Gal6t), for example, the C2-H2 correlation at 73.7/3.59 ppm and of terminal GlcNAc (GlcNAct) in particular the C2-H2 and C5-H5 correlations at 58.1/3.73 ppm and 78.7/3.46 ppm, respectively, are clearly present ( left). Smaller signals of high mannose glycans are also visible (not labeled in ). A few small signals of terminal Man4 and Man4ʹ are visible as well ( bottom left, labeled Man4t and Man4ʹt).
The presence of the α-Gal epitope in cetuximab was also confirmed by 1H-1H correlations in a 2D TOCSY experiment that show the same pattern as in a comparable spectrum of the α-Gal trisaccharide (, red label). Although the H1 resonance partially overlaps with H1 of Man4, strong characteristic H1-H2, H1-H3 and H1-H4 correlations of Galα1,3 are visible (). Even these four 1H chemical shifts seem characteristic because a search in the carbohydrate chemical shift database of Glycosciences.de using GlycoNMRSearchCitation30 revealed as top hit a Galα1,3Gal-containing glycan (Supplementary Fig. S3a). Although it should get even clearer when adding theCitation13C chemical shift of C1, the coverage of the database is lower forCitation13C, resulting in three top hits containing α-linked Gal, but not Galα1,3Gal-containing glycans (Fig. S3b).
Figure 5. Characteristic chemical shift correlations of the α-Gal epitope trisaccharide (Galα1,3Galβ1,4GlcNAc) in 2D 1H-1H TOCSY spectra. (a) 1H-1H TOCSY spectrum of Galα1,3Galβ1,4GlcNAc measured in 7 M urea-d4 /D2O at pH* 7.4 and 298 K using 4 transients, 2048 × 256 complex points and a recycle delay of 1.5 sec. Correlations of the terminal Galα1,3 are labeled in red. (b) Comparable region of a 1H-1H TOCSY spectrum of cetuximab in 7 M urea-d4 in D2O at pH* 7.4 and 298 K applying 4 transients, 4096 × 512 points and a recycle delay of 1.2 sec. The signal labeled with # is a H1-H2 correlation of a terminal Man4 (Man4t). c) 1H-1H TOCSY spectrum of rituximab measured with 4 transients, 4096 × 700 points and a recycle delay of 1.5 sec. d) 1H-1H TOCSY spectrum of Adalimumab recorded with 4 transients, 4096 × 700 points and a recycle delay of 1.5 sec. e) 1H-1H TOCSY spectrum of denosumab measured at 700 MHz with 4 transients, 2048 × 512 points and a recycle delay of 1.0 sec. f) 1H-1H TOCSY spectrum of trastuzumab recorded with 4 transients, 4096 × 700 points and a recycle delay of 1.5 sec. g) Comparable 1H-1H TOCSY spectrum of etanercept measured with 4 transients, 2048 × 512 points and a recycle delay of 1.2 sec. h) 1H-1H TOCSY spectrum of fetuin measured with 4 transients, 2048 × 512 points and a recycle delay of 1.2 sec.
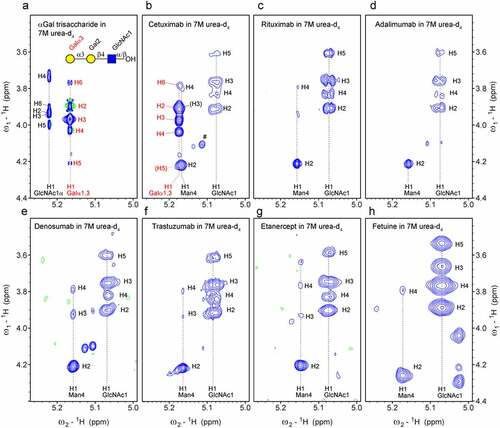
The mAbs rituximab (Rituxan, MabThera®), adalimumab (Humira®), denosumab (Prolia®) and trastuzumab (Herceptin®) did not show the characteristic signals of α-Gal in 2D TOCSY spectra (), and neither does the Fc-fusion biotherapeutic etanercept (Enbrel®) nor fetuin from fetal bovine serum (). 2D 1H-1H TOCSY correlations have the tremendous advantage that they can be recorded within a short time (~1 hour) because the sensitivity of 1H is high and the natural abundance is nearly 100%, in contrast to experiments involvingCitation13C with a natural abundance of only 1.1%.
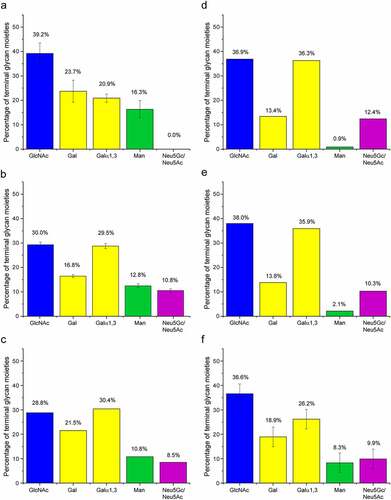
A semiquantitative analysis of the terminal glycan moieties based on the cross-peak volumes in the 1H-13C HSQC spectrum of cetuximab is presented in . The individual signals used for each terminal moiety are indicated in Fig. S4. The approach is semiquantitative because the applied recycle delay of 1.4 sec was not long enough for fully quantitative measurements, but a compromise to obtain spectra with a sufficient sensitivity in a feasible time. A comparable analysis of the MS data of the same batch is summarized in . The detailed HPLC-MS data are provided in the Supporting Information as an Excel table. Both methods found terminal GlcNAc moieties as the most abundant terminal monosaccharides, 39.1% by NMR and 30.0% by MS. The amount of α-Gal epitopes reported by terminal Galα1,3, with 21.4% detected by NMR spectroscopy and 29.5% by MS, is in a similar range, but deviates slightly. The amount of terminal Man is comparable with both methods as well. There is an apparent disagreement between both approaches for terminal Gal (β1,3-linked to GlcNAc) and terminal sialic acids. NMR did not detect any sialic acids. The sialic acids were lost during sample preparation, as buffer exchange to ddH2O leads to a significant drop in pH, which causes sialic acid to be cleaved and subsequently lost during dialysis. Interestingly, the amount of Neu5Ac+Neu5Gc detected with MS added on top of the terminal Gal amount results approximately in the amount of Gal detected by NMR. This agrees with the assumption that the terminal sialic acid was removed in the NMR sample, exposing then terminal Gal. The quantity of terminal α-Gal epitopes and terminal GlcNAcs is roughly the same as MS, but with NMR spectroscopy the signals of the terminal GlcNAc are clearly stronger than the signals of the α-Gal epitope (Fig. S4), suggesting a bias in the quantification by MS. Comparable histograms of terminal sugars were determined for middle-up glycoprofiling,Citation19 CEX-MS and CE-MS,Citation20 as well as for xCGE-LIF-based glycoprofiling of cleaved fluorescently labeled N-glycans (). All these methods critically depend on the correct assignment of observed species to individual N-glycan structures. Typically, a certain cutoff is applied and lower abundant glycan species are ignored. However, many low-abundance glycans, especially highly branched ones, can still contribute significantly to such histograms of terminal sugar moieties. The agreement among the different methods is still improvable, illustrating the importance of orthogonal methods for cross-validation.
Figure 6. Abundance of terminal glycan moieties in cetuximab measured by NMR spectroscopy, MS and released fluorescent-labeled glycans in comparison with previously reported data.Citation19,Citation20 a) Semiquantitative abundance of the terminal monosaccharides extracted from the volumes of a 2D 1H-13C HSQC spectrum of cetuximab. Error bars indicate 75% confidence intervals according to students t distribution. b) Abundance of terminal glycan moieties derived from HPLC-MS analysis. Error bars indicate the square root of the sum of individual standard deviations derived from the standard deviations of each individual glycan abundance. c) Percentage of terminal glycan moieties derived from previously reported middle-up glycoprofiling.Citation19 d) Abundance of terminal glycan moieties derived from earlier reported CEX-MS analysis.Citation20 e) Percentage of terminal glycan moieties derived from earlier reported CE-MS analysis.Citation20 f) Abundance of terminal glycan moieties derived from xCGE-LIF-based glycoprofiling. There is a degree of uncertainty, because not all glycoforms could be unambiguously identified. This is reflected by large estimated error bars. Details are found in the Supporting Data file.
How sensitive is the 1H-1H TOCSY experiment for detecting α-Gal?
It was not entirely unexpected that α-Gal could be easily detected in cetuximab, an NS0-expressed therapeutic mAb in which the N-glycosylation within the Fd contains 78% α-Gal.Citation19 However, the use of murine cell lines to express antibody therapeutics is now rare, so that αGal does not seem to be an issue. CHO cell lines, currently the most popular expression system for mAbs, were reported to lack expression of α1,3GT and thus do normally not produce α-Gal epitopes.Citation31 Is that really correct? There are few reports that under certain conditions, CHO cells can produce α-Gal epitopes.Citation6 Abatacept (ORENCIA®) was reported to contain very low amounts of α-Gal, namely 0.37 nmol/mg protein,Citation6 corresponding to an average of 3.4% α-Gal epitope per Fc-fusion dimer. Detecting α-Gal epitopes at such a low concentration is a challenge with conventional techniques because, in the case of abatacept, this corresponds to only ~0.2% of the mass of total N-linked glycans.Citation32 The distribution of those α-Gal epitopes over several N-glycan forms is the real challenge because N-linked glycans with abundance below 0.1% could often not be properly analyzed.Citation32
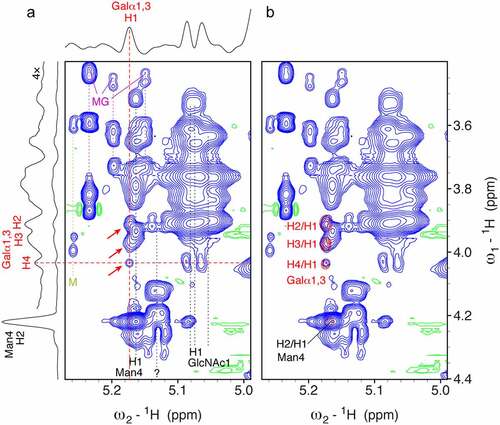
Here, we present a 1H-1H TOCSY spectrum of abatacept under denaturing conditions (). The characteristic pattern of α-Gal correlations is visible. The H4-H1 correlation is isolated and clearly visible. The H2-H1 and H3-H1 correlations are partially overlapping with other signals of the H1 resonance of Man4. All three α-Gal correlations match exactly the corresponding signals of cetuximab (). Slices through the 2D spectrum illustrate the signal to noise of the α-Gal signals (). The signal intensity of the αGal H4-H1 correlation is 83× smaller than the signal of the H2-H1 correlation of Man4. In the case of cetuximab, the intensity ratio between αGal H4-H1 and Man4 H2-H1 was 1.2. In a rough estimation, the amount of α-Gal in abatacept is ~100× smaller than in cetuximab (per N-glycan). Based on the reported quantification for cetuximab containing 2.62 μmol α-Gal/μmol IgG (see Materials and Methods), we calculated an amount of ~26 nmol α-Gal/μmol abatacept (dimer). This rough estimate is in good agreement with Bosques et al. reporting ~34 nmol α-Gal/μmol abatacept.Citation6 The 2D spectrum was recorded on an ordinary 600 MHz spectrometer with a four-channel room temperature probe within 24 hours, but a spectrometer with a cryoprobe that typically gains at least a factor of 2.8 in sensitivity would be able to measure a comparable spectrum in 3 hours.Citation33
Figure 7. The CHO cell-expressed therapeutic mAb abatacept contains α-Gal epitopes. A 2D 1H-1H TOCSY spectrum of abatacept under denaturing conditions shows three characteristic signals of α-Gal (red arrows). The spectrum was measured using a mixing time of 80 ms, 64 scans, a recycle delay of 1.5 sec, 2048 × 700 points and spectral widths of 12.9 ppm × 8.3 ppm with a duration of nearly 23 hours 45 min. To illustrate the signal-to-noise ratio a horizontal and a vertical slice are shown on the top and left taken at the dashed red lines in the spectrum. On the right the same spectrum is shown on top of a comparable spectrum of cetuximab (red contours), which illustrates that the α-Gal signals of abatacept match exactly the positions in the spectrum of cetuximab. The H2/H1 correlation of Man4 fits as well, which is then used as reference for estimating the amount of α-Gal in both biotherapeutics. Please note that the vertical red dashed line does not go through the maximum of the Man4 H2/H1 correlation, therefore the real signal intensity of this Man4 signal is larger than indicated in the 1D slice. Signals of maltose glycation products are indicated by a dark magenta MG label and magenta dashed lines. Signals of free maltose likely released due to reversible glycation are indicated by an olive green M label and olive green dashed lines.
Discussion
We aimed at establishing an NMR spectroscopy approach as an orthogonal method to HPLC-MS techniques. Although Galα1,3Gal-containing oligosaccharides and glycopeptides have been investigated by NMR spectroscopy before,Citation29,Citation34–36 the chemical shift assignments were not measured under denaturing conditions and were thus not fully comparable to the spectra of denatured glycoproteins. The published NMR data were sometimes contradictory or incomplete, and characteristic or unique NMR correlations in the context of biotherapeutics had not been investigated so far.
HPLC-MS- and CE-MS-based methods are very sensitive and can reveal the distribution of N-glycosylation of intact mAbs,Citation20 mAb subunits,Citation37 glycopeptidesCitation38 or the released glycan.Citation10,Citation39 However, of these methods, only PGC-MSCitation2 can confirm the type of linkage and the exact identity of the terminal hexoses, and therefore unambiguously identify the Galα1,3Gal epitope.
Nevertheless, one of the central questions for the safety of biotherapeutics is as follows: Are there relevant amounts of immunogenic epitopes detectable? In this context, the exact position or the nature of the underlying glycan is less relevant. In the case of cetuximab, the large amount of unique NMR correlations of α-Gal epitopes present in 1H-13C and 1H-1H spectra can robustly and unambiguously identify this epitope. As NMR spectroscopy is not as sensitive as MS, the presence of all those unique correlations indicates a significant amount of the immunogenic epitope. NMR spectroscopy is per se a quantitative method; therefore, exact quantification is achievable using appropriate experimental parameters like sufficiently long recycle delays.Citation13 Our semiquantitative analysis of the terminal monosaccharides by NMR spectroscopy and MS revealed a striking agreement for the α-Gal abundance of ~25% of all terminal glycan moieties.
With the α-Gal epitope, we have further emphasized that NMR spectroscopy is suited to unambiguously confirm the presence of a certain glyco-epitope with the exact linkages and stereochemistry within the context of a glycoprotein. In addition, there is a good chance to identify even unknown glyco-epitopes with NMR spectroscopy.
In contrast to 1H-13C HSQC spectra, 2D 1H-1H TOCSY spectra have the advantage that they are quite sensitive and can be measured typically in less than an hour because only sensitive Citation1H nuclei at nearly 100% abundance are involved. 1H-13C correlations involving Citation13C nuclei that are only present at 1.1% natural abundance are by a factor of 90 less sensitive. 2D 1H-1H TOCSY spectra are suited for fast screening. Nevertheless, the 1H-13C HSQC spectrum shows a higher dispersion of signals and is thus more reliable. In addition, it is more quantitative than 1H-1H correlations due to the more uniform one-bond coupling constant 1JCH. For α-Gal in mAbs, extracting relative abundances might be sufficient, for example the ratio between terminal Galα1,3 and terminal Galβ1,3 moieties. Although accurate quantification is possible with 1H-13C HSQC spectra of mAbs, as was reported for the quantification of glycan speciesCitation16,Citation17 and of methionine sulfoxide,Citation13 it required long recycle delays and long measurement times of typically 1–3 days. If semiquantitative results are sufficient, e.g., distinguishing an α-Gal content of <1%, ~50%, ~100%, ~200% per chain, standard parameters for 1H-13C HSQC spectra can be used, resulting in typical measurement times of 10–40 hoursCitation12–15 depending on the sensitivity of the NMR spectrometer and the sample concentration. The 1H-1H TOCSY spectrum recorded on an ordinary 600 MHz spectrometer was so sensitive that even very low amounts of α-Gal epitopes could be detected in abatacept, an Fc-fusion therapeutic expressed in CHO cells. We estimated the α-Gal content of ~26 nmol α-Gal/μmol abatacept (dimer), which is in good agreement with a previous report of ~34 nmol α-Gal/μmol abatacept.Citation6 This corresponds to an α-Gal epitope for 3.4% of the Fc-fusion dimers or ~0.2% of the mass of total N-linked glycans.Citation32
Although our intention was always to use NMR spectroscopy as a complementary tool to MS, it did not escape our attention that in this particular case of α-Gal epitopes a 2D 1H-1H TOCSY recorded in <1 hour for detecting the presence or absence of α-Gal in a protein preparation might be quite competitive to MS.
Materials and Methods
Sample treatment and preparation
Oligosaccharides
For a D2O sample, 2.5 mg of the trisaccharide Galα1,3Galβ1,3GlcNAc (Elicityl, catalog number GLY074-1) was dissolved in 500 μL D2O resulting in an uncorrected pH (pH*) of 6.7. For measurements under denaturing conditions, the same amount was dissolved in 500 μL D2O followed by lyophilization to remove exchangeable protons. The solid residue was dissolved in a 7 M urea-d4 (98 atom%D, ARMAR Chemicals) solution in D2O followed by adjusting the pH* to 7.4 (uncorrected pH) using deuterated hydrochloric acid (DCl) in D2O (ARMAR Chemicals). For the trisaccharide Galα1,3Galβ1,4GlcNAc (Carbosynth, catalog number OL06495), 1 mg was dissolved in 500 μL D2O and another 1 mg was used for the sample with 7 M urea using the same procedure as described above.
Cetuximab
For cetuximab, 4 mL of the formulation (Erbitux®, Merck KgaA; exp. Year: 2019, 5 mg/mL) was dialyzed against ddH2O (pH 7.0) using a SpectraPor 3.5 kDa cutoff membrane overnight. After lyophilization, the sample was dissolved in 500 μL of a 7 M urea-d4 (98 atom%D, ARMAR Chemicals) solution in D2O (100 atom%D, ARMAR Chemicals), resulting in a concentration of ~40 mg/ml mAb. A freshly prepared urea solution was used to minimize the formation of isocyanic acid. For reducing the disulfide bonds, ~1–1.6 mg of tris(2-carboxyethyl)phosphine hydrochloride (TCEP) (Sigma-Aldrich) was added to the sample corresponding to ~11 mmol·L−1 followed by incubation at 60°C for 15 min. The pH* was adjusted to 7.4 by adding NaOD (ARMAR Chemicals).
Etanercept
For etanercept (Enbrel® Amgen/Pfizer; formerly distributed by Immunex/Wyeth; Batch Nr.: 1015854, Exp Date.: 11/11), 1 mL formulation (50 mg) was dialyzed against ddH2O (pH 7.0) using a SpectraPor 3.5 kDa cutoff membrane for 5 hours and was then lyophilized. The lyophilized powder was dissolved in 1.5 mL 7 M urea-d4 (98 atom%D, ARMAR Chemicals) solution in D2O leading to a concentration of 33 mg/mL. For reducing the disulfide bonds, ~4 mg TCEP was added and the solution was placed at 60°C for 15 min. Aliquots of 500 μL were used for NMR measurements. The pH* was adjusted to 7.4 using NaOD (Armar Chemicals).
Denosumab
For denosumab (Prolia®, Amgen; Batch Nr.: 1067099, Exp Date.: 11/18), the formulation corresponding to 20 mg was dialyzed against ddH2O overnight and subsequently lyophilized. The residue was dissolved in 500 μL 7 M urea-d4 (98 atom%D, ARMAR Chemicals) solution in D2O. Approx. 1.8 mg TCEP was added, and the solution was placed at 60°C for 15 min. The pH* was adjusted to 7.4 using NaOD (Armar Chemicals).
Trastuzumab
For trastuzumab (Herceptin®, Roche; Batch Nr.: H4597H03, Exp Date: 04/19), 150 mg trastuzumab were dissolved in 7.2 mL Milli-Q (in-house, Milli-Q Integral 3, Merck/Millipore, Billerica, MA, USA) and stored at −80°C until further use. A total of 1.6 mL of this solution (33.6 mg) was dialyzed against ddH2O (pH 7.0) using a SpectraPor 3.5 kDa cutoff membrane overnight. The lyophilized powder was dissolved in 550 μL 7 M urea-d4 (98 atom%D, ARMAR Chemicals) solution in D2O. DTT-d10 (Cambridge Isotope Laboratories) was added to a concentration of 18 mM, and the solution was incubated at 60°C for 10 min. The pH* was adjusted to 7.4 using DCl (Armar Chemicals).
Adalimumab and rituximab
The NMR sample preparation of adalimumab (Humira®, AbbVie) and rituximab (MabThera, Roche) was described previously by Hinterholzer et al.Citation12
Fetuin
For Fetuin from fetal bovine serum (Sigma F3385), 32 mg was dissolved in 650 μL of a 7 M urea-d4 (98 atom%D, ARMAR Chemicals) solution in D2O. Approximately 2 mg TCEP was added, and after an incubation for 15 min at 65°C the pH was adjusted to 7.4 using NaOD (Armar Chemicals).
Abatacept
Abatacept (ORENCIA®, Bristol Myers Squibb; Lot. OE61132, exp. 08/2012) 60 mg in 2.4 mL formulation buffer was dialyzed twice against 4 L ddH2O using a SpectraPor 3.5 kDa cutoff membrane overnight. The resulting sample was lyophilized and dissolved in 650 μL of a 7 M urea-d4 (98 atom%D, ARMAR Chemicals) solution in D2O. Deuterated DTT-d10 (Cambridge Isotope Laboratories) was added to a concentration of 15 mM, and after an incubation for 15 min at 60°C, the pH was adjusted to 7.4 using NaOD (Armar Chemicals).
Mass spectrometry
Cetuximab (Erbitux®, Lot. 208480, exp. 09/2019, Merck KgaA) was rebuffered to 150 mmol.L−1 ammonium acetate using 50 kDa cutoff filters (Sartorius Vivaspin 500 from Sigma-Aldrich). Afterward, the samples were denatured and reduced to 3 mol.L−1 guanidine hydrochloride 10 mmol.L−1 tris(2-carboxyethyl)phosphine in 150 mmol.L−1 ammonium acetate at 70°C for 15 minutes. Followed by alkylation of the thiol groups with the addition of a final concentration of 20 mmol.L−1 iodoacetamide and incubation at 22°C for 30 minutes. Next, the samples were again rebuffered to 150 mmol.L−1 ammonium acetate using 3 kDa cutoff filters (Amicon Ultra from Sigma-Aldrich), and lastly digested by addition of 1:20 (w/w) trypsin (porcine pancreas, from Promega, catalog number V5111) and incubation at 37°C for 3 hours. Chromatographic separation of 100 ng sample was carried out on a Thermo Scientific™ UltiMate™ 3000 RSLCnano System using a Thermo Scientific™ Acclaim™ PepMap™ 100 C18 reversed phase HPLC column (500 × 0.075 mm i.d., dp 3 µm). For the separation 0.1% aqueous formic acid (solvent A) and 0.1% formic acid in acetonitrile (solvent B) were pumped at a flow rate of 300 nL.min−1 in the following order: 1.0% B for 5.0 min, a linear gradient from 1.0% to 40.0% B in 80.0 min, flushing at 90.0% B for 10 min and column re-equilibration at 1.0% B for 25 min. The column temperature was kept constant at 50°C. The nanoHPLC system was hyphenated to a Thermo Scientific™ Q Exactive™ Plus Hybrid Quadrupole-Orbitrap™ mass spectrometer via a Thermo Scientific™ Nanospray Flex™ ion source. The source was equipped with a SilicaTip emitter with 360 µm o.d., 20 µm i.d. and a tip i.d. of 10 µm purchased from CoAnn Technologies Inc. (Richland, WA, USA). The spray voltage was set to 1.5 kV, the S-lens RF level to 55.0 and the capillary temperature to 320°C. Each scan cycle consisted of a full scan at a scan range of m/z 350–2,000 and a resolution setting of 70,000 at m/z 200, followed by 5 data-dependent higher-energy collisional dissociation (HCD) scans using a 2.0 m/z isolation window for precursor isolation and 28% normalized collision energy for fragmentation with a resolution setting of 17,500 at m/z 200 for data acquisition. For the full scan, the automatic gain control (AGC) target was set to 3e6 charges with a maximum injection time of 100 ms; for the HCD scans, the AGC target was 1e5 charges with a maximum injection time of 100 ms. Already fragmented precursor ions were excluded for 30 seconds. The sample was measured in five technical replicates. Data acquisition was conducted using Thermo Scientific™ Chromeleon™ 7.2 CDS, data evaluation and relative quantification of N-glycosylation with Thermo Scientific™ BioPharma FinderTM software version 4.0.
Glycoprofiling of Released N-Glycans of cetuximab by xCGE-LIF
Released N-glycans were prepared using a glyXprep™ kit and analyzed on a xCGE-LIF-based glyXboxCE™ system (glyXera, Magdeburg, Germany), according to Cajic et al.Citation40 For migration time alignment, crucial for glycan peak annotation via migration time matching with database entries of glyXbaseCE™ (glyXera), 1.0 μL of sample was mixed with 1.0 μL of 2nd NormMiX™ (glyXera) and 1.0 μL prediluted GeneScan™ 500 LIZ® Size Standard. The mixture was combined with 6.0 μL glyXinject (glyXera) and subjected to xCGE-LIF analysis. For xCGE-LIF measurements, the samples were electrokinetically injected and separated with a running voltage of 15 kV for 40 min. The generated glycan data was analyzed with the glyco-analysis software glyXtoolCE™ (glyXera), which automatically performed migration time alignment, raw data smoothing, peak picking, relative quantification, and peak/structure annotation.
NMR spectroscopy
Unless stated otherwise, spectra were either recorded on a 600 MHz Bruker Avance III HD spectrometer equipped with a 1H/13C/15N/31P quadruple-resonance room temperature probe at 298 K. Few spectra were recorded on 500 MHz or 700 MHz Bruker Avance III HD spectrometer equipped with cryogenic 1H/13C/15N triple-resonance probes (TCI) at 298 K. For all the NMR measurements, standard 5 mm NMR tubes (ARMAR, Type 5TA) with a sample volume of 500 μL were used. The oligosaccharides were assigned using the following 2D experiments: 1H-13C HSQC, 1H-13C HMBC (hmbcgpndqf), 1H-1H TOCSY, 1H-1H COSY (cosygpppqf), 1H-13C HMQC-COSY,Citation11 1H-1H ROESY and 1H-15N HSQC. Data were measured and processed using Topspin 3.5/3.6.1 (Bruker). Resonance assignments were obtained using the software Sparky 3.114 (T. D. Goddard and D. G. Kneller, SPARKY 3, University of California, San Francisco, USA). For referencing, 2,2-dimethyl-2-silapentane-5-sulfonic acid (DSS) (ARMAR Chemicals) was added to the samples after measuring all other spectra. A 1D 1H experiment was performed for referencing the proton chemical shift. The carbon and nitrogen dimensions were referenced according to the IUPAC-IUB recommended chemical shifts referencing ratios of 0.251449530 (13C) and 0.101329118 (15N).Citation41
Estimated quantification of α-Gal content of abatacept
The 2D 1H-1H TOCSY spectrum of abatacept under denaturing conditions measured using a mixing time of 80 ms, 64 scans, a recycle delay of 1.5 sec, 2048 × 700 points and spectral widths of 12.9 ppm × 8.3 ppm with a duration of nearly 23 hours 45 min was used for an estimation of α-Gal content. The ratio between the signal intensity of the H4/H1 correlation of α-Gal and the H2/H1 correlation of Man4 was 1:83 in abatacept. In contrast, the same ratio was 1.2:1 in cetuximab, so that the α-Gal content of abatacept was ~100× smaller than in cetuximab.
Ayoub et al. reported that 78% of the N-glycans of the Fd part of cetuximab contained at least one α-Gal epitope.Citation19 Considering the reported N-glycan profile, on average, 1.31 equivalents of α-Gal are present on each N-glycan of the Fd part, resulting in 2.62 equivalents α-Gal per IgG, i.e., 2.62 μmol/μmol. Based on the ~100× smaller α-Gal content in abatacept, a content of 26 nmol/μmol Fc-fusion dimer is calculated. Using an average molecular weight of 92300 g/mol (containing glycans) and the reported content of 370 pmol/mg abatacept reported by Bosques et al.Citation6 results in 34 nmol α-Gal/μmol abatacept.
Supplemental Material
Download MS Word (3.9 MB)Acknowledgments
We acknowledge Novartis for kindly providing expired samples of reference medicines for rituximab, adalimumab and abatacept, and Dr Urs Lohrig and Dr Chiara Cabrele for valuable comments on the manuscript as well as scientific discussions. We also acknowledge Biomolecular NMR Spectroscopy Platform at the ETH Zürich, Dr Alvar Gossert, and Dr Simon Rüdisser (both ETH Zürich) for access to 500 MHz and 700 MHz Bruker spectrometer with cryogenic probe and technical support.
Disclosure statement
The authors declare the following competing financial interest(s): The salary of Arthur Hinterholzer was fully funded and Christian G. Hubers salary is partly funded by the Christian Doppler Laboratory for Biosimilar Characterization, which is partly supported by Novartis and Thermo Fisher Scientific. Erdmann Rapp is an employee of glyXera GmbH, Magdeburg, Germany. The authors declare no other competing financial interest.
Supplementary material
Supplemental data for this article can be accessed online at https://doi.org/10.1080/19420862.2022.2132977
Additional information
Funding
References
- Macher BA, Galili U. The Gal alpha 1,3Gal beta 1,4GlcNAc-R (alpha-Gal) epitope: a carbohydrate of unique evolution and clinical relevance. BBA-Gen Subjects. 2008;1780:75–15. doi:10.1016/j.bbagen.2007.11.003.
- Galili U, Rachmilewitz EA, Peleg A, Flechner I. A unique natural human-Igg antibody with anti-Alpha-Galactosyl specificity. J Exp Med. 1984;160:1519–31. doi:10.1084/jem.160.5.1519.
- Galili U. Biosynthesis of alpha-Gal epitopes (Gal alpha 1-3Gal beta 1-4GlcNAc-R) and their unique potential in future alpha-Gal therapies. Front Mol Biosci. 2021:8. doi:10.3389/fmolb.2021.746883.
- Steinke JW, Platts-Mills TAE, Commins SP. The alpha-gal story: lessons learned from connecting the dots. J Allergy Clin Immun. 2015;135:589–96. doi:10.1016/j.jaci.2014.12.1947.
- Sheeley DM, Merrill BM, Taylor LCE. Characterization of monoclonal antibody glycosylation: comparison of expression systems and identification of terminal alpha-linked galactose. Anal Biochem. 1997;247:102–10. doi:10.1006/abio.1997.2036.
- Bosques CJ, Collins BE, Meador JW, Sarvaiya H, Murphy JL, DelloRusso G, Bulik DA, Hsu IH, Washburn N, Sipsey SF, et al. Chinese hamster ovary cells can produce galactose-alpha-1,3-galactose antigens on proteins. Nat Biotechnol. 2010;28:1153–56. doi:10.1038/nbt1110-1153.
- Ashford DA, Alafi CD, Gamble VM, Mackay DJG, Rademacher TW, Williams PJ, Dwek RA, Barclay AN, Davis SJ, Somoza C, et al. Site-Specific glycosylation of recombinant rat and human soluble Cd4 variants expressed in Chinese-Hamster ovary cells. J Biol Chem. 1993;268:3260–67. doi:10.1016/S0021-9258(18)53687-5.
- Borrebaeck CAK, Malmborg AC, Ohlin M. Does endogenous glycosylation prevent the use of mouse monoclonal-Antibodies as cancer therapeutics. Immunol Today. 1993;14:477–79. doi:10.1016/0167-5699(93)90259-N.
- Galili U, Matta KL. Inhibition of anti-Gal IgG binding to porcine endothelial cells by synthetic oligosaccharides. Transplantation. 1996;62:256–62. doi:10.1097/00007890-199607270-00018.
- Stavenhagen K, Kolarich D, Wuhrer M. Clinical glycomics employing graphitized carbon liquid chromatography-Mass spectrometry. Chromatographia. 2015;78:307–20. doi:10.1007/s10337-014-2813-7.
- Schubert M, Walczak MJ, Aebi M, Wider G. Posttranslational modifications of intact proteins detected by NMR spectroscopy: application to glycosylation. Angew Chem Int Edit. 2015;54:7096–100. doi:10.1002/anie.201502093.
- Hinterholzer A, Stanojlovic V, Cabrele C, Schubert M. Unambiguous identification of pyroglutamate in full-Length biopharmaceutical monoclonal antibodies by NMR spectroscopy. Anal Chem. 2019;91:14299–305. doi:10.1021/acs.analchem.9b02513.
- Hinterholzer A, Stanojlovic V, Regl C, Huber CG, Cabrele C, Schubert M. Identification and quantification of oxidation products in full-Length biotherapeutic antibodies by NMR spectroscopy. Anal Chem. 2020;92:9666–73. doi:10.1021/acs.analchem.0c00965.
- Hinterholzer A, Stanojlovic V, Regl C, Huber CG, Cabrele C, Schubert M. Detecting aspartate isomerization and backbone cleavage after aspartate in intact proteins by NMR spectroscopy. J Biomol Nmr. 2021;75:71–82. doi:10.1007/s10858-020-00356-4.
- Peng JN, Patil SM, Keire DA, Chen K. Chemical structure and composition of major glycans covalently linked to therapeutic monoclonal antibodies by middle-Down nuclear magnetic resonance. Anal Chem. 2018;90:11016–24. doi:10.1021/acs.analchem.8b02637.
- Zhuo Y, Keire DA, Chen K. Minor N-Glycan mapping of monoclonal antibody therapeutics using middle-Down NMR spectroscopy. Mol Pharmaceut. 2021;18:441–50. doi:10.1021/acs.molpharmaceut.0c01083.
- Unione L, Lenza MP, Arda A, Urquiza P, Lain A, Falcon-Perez JM, Jimenez-Barbero J, Millet O. Glycoprofile analysis of an intact glycoprotein as inferred by NMR spectroscopy. Acs Central Sci. 2019;5:1554–61. doi:10.1021/acscentsci.9b00540.
- Wong SF. Cetuximab: an epidermal growth factor receptor monoclonal antibody for the treatment of colorectal cancer. Clin Ther. 2005;27:684–94. doi:10.1016/j.clinthera.2005.06.003.
- Ayoub D, Jabs W, Resemann A, Evers W, Evans C, Main L, Baessmann C, Wagner-Rousset E, Suckau D, Beck A. Correct primary structure assessment and extensive glyco-profiling of cetuximab by a combination of intact, middle-up, middle-down and bottom-up ESI and MALDI mass spectrometry techniques. Mabs-Austin. 2013;5:699–710. doi:10.4161/mabs.25423.
- Fussl F, Trappe A, Carillo S, Jakes C, Bones J. Comparative elucidation of cetuximab heterogeneity on the intact protein level by cation exchange chromatography and capillary electrophoresis coupled to mass spectrometry. Anal Chem. 2020;92:5431–38. doi:10.1021/acs.analchem.0c00185.
- Chung CH, Mirakhur B, Chan E, Le Q, Berlin J, Morse M, Murphy BA, Satinover SM, Hosen J, Mauro D, et al. Cetuximab-induced anaphylaxis and IgE specific for galactose-alpha-1,3-galactose. New Engl J Med. 2008;358:1109–17. doi:10.1056/NEJMoa074943.
- Qian J, Liu T, Yang L, Daus A, Crowley R, Zhou QW. Structural characterization of N-linked oligosaccharides on monoclonal antibody cetuximab by the combination of orthogonal matrix-assisted laser desorption/ionization hybrid quadrupole-quadrupole time-of-flight tandem mass spectrometry and sequential enzymatic digestion. Anal Biochem. 2007;364:8–18. doi:10.1016/j.ab.2007.01.023.
- O’Neil BH, Allen R, Spigel DR, Stinchcombe TE, Moore DT, Berlin JD, Goldberg RM. High incidence of cetuximab-related infusion reactions in Tennessee and North Carolina and the association with atopic history. J Clin Oncol. 2007;25:3644–48. doi:10.1200/Jco.2007.11.7812.
- Maier S, Chung CH, Morse M, Platts-Mills T, Townes L, Mukhopadhyay P, Bhagavatheeswaran P, Racenberg J, Trifan OC. A retrospective analysis of cross-reacting cetuximab IgE antibody and its association with severe infusion reactions. Cancer Med-Us. 2015;4:36–42. doi:10.1002/cam4.333.
- Wang C, He XH, Zhou B, Li J, Li BH, Qian WZ, Hou S, Wang H, Shi YK, Guo YJ. Phase 1 study of anti-epidermal growth factor receptor monoclonal antibody in patients with solid tumors. Mabs-Austin. 2011;3:67–75. doi:10.4161/mabs.3.1.14021.
- Zierke M, Smiesko M, Rabbani S, Aeschbacher T, Cutting B, Allain FHT, Schubert M, Ernst B. Stabilization of branched oligosaccharides: Lewis(x) benefits from a nonconventional C-H center dot center dot center dot O hydrogen bond. J Am Chem Soc. 2013;135:13464–72. doi:10.1021/ja4054702.
- Aeschbacher T, Zierke M, Smiesko M, Collot M, Mallet JM, Ernst B, Allain FHT, Schubert M, Secondary Structural A. Element in a wide range of fucosylated glycoepitopes. Chem-Eur J. 2017;23:11598–610. doi:10.1002/chem.201701866.
- Zhang YZ, Gomez-Redondo M, Jimenez-Oses G, Arda A, Overkleeft HS, van Der Marel GA, Jimenez-Barbero J, Codee JDC. Synthesis and structural analysis of aspergillus fumigatus galactosaminogalactans featuring alpha-Galactose, alpha-Galactosamine and alpha-N-Acetyl galactosamine linkages. Angew Chem Int Edit. 2020;59:12746–50. doi:10.1002/anie.202003951.
- Corzana F, Bettler E, du Penhout CH, Tyrtysh TV, Bovin NV, Imberty A. Solution structure of two xenoantigens: alpha Gal-LacNAc and alpha Gal-Lewis X. Glycobiology. 2002;12:241–50. doi:10.1093/glycob/12.4.241.
- Klukowski P, Schubert M. Chemical shift-based identification of monosaccharide spin-systems with NMR spectroscopy to complement untargeted glycomics. Bioinformatics. 2019;35:293–300. doi:10.1093/bioinformatics/bty465.
- Jenkins N, Parekh RB, James DC. Getting the glycosylation right: implications for the biotechnology industry. Nat Biotechnol. 1996;14:975–81. doi:10.1038/nbt0896-975.
- Zhu L, Guo QC, Guo HZ, Liu T, Zheng YX, Gu PM, Chen X, Wang H, Hou S, Guo YJ. Versatile characterization of glycosylation modification in CTLA4-Ig fusion proteins by liquid chromatography-mass spectrometry. Mabs-Austin. 2014;6:1474–85. doi:10.4161/mabs.36313.
- Kovacs H, Moskau D, Spraul M. Cryogenically cooled probes - a leap in NMR technology. Prog Nucl Mag Res Sp. 2005;46:131–55. doi:10.1016/j.pnmrs.2005.03.001.
- Dorland L, Vanhalbeek H, Vliegenthart JFG. The identification of terminal-Alpha (1-]3)-Linked galactose in N-Acetyllactosamine type of glycopeptides by means of 500-MHz H-1-NMR Spectroscopy. Biochem Bioph Res Co. 1984;122:859–66. doi:10.1016/S0006-291x(84)80113-8.
- Gebus C, Cottin C, Randriantsoa M, Drouillard S, Samain E. Synthesis of alpha-galactosyl epitopes by metabolically engineered Escherichia coli. Carbohyd Res. 2012;361:83–90. doi:10.1016/j.carres.2012.05.015.
- Karki G, Mishra VN, Mandal PK. An expeditious synthesis of blood-group antigens, ABO histo-blood group type II antigens and xenoantigen oligosaccharides with amino type spacer-arms. Glycoconjugate J. 2016;33:63–78. doi:10.1007/s10719-015-9635-1.
- D’Atri V, Fekete S, Beck A, Lauber M, Guillarme D. Hydrophilic interaction chromatography hyphenated with mass spectrometry: a powerful analytical tool for the comparison of originator and biosimilar therapeutic monoclonal antibodies at the middle-up level of analysis. Anal Chem. 2017;89:2086–92. doi:10.1021/acs.analchem.6b04726.
- Bongers J, Devincentis J, Fu JM, Huang PQ, Kirkley DH, Leister K, Liu PR, Ludwig R, Rumney K, Tao L, et al. Characterization of glycosylation sites for a recombinant IgG1 monoclonal antibody and a CTLA4-Ig fusion protein by liquid chromatography-mass spectrometry peptide mapping. J Chromatogr A. 2011;1218:8140–49. doi:10.1016/j.chroma.2011.08.089.
- Ruhaak LR, Zauner G, Huhn C, Bruggink C, Deelder AM, Wuhrer M. Glycan labeling strategies and their use in identification and quantification. Anal Bioanal Chem. 2010;397:3457–81. doi:10.1007/s00216-010-3532-z.
- Cajic S, Hennig R, Burock R, Rapp E. Capillary (Gel) Electrophoresis-Based methods for immunoglobulin (G) Glycosylation Analysis. Exp Suppl. 2021;112:137–72. doi:10.1007/978-3-030-76912-3_4.
- Markley JL, Bax A, Arata Y, Hilbers CW, Kaptein R, Sykes BD, Wright PE, Wüthrich K. Recommendations for the presentation of NMR structures of proteins and nucleic acids - IUPAC-IUBMB-IUPAB Inter-Union task group on the standardization of data bases of protein and nucleic acid structures determined by NMR spectroscopy. J Biomol NMR. 1998;12:1–23. doi:10.1023/A1008290618449.