
Abstract
Several food supplements comprising botanical, oil and bee products collected from retail markets in different countries were tested for the occurrence of 4 EU marker Polycyclic aromatic hydrocarbons (PAHs; benz[a]anthracene, chrysene, benzo[b]fluoranthene and benzo[a]pyrene). A robust GC/MS-based stable-isotope dilution method was used taking into account the differences in the type of matrices. The accuracy of the results was assessed by implementing several quality control tools. Sixty-eight samples of 94 analysed products exceeded the level of 0.5 μg/kg for the sum of the four EU marker PAHs (ΣPAH4). Benzo[a]pyrene exceeded the limit of quantification in 49 samples. The PAH with the highest abundance in all products was chrysene. On average, propolis extracts and other bee products showed relatively high levels of ΣPAH4 (mean 188.2 μg/kg), whereas the contamination levels of fish oil supplements were very low or mostly undetectable. Considerably high ΣPAH4 amounts found in some samples could remarkably increase the daily exposure of consumers to PAHs, demonstrating the need for continuous monitoring of ΣPAH4 in food supplements.
Graphical Abstract
Introduction
Polycyclic aromatic hydrocarbons (PAHs) are a large group of chemical contaminants, generally occurring in complex mixtures consisting of hundreds of compounds. They are produced by natural and anthropogenic processes, mainly by incomplete combustion of organic matter. Humans are exposed to PAHs through different pathways, where the major route for non-smokers is consumption of food (SCF Citation2002; EFSA Citation2008). Food can be contaminated from environmental sources (natural and mostly anthropogenic), from industrial food processing (drying, smoking, roasting) and from some domestic cooking practices (grilling, frying, barbecuing) (Harvey Citation1997; Howsam & Jones Citation1998).
In 2002 the European Commission’s Scientific Committee on Food (SCF) identified 15 individual PAHs as being of major concern for human health (SCF Citation2002). The toxicological importance of these compounds was confirmed by the International Agency for Research on Cancer (IARC Citation2014). These 15 EU priority PAHs were monitored in food to enable exposure assessments and to verify the validity of the use of benzo[a]pyrene as a marker for a “total-PAH content”. The European Commission set maximum levels for benzo[a]pyrene for the first time in 2005 by Regulation (EC) No. 208/2005, amending Regulation (EC) No. 466/2001 (EC Citation2005). Later, the maximum levels for benzo[a]pyrene were laid down in Regulation (EC) No. 1881/2006, setting maximum levels for certain contaminants in foodstuffs (EC Citation2006). In 2008 the European Food Safety Authority (EFSA) reviewed the previous risk assessment and evaluated the suitability of benzo[a]pyrene as a marker for the occurrence and toxicity of PAHs in food. The EFSA concluded that benzo[a]pyrene was not a suitable indicator and selected the sum of four (ΣPAH4) or eight PAHs (ΣPAH8) as the most suitable indicators. However, PAH8 does not provide much added value compared to ΣPAH4 (EFSA Citation2008). Following these conclusions, the Standing Committee on the Food Chain and Animal Health agreed to base risk management measures on ΣPAH4 – benz[a]anthracene, benzo[a]pyrene, benzo[b]fluoranthene and chrysene. Maximum levels for benzo[a]pyrene were maintained to ensure comparability with historical data. Currently, maximum levels in food are specified in Commission Regulation (EU) No. 835/2011 of 19 August 2011 for benzo[a]pyrene and ΣPAH4 (EU Citation2011a). Coherently, also Commission Regulation (EC) No. 333/2007, which lays down minimum method performance criteria, was revised by Commission Regulation (EU) No. 836/2011 (EU Citation2011b). Maximum levels are set for foodstuffs containing fats and oils and foods where smoking (smoked meat, smoked fish and fishery products) and drying processes (cocoa beans and derived products) or environmental pollution (bivalve molluscs) might cause high levels of contamination. The lowest maximum levels are set for food for infants and young children (EU Citation2011a).
Commission Regulation (EU) No. 835/2011 states that high levels of PAHs have been found in some food supplements often containing botanical ingredients such as ginkgo, ginseng, green tea, spirulina, or bee products such as propolis. Nevertheless, the levels are variable and depend on the specific products and method of production. Further data on food supplements are needed and should be collected (EU Citation2011a).
There are two classes of food supplements – vitamins and minerals – defined by Commission Regulation (EC) No. 1170/2009 (EC Citation2009). However, the European Commission recognised that about half of the commercial turnover is generated with food supplements containing other substances than vitamins and minerals. Among them are different amino acids, enzymes, pre- and probiotics, essential fatty acids, botanicals and other substances (COM Citation2008).
Generally, PAH might be expected in food supplements that underwent improper processing (thermal treatment, improper drying process), or in which PAHs accumulated from the environment (e.g. propolis extracts). Analytical challenges were highlighted by the industry for herbal food supplements. Industry representatives pointed out the difficulties with measurement of PAHs in food supplements and stated that the accuracy of the data on the PAH contents of herbal food supplements could be low, due to the application of improper analytical methods.
The European Union Reference Laboratory for PAHs (EURL PAHs), which is operated by the European Commisssion’s Joint Research Centre, committed to perform a survey of the four EU marker PAHs in a broad set of food supplements, with a particular focus given to the accuracy of the analyses in order to demonstrate the reliability of the data provided. The data produced shall strengthen the occurrence database which is used for risk assessment.
Materials and methods
Food supplements samples
A broad set of herbal and botanical food supplements, fish and edible oil food supplements and propolis and bee products was acquired in 2013 in retail markets of Belgium, the Netherlands, Austria, Czech Republic, Poland, Ireland and France. The total number of collected samples was 94; 69 samples were of the botanical origin and sold as a powder in gelatin capsules or solid pills, 15 samples of fish and edible oils sold in a liquid form or liquid in gelatin capsules and 10 samples of propolis and bee products in a liquid or semi-liquid form (). Additionally, 11 food supplement products were purchased from India, comprising 8 products of multicomponent botanical origin and three products containing edible oils (). All samples were stored in their original container at room temperature prior to analysis.
Table 1. List of the analysed food supplements samples with basic information.
Reagents and standards
All chemicals were of at least analytical grade, purchased from either Sigma-Aldrich (St. Louis, MO, USA) or VWR (Radnor, PA, USA). Sodium polyacrylate cross-linked and sand 50–70 mesh particle size were obtained from Sigma-Aldrich (St. Louis, MO, USA). Celite® 545 particle size 0.02–0.1 mm was from Merck (Darmstadt, Germany).
Syringe filters Acrodisc® with 1 μm PTFE membrane were purchased from Pall Life Sciences (Ann Arbor, MI, USA) and SPE cartridges Extract CleanTM Silica 500 mg/4 ml from Grace Davison Discovery Sciences (Deerfield, IL, USA).
The analytes benz[a]anthracene (BaA) CAS#56-55-3, chrysene (CHR) CAS#218-01-9, benzo[b]fluoranthene (BbF) CAS#205-99-2 and benzo[a]pyrene (BaP) CAS#50-32-8 were commercially available BCR-certified reference materials (IRMM, Geel, Belgium). The isotopically labelled compounds benz[a]anthracene (13C6, 99%), chrysene (13C6, 99%), benzo[b]fluoranthene (13C6, 99%) and benzo[a]pyrene (13C4, 99%) were obtained from LGC Promochem GmbH (Wesel, Germany). 9-Fluorobenzo[k]fluoranthene (FBkF), which was used as an injection standard, was purchased from Chiron AS (Trondheim, Norway). Certified standard reference material® 2260a (aromatic hydrocarbons in toluene) was purchased from NIST (Maryland, USA). Stock solution of the individual PAHs were gravimetrically prepared in toluene.
Equipment
A pressurised liquid extractor ASE 300 (Dionex, Sunnyvale, CA, USA) was used for the extraction of the samples. An automated gel permeation chromatography (GPC) system of LCTech (Dorfen, Germany) equipped with a GCP column (25 mm id, 320 mm length) was filled with 50 g Bio-Beads S-X3 from Bio-Rad Laboratories (Hercules, CA, USA). A FW-20 UV detector (LCTech) operated at 254 nm and an automated concentrator CPC 2000-II Vacuumbrand (Wertheim, Germany) was used for the first step of the sample purification. Samples were evaporated after PLE on a Turbo Vap® workstation (Zymark, Hopkinton, MA, USA), respectively, after SPE on a Techne Sample Concentrator Dri-Block® DB-3D (Bibby Scientific, Staffordshire, UK).
A gas chromatograph (GC) HP 6890N (Agilent Technologies, Santa Clara, CA, USA) with programmable temperature vaporisation (PTV) injection port (septumless head) equipped with a J&W Select PAH GC column (15 m × 150 μm × 0.10 μm; Agilent Technologies) was used for the analysis of the target PAHs. The GC was coupled to an Agilent 5975B single quadrupole mass spectrometer (Agilent Technologies) operated in electron ionisation (EI) mode at 70 eV. Injection was carried out using an automated GC PAL injection system (CTC Analytics, Zwingen, Switzerland). Acquired data were evaluated by MSD ChemStation E.02.00.493 (Agilent Technologies).
Sample preparation
For botanical and propolis food supplements, 5 g of sample was weighed and mixed with 5 g of polyacrylic acid and 15 g of sand. The test portion was spiked with 200 μl of a mix of 13C-labelled analogues of the four target PAHs (125 ng/ml), homogenised and transferred to the 33 ml PLE extraction cell. In case of products in very fine powder form, two filters were used instead of one and a layer of Celite® was placed on the bottom of the cell. The extraction was carried out with n-hexane at 100°C in 2 cycles of 10 min static time with 60% purge volume and 120 s purge time. After the extraction the extract was evaporated in a Turbo Vap® workstation at 40°C using a steam of nitrogen to a small volume of approximately 0.5 ml. The concentrated extract was brought up to 5 ml with a mixture of cyclohexane:ethyl acetate (1:1 v/v), filtered through a PTFE filter and cleaned up by GPC. For the GPC separation 5 ml of the sample was injected and eluted by cyclohexane:ethyl acetate (1:1 v/v) at a flow rate of 4 ml/min. The PAH-containing fraction was collected between 36 and 63 min of the 85 min total run time and concentrated to 4 ml by an automated concentrator integrated in the GPC system. After the addition of 200 μl of toluene as a keeper, the extract was gently evaporated by a stream of nitrogen at 40°C in the sample concentrator to 200 μl. The evaporated extract was diluted with 800 μl of cyclohexane to a final volume of 1 ml. Consecutive clean-up was performed by SPE on silica. The SPE cartridge was conditioned with 2 ml of cyclohexane, then the sample was loaded and PAHs were eluted with 10 ml of cyclohexane. The collected SPE fraction was evaporated to 200 μl with a stream of nitrogen at 40°C and transferred to a GC autosampler vial while rinsing the collection tube with an additional volume of 200 μl of toluene. Finally, 100 μl of injection standard solution (FBkF, 80 ng/ml) was added into the autosampler vial and the sample was analysed by GC-MS.
For fish oil and other edible oil food supplements, 1 g of the sample was weighed directly to the GPC vial, 200 μl isotopically labelled 4PAHs solution added and the final volume adjusted to 5 ml by dissolving with cyclohexane:ethyl acetate mixture (1:1, v/v). The prepared test portion was directly applied for GPC clean up. Further sample treatment was carried out as described above.
For each batch of samples, a procedural blank was prepared to assess interferences deriving from the applied reagents and apparatus. The system was considered suitable for the analysis of food supplement samples if the analyte content in the procedural blank did not exceed the limit of detection of the method. A well-defined quality control sample, St. John’s Wort, was included in each sample batch, for checking the method performances along time. All samples were processed in duplicate.
GC/MS analysis
For the GC/MS analysis, 10 μl of sample extract was injected into the PTV injector in split-vent mode at an initial temperature of 55°C for 0.5 min at a vent flow of 100 ml/min; the temperature was then ramped up at 600°C/min to 400°C with a 15 min static time. Helium was used as carrier gas at a flow rate of 1 ml/min, and the transfer line temperature was set to 325°C. The oven temperature programme was as follows: initial temperature 60°C hold for 1 min, 60°C/min till 180°C (held for 0 min), 4°C/min till 240 (held for 0 min), 28°C/min till 280°C (held for 3 min), 14°C/min till 325°C (held for 10 min). PAHs were detected in selected ion monitoring mode (SIM) recording the m/z values: 8–20 min m/z 114, 226, 228 for BaA and CHR, m/z 116, 234 for 13C6-BaA and 13C6-CHR, 2035 min m/z 126, 250, 252 for BbF and BaP, m/z 129, 258 for 13C6-BbF, m/z 128, 256 for 13C4-BaP and m/z 135, 270 for FBkF.
Results and discussion
Method performance
The method used for the determination of the four EU marker PAHs is routinely used in the EURL PAHs and is accredited according to EN ISO/IEC 17025:2005 (ISO Citation2005; BELAC Citation2013). The performance of the method was validated for several types of food matrices including food supplements for the working range of 0.5–12.5 μg/kg. In case the analyte content was above the method working range, the sample intake was lowered. The limit of detection (LOD) and limit of quantification (LOQ) of the method was set to 0.25 and 0.5 μg/kg for the individual PAHs, respectively. The combined relative standard uncertainties for individual PAHs at content levels of 0.9 and 11.1 μg/kg taking into account the contributions of intermediate precision, calibration, standard solutions and trueness. The estimated combined relative standard uncertainties were for all analytes compliant with the “fitness-for-purpose” approach defined in Commission Regulation (EU) No. 836/2011 (EU Citation2011b). The expanded uncertainty was obtained by multiplying the combined standard uncertainty by a factor of two, which provides a confidence level of 95% ().
Table 2. Relative standard uncertainties and relative expanded uncertainties for the whole method working range.
Quality control tools
The determination of low quantities of PAHs in complex matrices needs a comprehensive set of quality assurance tools to prove the reliability of analytical results. Certified reference materials (CRMs) are most suitable for method performance verification as they provide the best estimate of the true value and its uncertainty. The availability of CRMs for PAHs in food matrices is limited; they currently comprise food matrices such as mussels, fish, tuna and coconut oil.
Hence, a well-characterised proficiency test material, comprising St. John’s Wort, was used for monitoring of the performance of the analysis method. The assigned values were 2.98 ± 0.62 μg/kg for BaB, 4.07 ± 0.83 μg/kg for CHR, 2.92 ± 0.60 μg/kg for BbF and 1.65 ± 0.36 μg/kg for BaP. The material was left over from a proficiency test organised by the EURL PAH in 2011. This quality control sample was analysed with each batch of samples and the obtained results were inserted into QC charts. A means to assess the agreement of the measured results with the assigned values are zeta-scores, calculated as the difference between the measured value and the assigned value divided by the quadratically propagated standard uncertainty of the measured value and of the assigned value. The warning limit was set to a value of ±2 and the action limit to ±3 (). Measured values over the whole duration of the study did not exceed the warning limit; hence, the method was regarded as being under control.
Figure 1. Example of quality control chart for benzo[a]pyrene measured in quality control sample (St. John’s Wort).
![Figure 1. Example of quality control chart for benzo[a]pyrene measured in quality control sample (St. John’s Wort).](/cms/asset/7b6ed7ae-ed56-49fc-a3e7-0610af1461fa/tfac_a_1087059_f0001_b.gif)
An important factor in chromatography is selectivity. Criteria for mass spectrometric detection as laid down in Commission Decision 2002/657/EC were applied for the assessment of selectivity even though those requirements are, strictly speaking, applicable to residues in products of animal origin only (EC Citation2002). Accordingly, at least three ions had to be monitored for the identification and confirmation of the target analytes. Maximum permitted tolerances for relative ion intensities expressed as a percentage of the intensity of the most intense ion (base peak) were defined for the measured mass/charge ratios and applied as identification criteria (). A chromatographic peak eluting at the retention time of a target PAH was not considered identified, unless all qualifier ions were present and the ratios between quantifier (base peak) and qualifier ions were within the acceptable range.
Table 3. Quantifier and qualifier ions of the four target PAHs with respective ratios and calculated relative permitted tolerance for the analyte identification.
As there is a lack of CRMs for PAHs in food supplements, the trueness of the method was verified via spiking experiments for three classes of food supplements (botanical supplement, fish oil, propolis extract). The group of botanical food supplement was represented by sample No. 30 (Maqui Berry), fish oil by sample No. 34 and propolis extract by sample No. 77 (Propolis herbal elixir). The three samples were spiked with a mix of the four target PAHs in toluene so as to double the native content, properly mixed, and left standing overnight to evaporate the residual solvent. Both native and spiked samples were analysed in five replicates. An absolute difference of the nominal (spiked) content value and the measured value of less than two times the standard measurement uncertainty was defined as acceptance criterion. The agreement between the measured levels and the expected results was acceptable for all analytes. The calculated recoveries were in the range of 92.8%–103.2% for botanical food supplement, 91.4%–101.0% for fish oil and 92.9%–105.2% for propolis extract.
Calibration standards prepared from neat substances were checked against NIST SRM® 2260a in order to verify the correctness of instrument calibration (). Linearity of the calibration curves was verified by applying Mandel’s test and visual inspection of the plot of residuals. Mandel’s tests were passed for all four target analytes at the 99% confidence level and no trend was observed in any plot of residuals.
Figure 2. Example of calibration for benzo[a]pyrene prepared from calibration standards and SRM® 2260a.
![Figure 2. Example of calibration for benzo[a]pyrene prepared from calibration standards and SRM® 2260a.](/cms/asset/de954ce2-45c6-4a78-8615-1e44918a7210/tfac_a_1087059_f0002_b.gif)
In addition to recoveries determined from spiked samples, recoveries of PAHs in commercial food supplement samples were assessed for each individual sample by means of the recovery of labelled PAHs, whose analytical behaviour was considered similar to that of native PAHs. Recoveries of labelled PAHs were calculated from the relative response factors of the labelled PAHs and the injection standard (FBkF). Recovery values between 50% and 120% were considered acceptable. Results were not reported if this recovery interval was not met.
PAHs in food supplements
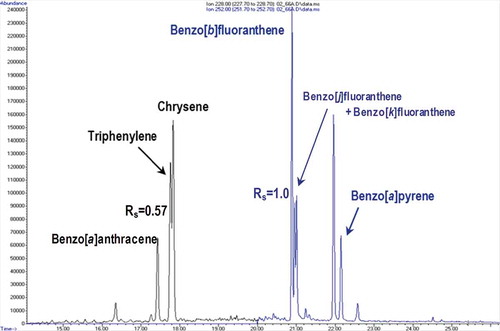
When analysing complex samples such as food supplements, many other matrix components are unavoidably co-extracted together with the target analytes. Oils, waxes, essential oils and natural pigments such as carotenoids and chlorophylls are the most typical matrix components occurring in extracts obtained from samples of plant origin. Taking into account the complexity and variety of food supplements (e.g. powder, oils, liquids), a robust method based on pressurised liquid extraction (PLE), size exclusion chromatography and solid-phase extraction (SPE) was applied. Special care had to be paid to the products in very fine powder form as during the PLE extraction some of those samples tend to cross the PLE cell and block the extractor tubes and capillaries. The most critical aspect when using a GC for separation of target PAHs is co-elution with other PAHs present in the sample (Poster et al. Citation2006; Gómez-Ruiz & Wenzl Citation2009). By using the PAH Select® capillary column, resolution problems were partly resolved; however, full baseline separation of some of the target PAHs from interferents was not achieved; namely, the peaks of triphenylene and chrysene, and benzo[b]fluoranthene–benzo[j]fluoranthene and benzo[k]fluoranthene still overlapped partially ().
Figure 3. (colour online) Chromatographic separation of 4 target PAHs in food supplement of Ginkgo biloba with calculated chromatographic resolution (Rs) for critical pairs of PAHs (m/z 228 and m/z 252).
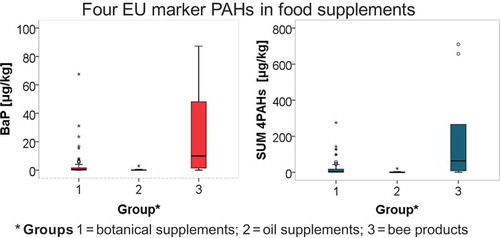
The levels of the four EU marker PAHs measured in the food supplements purchased on the European market are summarised in . In general, a huge variation between the products was observed with contents ranging from <0.25 to 87.3 μg/kg for BaP and from <0.25 to 709.4 μg/kg for ΣPAH4. Content levels below the method LOD or LOQ were found in a significant number of products. Overall, 48% of samples did not exceed the level of 0.5 μg/kg for BaP and 28% for PAH4.
Table 4. Measured concentrations (μg/kg) of four EU marker PAHs in food supplements products and their sum (ƩPAH4) including the measurement uncertainties (μg/kg).
All values below the LOD or LOQ were replaced by zero in order to describe the whole sample set by descriptive statistics (lower bound), including arithmetic mean, median, 90th percentile and the 95th percentile. The arithmetic mean value calculated for ΣPAH4 was 35.8 μg/kg, median 3.4 μg/kg, 90th percentile 95.0 μg/kg and 95th percentile 133.3 μg/kg. For BaP only were following values calculated: arithmetic mean 5.2 μg/kg, median 0.54 μg/kg, 90th percentile 12.0 μg/kg and 95th percentile 26.2 μg/kg. Out of the 4 EU marker PAHs chrysene was most abundant, ranging from <0.25 to 280.1 μg/kg with a mean of 13.6 μg/kg, median 1.4 μg/kg and 90th percentile 36.9 μg/kg. For calculation of upper bound arithmetic mean and median, values below the LOD or LOQ were replaced by the respective LOD (0.25 μg/kg) and LOQ (0.5 μg/kg) levels. In this case the arithmetic mean for ΣPAH4 and BaP was 36.3 μg/kg and 5.4 μg/kg and median 3.5 μg/kg and 0.54 μg/kg, respectively. The highest PAH concentrations were determined in two samples of propolis extract (sample nos. 78 and 61) and spirulina powder (sample no. 88), in which ΣPAH4 reached the levels of 709.4, 656.9 and 275.2 μg/kg, respectively.
Products collected in EU member states were categorised into three groups: botanical and herbal food supplements, fish and edible oils, and propolis and bee products. Based on the results fish and edible oil food supplements could be assumed as low contaminated. Determined values for BaP in this group of products ranged from <0.25 to 3.0 μg/kg (mean <0.5 μg/kg, 90th percentile 0.56 μg/kg) and ΣPAH4 varied between <0.25 and 20.9 μg/kg (mean 2.4 μg/kg, 90th percentile 4.4 μg/kg). However, some oil-based food supplements would exceed EU maximum levels at present applicable to edible oils and fats intended for direct human consumption or used as an ingredient in food (2.0 µg/kg BaP and 10.0 µg/kg ΣPAH4). Most fish oil samples did not exceed the LOQ level. The low contamination of fish oil might be explained by the ability of fish to metabolise PAHs (Ramalhosa et al. Citation2012). Others edible oil-based products did not contain any of the target PAHs, except few products of garlic oil mixed with soybean or sunflower oil (ΣPAH4 levels up to 4.1 μg/kg), sea buckthorn oil (ΣPAH4 level 20.9 μg/kg) and two multicomponent products containing oil from apricot kernel. Sources for contamination of edible oils with PAHs might be artificial drying of oil seeds and heating during oil production and processing. However, contamination should be avoided by precautionary measures such as indirect drying and good temperature control (Moret & Conte Citation2000).
Propolis and bee products were highly contaminated, in which the concentration of BaP ranged from <0.25 to 87.3 μg/kg (mean 25.9 μg/kg, median 10.0 μg/kg, 90th percentile 84.6 μg/kg) and ΣPAH4 from <0.25 to 709.4 μg/kg (mean 188.2 μg/kg, median 63.2 μg/kg, 90th percentile 662.2 μg/kg). These amounts were approximately in the same range of those found in propolis extracts from Italy published by Moret et al. (Citation2010) (BaP <0.3–41.8 μg/kg). Propolis is a sticky, resinous substance collected by bees from different kinds of trees and plants, variable in colour and composed of resins, waxes, volatile oils, pollen, vitamins, minerals and plant chemicals, especially concentrated flavonoids. The main source of propolis contamination represents environmental pollution due to combustion processes, industrial and vehicle emissions. Besides that, sometimes bees collect man-made materials of similar consistency, such as road tar or varnish (Bees Citation2014). The level of PAH contamination could also be influenced by beekeeper practices, especially smoking the hive before honey collection (Moret et al. Citation2010).
ΣPAH4 occurred in the group of botanical and herbal food supplements without any systematics ranging from <0.25 to 275.2 μg/kg (mean 21.0 μg/kg, median 3.2 μg/kg, 90th percentile 52.2 μg/kg). ΣPAH4 levels varied also within the same type of products. There was no evidence of contamination of certain kinds of products which could support any concrete conclusions. The principal pathway for contamination of fruits and vegetables with PAHs is gas and particle deposition, while in some cases a considerable uptake of PAHs from soil was monitored (Rojo Camargo & Toledo Citation2003). Fruits and vegetables growing in highly industrialised areas or near roadways, or irrigated with wastewater generally showed higher levels than those from rural areas (Khan et al. Citation2008). Another source of PAH contamination is from the processing techniques, mainly inappropriate drying processes. Furthermore, relatively low PAH levels in botanical material may become magnified when subjected to concentration steps during production, which also concentrate PAHs (Danyi et al. Citation2009). Our findings confirmed the observation of non-systematic ΣPAH4 values measured in botanical supplements, as the contamination is connected with environmental pollution and processing techniques.
In addition to analysed food supplements products available on the European market, the PAH contamination of food supplements was examined on randomly selected products from an Indian market. Eleven mainly multicomponent food supplements with botanicals or oil ingredients were collected and analysed for ΣPAH4 content. Measured levels of ΣPAH4 varied within <0.25 and 15.4 μg/kg, with the lower bound arithmetic mean of 2.8 μg/kg. The majority of Indian samples (67%) did not contain BaP, only one oil product (wheat germ/cod liver oil) contained 7.8 μg/kg. The lower bound arithmetic mean calculated for BaP was 0.9 μg/kg. PAH contamination of Indian food supplements did not show any differences compared to European food supplements ().
The relevance of exposure to PAHs by food supplements is frequently questioned due to their low consumption if compared to other food categories such as edible oils or seafood. However, to clarify this point, the potential intake of PAHs was evaluated for the 10 most contaminated products analysed in this study (). The manufacturers’ maximum recommended dose was used for intake calculation and results were compared to general dietary exposure estimates. EFSA (Citation2008) estimated the overall average dietary exposure to ΣPAH4 across European countries to 1168 ng/day and average exposure to BaP to 235 ng/day. EFSA identified cereals and cereal products and seafood and seafood products as the two highest contributors to dietary exposure with ΣPAH4 values of 257 ng/day and 289 ng/day, respectively (EFSA Citation2008). The highest hypothetical daily intakes of BaP and ΣPAH4 were determined among the studied food supplements for product no. 88 “Premium Spirulina” with 608 ng/day BaP and 2477 ng/day ΣPAH4, respectively. The high exposure through this product is apparently caused by the high daily dosage (9.0 g/day) recommended by the manufacturer. The second highest ΣPAH4 intake estimation was calculated for product no. 61 “Propolis intense” with a value of 1486 ng/day. With an exception of propolis no. 87, the estimated daily intake of ΣPAH4 was for the other eight products in the range between about 200 and about 260 µg/kg. Based on the assumptions that spirulina product no. 88 is consumed at the maximum recommended dose, it may be concluded that the average daily exposure to ΣPAH4 would be more than twice as much as the exposure due to consuming an average diet. The daily intake through each of the next eight highest contaminated food supplement products would contribute to the average daily exposure to PAHs at the same level as EFSA concluded for cereal or seafood products (EFSA Citation2008).
Table 5. Examples of daily intake levels of BaP and ΣPAH4 by the 10 most contaminated food supplements when assuming an intake of the maximum daily dose recommended by the manufacturers.
Literature data on PAHs in food supplements were in good agreement with those observed in this survey. Data collected from different European countries reported by EFSA (Citation2008) covered overall 325 food supplement products. The arithmetic mean reported for BaP was 2.5 μg/kg and the maximum value 270 μg/kg, with 46% of the samples showing detectable levels of this compound. The highest contents were found for CHR with an arithmetic mean of 9.1 μg/kg and a maximum of 590 μg/kg. The maximum PAH content was recorded for a product named “Arkopharma thé noir”, the second highest for a spirulina product and the third highest for a propolis extract (EFSA Citation2008).
Chrysene was also the most abundant among ΣPAH4 in dietary supplements studied by FSA (Citation2005). With very few exceptions, PAHs were undetected or rarely present in fish oils. The highest concentration of BaP was found in a spirulina sample (44 μg/kg).
In the Dutch study on food supplements running from 2003 to 2007, BaP was present in 44% of food supplements with a mean level of 3.4 μg/kg. In a follow-on survey (2008 to 2009), 63% of the food supplements contained BaP with a mean value of 5.3 μg/kg (Martena et al. Citation2011).
PAH levels in propolis-based supplements are overall relatively high. Raw propolis samples collected in Italy in 2008 contained quite variable PAH amounts, with BaP ranging from 0.7 to 1371 μg/kg. However, CHR was always the most abundant PAH with amounts between 4.7 and 3176 μg/kg. Lower levels of BaP were found in propolis extracts ranging from below LOQ to 41.8 μg/kg (Moret at al. Citation2010). High levels of CHR in propolis and royal jelly samples were observed also in the Dutch market study in 2008 and 2009, where the mean concentration of CHR was 58.4 μg/kg compared to BaP of 7.6 μg/kg. Certain food supplements when used at the maximum recommended dose, especially those with botanicals or propolis, can contribute significantly to dietary PAH exposure. However, when the lower bound mean of ΣPAH4 was assumed, the estimated PAH intake was found to be less substantial. In this case food supplements will be at the lower end of the range of contributions among the food groups that contribute only modestly to ΣPAH4 exposure (Martena et al. Citation2011).
Conclusions
In this study the applicability of a stable-isotope dilution GC/MS method was evaluated for the determination of the four EU marker PAHs in various kinds of food supplements. A stringent quality control programme was applied in the analysis of commercial food supplements comprising oil-, botanical- and bee product-based food supplements to ensure the generation of reliable occurrence data.
The analysed food supplements showed significant variability in PAH levels. The levels for ΣPAH4 ranged between below <0.25 and 709.4 μg/kg. The priority PAH with the highest arithmetic mean content was chrysene with a value of 13.6 μg/kg and a maximum level of 280.1 μg/kg. Propolis extracts and bee products were more highly contaminated compared to other products with a ΣPAH4 mean value of 188.2 μg/kg. Low contents of ΣPAH4 (mean 2.4 μg/kg) were determined in fish and edible oil supplements. No specific tendency in PAH contamination was found for botanical products. Many of the analysed products did not contain the target PAHs at levels exceeding the LOQ.
Nevertheless, in some samples, considerably high ΣPAH4 amounts were found, which could remarkably increase the daily exposure of consumers to PAHs. This is in agreement with literature data, demonstrating the need for continuous monitoring of ΣPAH4 in food supplements. Sources of contamination should be identified for highly contaminated products and remediating measures taken.
Disclosure statement
No potential conflict of interest was reported by the authors.
References
- Bees for Development. © 2014. Monmouth (UK); [ cited 2014 Nov 15]. Available from: http://www.beesfordevelopment.org/what-we-do/information-and-education/info/category/67-propolis.
- [BELAC] Belgian Accreditation Body. 2013. Accreditation Certificate 268-TEST. [ cited 2014 Dec 15]. Available from: https://ec.europa.eu/jrc/sites/default/files/BELAC%20Annex%20to%20268-TEST.pdf?search.
- [COM] Commission of the European Communities. 2008. Report from the Commission to the Council and the European Parliament on the use of substances other than vitamins and minerals in food supplements. Brussels: COM; p. 824.
- Danyi S, Brose F, Brasseur C, Schneider Y-J, Larondelle Y, Pussemier L, Robbens J, De Saeger S, Maghuin-Rogister G, Scippo M-L. 2009. Analysis of EU priority polycyclic aromatic hydrocarbons in food supplements using high performance liquid chromatography coupled to an ultraviolet, diode array or fluorescence detector. Anal Chim Acta. 633:293–299.
- [EC] European Commission. 2002. Commission decision 2002/657/EC of 12 Autust 2002 implementing Council Directive 96/23/EC concerning the performance of analytical methods and the interpretation of results. Off J Eur Union. L221:8.
- [EC] European Commission. 2005. Commission Regulation (EC) No 208/2005 of 4 February 2005 amending Regulation (EC) No 466/2001 as regards polycyclic aromatic hydrocarbons. Off J Eur Union. L34:3.
- [EC] European Commission. 2006. Commission Regulation (EC) No 1881/2006 of 19 December 2006 setting maximum levels for certain contaminants in foodstuffs. Off J Eur Union. L364:5.
- [EC] European Commission. 2009. Commission Regulation (EC) No 1170/2009 of 30 November 2009 amending Directive 2002/46/EC of the European Parliament and of council and Regulation (EC) no 1925/2006 of the European Parliament and of the Council as regards the lists of vitamin and minerals and their forms that can be added to foods, including food supplements. Off J Eur Union. L314:36.
- [EFSA] European Food Safety Authority. 2008. Scientific opinion of the panel on contaminants in the food chain on a request from the European Commission on polycyclic aromatic hydrocarbons in food. EFSA Journal. 724:1–114.
- [EU] European Union. 2011a. Commission Regulation (EU) No 835/2011 of 19 August 2011 amending Regulation (EC) No 1881/2006 as regards maximum levels for polycyclic aromatic hydrocarbons in foodstuffs. Off J Eur Union. L214:5.
- [EU] European Union. 2011b. Commission Regulation (EU) No 836/2011 of 19 August 2011 amending Regulation (EC) No 333/2007 layig down the methods of sampling and analysis for the official control of the levels of lead, cadmium, mercury, inorganic tin, 3-MCPD and benzo(a)pyrene in foodstuffs. Off J Eur Union. L215:9.
- [FSA] Food Standard Agency. 2005. PAHs in dietary supplements. Food Survey Inforamtion Sheet 86/05. Available from: http://tna.europarchive.org/20110116113217/http://www.food.gov.uk/multimedia/pdfs/fsis8605.pdf
- Gómez-Ruiz J, Wenzl T. 2009. Evaluation of gas chromatography columns for the analysis of the 15 + 1 EU-priority polycyclic aromatic hydrocarbons (PAHs). Anal Bioanal Chem. 393:1697–1707.
- Harvey RG. 1997. Polycyclic aromatic hydrocarbons. New York (NY): Wiley-VCH.
- Howsam M, Jones K. 1998. Sources of PAHs in the environment. In: Neilson A, editor. PAHs and related compounds. Heidelberg (Germany): Springer; p. 137–174.
- [IARC] International Agency for Research on Cancer. © 2014. Lyon (France); [ cited 2014 Nov 19]. Availabel from: http://www.iarc.fr/.
- [ISO] International Organisation for Standardization. 2005. General requirements for the competence of testing and calibration laboratories. ISO/IEC 17025:2005. [ cited 2014 Dec 15]. Available from: http://www.iso.org/iso/home.htm
- Khan S, Aijun L, Zhang S, Hu Q, Zhu Y-G. 2008. Accumulation of polycyclic aromatic hydrocarbons and heavy metals in lettuce grown in the soils contaminated with long-term wastewater irrigation. J Hazard Mater. 152:506–515.
- Martena MJ, Grutters MMP, De Groot HN, Konings EJM, Rietjens IMCM. 2011. Monitoring of polycyclic aromatic hydrocarbons (PAH) in food supplements containing botanicals and other ingredients on the Dutch market. Food Addit Contam: Part A. 28:925–942.
- Moret S, Conte LS. 2000. Polycyclic aromatic hydrocarbons in edible fats and oils: occurrence and analytical methods. J Chrom A. 882:245–253.
- Moret S, Purcaro G, Conte LS. 2010. Polycyclic aromatic hydrocarbons (PAHs) levels in propolis and propolis-based dietary supplements from the Italian market. Food Chem. 122:333–338.
- Poster DL, Schantz MM, Sander LC, Wise SA. 2006. Analysis of polycyclic aromatic hydrocarbons (PAHs) in environmental samples: a critical review of gas chromatographic (GC) methods. Anal Bioanal Chem. 386:859–881.
- Ramalhosa MJ, Paíga P, Morais S, Ramos S, Delerue-Matos C, Oliveira MBPP. 2012. Polycyclic aromatic hydrocarbon levels in three pelagic fish species from Atlantic Ocean: inter-specific and inter-season comparisons and assessment of potential public health risks. Food Chem Tox. 50:162–167.
- Rojo Camargo MC, Toledo MCF. 2003. Polycyclic aromatic hydrocarbons in Brazilian vegetables and fruits. Food Control. 14:49–53.
- [SCF] Scientific Committee on Food. 2002. Opinion of the Scientific Committee on Food on the risks to human health of polycyclic aromatic hydrocarbons in food. SCF/CS/CNTM/PAH/29 Final. Brussels: European Commission. Health and Consumer Protection Directorate-General. Directorate C – Scientific Opinions.