Abstract
Yields of tea flower polysaccharides (TFPS) were investigated by ethanol fractional precipitation and stepwise precipitation and the monosaccharide composition of TFPS was investigated by ion chromatography(IC). Furthermore, a preliminary study on bioactivities of TFPS was discussed. The result indicated that the molecular weight distribution of TFPS was wide. Results of ethanol fractional precipitation and stepwise precipitation suggested that most of polysaccharides were precipitated when the final concentration of ethanol was adjusted to 30% (v/v). TFPS contained acid polysaccharides and it was composed of rhamnose, arabinose, galactose, glucose, xylose, mannose, GalA, and GluA with a molar ratio of 4.95:11.57:11.89:4.26:1.31:1.98:8.41:1.0. Furthermore, TFPS exhibited strong inhibitory effect on α-glucosidase and proliferation effect on lymphocytes.
Los rendimientos de polisacáridos de flor de té (TFPS) se investigaron a través de precipitación fraccionada con etanol y precipitación gradual y la composición de monosacáridos de polisacáridos de flor de té se investigó con cromatografía iónica (IO). Además, un estudio preliminar en bioactividades de polisacáridos de flor de té se discutió. El resultado indicó que la distribución de peso molecular de polisacáridos de flor de té fue amplia. Los resultados de la precipitación fraccionada con etanol y de la precipitación gradual sugirieron que la mayoría de los polisacáridos se precipitaron cuando la concentración final de etanol se ajustó a 30% (v/v). Los polisacáridos de flor de té contenían polisacáridos ácidos y estaban compuestos de ramnosa, arabinosa, galactosa, glucosa, xilosa, manosa, GalA y GluA con una proporción molar de 4,95:11,57:11,89:4,26:1,31:1,98:8,41:1,0. Además, los polisacáridos de flor de té mostraron un fuerte efecto inhibidor de α-glucosidasa y efecto de proliferación de linfocitos.
Introduction
Tea is the most popular beverage worldwide (Anesini, Ferraro, & Filip, Citation2008; Krafczyk & Glomb, 2008; Sultana et al., Citation2008; Tsubaki, Iida, Sakamoto, & Azuma, 2008). In our daily life, we enjoy the delightful tea beverages prepared from the leaf-buds of the glossy evergreen shrub. Compared with leaves, tea flowers have similar chemical components. In a previous study, tea flowers contained many nutrition compounds, such as protein, sugar, vitamin, amino acid, tea polyphenols and caffeine (Yang, Xu, Jie, He, & Tu, Citation2007). Lin, Wu, and Lin (Citation2003) demonstrated that the flowers of Camellia sinensisincluding Taiwan Tea Experiment Station #12 (TTES #12) contained catechins and caffeine in a quantity approaching that of tea leaves. Furthermore, tea flower extract also showed potency of hydroxyl radical scavenging and the ability to suppress LPS-induced NO production in macrophages. From the agro-economic point of view, tea flowers are also of important application value as leaves. For a long time, however, there are very few studies about the tea flowers.
Wei et al. (Citation2010) found that polysaccharides are the main effective components in tea flowers, accounting for a comparative large proportion. So, the studies and application of tea flower polysaccharides (TFPS) are also becoming valuable.
This article describes the experiments to extract polysaccharides from tea flowers, to study the effect of various ethanol precipitation procedures on the yield and to find out the optimized ethanol concentration for attaining the highest TFPS yield. The aim is to reduce the cost of industrial TFPS and to offer direction for the research on the technology of camellia polysaccharides extraction.
Experimental
General
Tea flowers were obtained commercially from Henan province of China. Standard monosaccharide (glucose, xylose, arabinose, rhamnose, and fructose) were purchased from Sigma. m-Hydroxyl biphenyl was purchased from Fluka Co. (MO, USA) and α-glucosidase was purchased from Sigma Co. (MO, USA). p-Nitrophenol-α-d-glucopyranose was purchased from Xibao Co. (Shanghai, China). Reduced glutathione, 1640 cell culture medium, coomassie brilliant blue G-250 and bovine serum albumin were provided from Sinopharm Chemical Reagent Co. (Shanghai, China). All other reagents and solvents were of analytical reagent grade and used without further purification unless otherwise noted. All aqueous solutions were prepared using newly double-distilled water. The polysaccharide was determined by phenol–sulfuric acid method, with an UV-Vis spectrophotometer (Beijing Purkinje General Instrument Co., Ltd., P.R. China). The protein content was measured by the coomassie brilliant blue G-250 method. Saccharimeter was used to measure the soluble solid contents of the tea flower water-extracted solution.
Determination of extract with various concentrations
Two-hundred and sixty grams of dry tea flowers, cut into small pieces, were extracted with 10 times volume deionized water and incubated in boiling water bath for 2 h, and the treatment was repeated two times. Then the extracts were centrifuged to remove the contaminants. The filtrates were concentrated to proper volumes via a rotary evaporator under reduced pressure.
Concentrated tea flower extract solution was divided evenly into five groups. In order to test soluble solid content of 24, 20, 16, 12, and 8% by saccharimeter, concentrated tea flower extract solution was added with appropriate volume of distilled water. Subsequently, the five solutions were all precipitated by adding 3.0 volumes of 95% (v/v) ethanol at 4°C for 24 h, and then centrifuged (4500 g, 15 min). The precipitate was vacuum freeze-dried.
Ethanol fractional precipitation
Two-hundred and sixty grams of dried tea flowers, cut into small pieces, were extracted with 10 times volume deionized water and incubated at 85°C for 2 h, and the treatment was repeated two times. Then the extracts were centrifuged to remove the contaminants. The filtrates were concentrated to have soluble solid content of 20% measured by saccharimeters in a rotary evaporator under reduced pressure.
Concentrated tea flower extract solution was divided evenly into nine groups and was precipitated at ethanol concentrations of 10%, 20%, 30%, 40%, 50%, 60%, 70%, 80%, and 90% (v/v), respectively. The precipitate was vacuum freeze-dried.
Ethanol stepwise precipitation
Two-hundred and sixty grams of dried tea flowers, cut into small pieces, were extracted with 10 times volume deionized water and incubated in boiling water bath for 2 h, and the treatment was repeated twice. Then the extracts were centrifuged to remove the contaminants. The filtrates were concentrated to have soluble solid content of 20% measured by saccharimeters in a rotary evaporator under reduced pressure.
Ethanol, the final concentration of which was adjusted to 10% (v/v), was added into the above concentrated extract solution in order to make TFPS precipitated. After the centrifugal separation, the precipitate was collected and ethanol (final concentration 20% v/v) was added to the supernatant to result in precipitate which was again collected. The same precipitation procedures were repeated by adding successively 30, 40, 50, 60, 70, 80, and 90% (v/v) ethanol. The precipitates obtained in each successive step were vacuum freeze-dried for further study.
Analysis of monosaccharide composition of tea flower polysaccharides
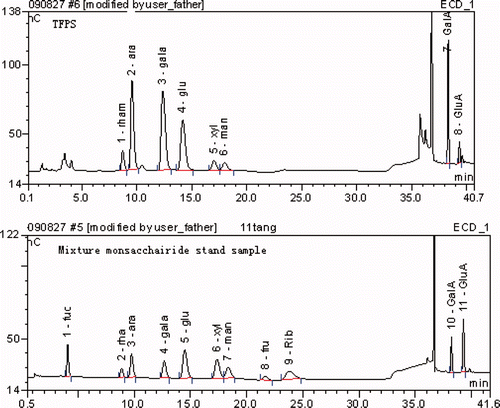
Polysaccharide samples (2 mg) were dissolved in 4 ml of 2 mol/L trifluoroacetic acid solution (TFA) and hydrolyzed at 110°C for 6 h. The hydrolysates of TFPS were evaporated at less than 40°C. TFA was removed by washing four times with methanol (3 ml), in order to remove TFA completely. The dried hydrolysates were dissolved with ultra pure water and diluted to 100 ml, and then measured by diluting 10-fold again (Yang, Zhang, Tang, & Pan Citation2005). Ion chromatography (IC) was used for the identification and quantification of monosaccharide. IC experiment was performed on a Dionex ICS2500 chromatographic system (CA, USA) with a Dionex pulsed amperometric detector equipped with an Au electrode, a Dionex Carbopac PA20 column (150 mm×3 mm). The temperature was kept at 30°C and the injection volume was 25 μl. The eluent was NaOH (2 mmol/L) at a flow rate of 0.45 ml/min.
Determination of α-glycosidase inhibitory activity
The α-glucosidase inhibitory activity of tea flower polysaccharide was determined according to the chromogenic method described by Tremblay et al with slight modifications (Chapdelaine, Tremblay, & Dube, Citation1978).The substrate solution p-nitrophenyl α-d-glucopyranoside (pNPG) was prepared with 0.1 M Na-phosphate buffer (pH 6.8). The reaction mixture was described as follows: 0.1 mol/L Na-phosphate buffer (pH 6.8), 2 mL; 5 mg/mL TFPS solution, 20 μL; 1 mg/mL reduced glutathione, 50 μl; 1 U/μL α-glucosidase, 20 μL. The mixed solution was incubated at 37.5°C for 10 min. The enzymatic reaction was initiated by adding saturated pNPG and the reaction mixture was incubated for another 30 min at 37.5°C. The catalytic reaction was terminated by addition of 10 mL of 0.1 M Na2CO3solution. Both the reaction system without polysaccharides and the system without α-glucosidase were used as background test. The Na-phosphate buffer (pH 6.8) was used as zero-setting solution for determination of the absorbance at the wavelength of 400 nm. The inhibitory rate of sample on α-glucosidase was calculated by the following formula.
Determination of immunological activity in vitro
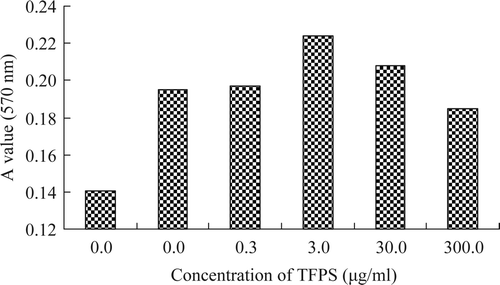
Cell culture method was adopted to determine the effect of TFPS on mice splenic lymphocyte in vitro. The lymphocytes were seeded into 96 well plates divided into 3 experimental groups of blank control (CK) group, TFPS group. Each experimental group was added with the sample solution at gradient final concentrations of 0.03, 0.3, 3, 30, 300 μg/mL and repeated for four wells. The results are represented in the form of “mean number±standard deviation”.
The spleen was removed under aseptic condition, chopped and washed through screen mesh (200 meshes) with sterile normal saline and centrifuged at 2000 r/min for 5 min for 3 times. The precipitation of spleen cells were suspended with 1 mL of complete culture medium and seeded at 2 × 10⁶cell/mL per well into 96 well plates. Some wells of the cell culture were added with tea flower polysaccharides. The cells were incubated at 37°C for 72 h in a humidified atmosphere of 5% CO2in air. Ten microliters of 5 mg/mL MTT was added into the cell culture per well at the 68th h, incubated continuously for the rest 4 h. After incubation for 72 h, 100 μL of 10% SDS was added per well and mixed thoroughly to dissolve the dark blue crystals. The plate was kept overnight at room temperature. On the next day, the plate was read with an ELISA reader, using test wavelength of 570 nm and a reference wavelength of 630 nm (Way et al., Citation2009).
Results and discussion
Influence of various concentrations
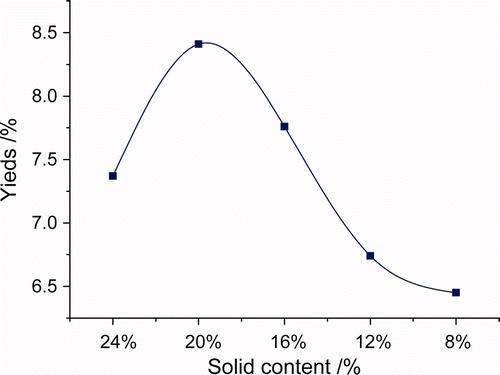
The tea flower water-extracted solution was tested by Saccharimeter to have soluble solid content of 24, 20, 16, 12, and 8%, respectively. The extracts were precipitated by adding 3.0 volumes of 95% (v/v) ethanol for more than 4 h at 4°C. According to yield and composition of TFPS, the optimal concentration was determined in the test.
Water extracts were generally concentrated and precipitated by ethanol. If the concentration of water extracts was too high, the viscosity of water extract increased accordingly, which lead to difficulty of ethanol well blended with water extract and to a high content of impurities in polysaccharide precipitation on the extract solution. If the concentration of water extracts was too low, much more ethanol and time for polysaccharide precipitation would be required. As a result, proper concentration of water extract was critical to ethanol-precipitation extracting technique.
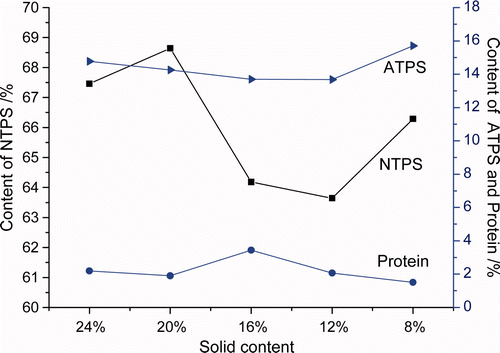
Supplementary and showed that yield of TFPS first increased then decreased, with increase of water extract concentration. When soluble solid content was at 20%, the yield and neutral sugar content of TFPS reached maximum, while the protein content was a little lower than extracted at the concentrations of other soluble solid contents. The acid sugar content was higher than the solid content of 16 and 12%, but slightly lower than 8 and 24%. Considering all the aspects, solid content of 20% was the optimum concentration.
Influence of ethanol fractional precipitation
Yields of TFPS obtained by ethanol fractional precipitation were shown in Supplementary . It exhibited fluctuating changes with the different concentration of ethanol. The yields of TFPS were more than 25% when precipitated by ethanol concentrations of 30%, 40%, and 50% (v/v), which were higher than the other ethanol concentration precipitation. The yield of TFPS reached the maximum when precipitated by ethanol concentration of 30% (v/v). It was possibly because of high polysaccharides content and protein in the extract. The macromolecular substances were in some colloid state which led to large viscosity, so in the course of sedimentation, molecules interacted, interlinked, and enveloped in water phase. Contaminants were enveloped in it and led to a high content of polysaccharides yield. When extracted solution was dialyzed by dialysis membrane of 3500 D, the yield of TFPS which was precipitated by 30% (v/v) of ethanol was close to that by 70% (v/v) of ethanol. This result demonstrated that if viscosity of extract solution was too high, the precipitation had more contamination. After dialysis disposal, most TFPS could be precipitated by 30% (v/v) of ethanol, which could greatly save the ethanol usage compared to the traditional use of 70% (v/v) of ethanol.
Influence of ethanol stepwise precipitation
TFPS was soluble in water, but insoluble in ethanol. At different concentration of ethanol, the solubility of different molecular polysaccharide was distinct. The lower the concentration of ethanol was, the higher the TFPS molecule was. Yields of TFPS obtained by ethanol stepwise precipitation were showed as Supplementary . Yield of TFPS, which was precipitated by 30% (v/v) of ethanol, was highest, next came 10%, 20%, 70%, 80%, and 90% (v/v) of ethanol. Ethanol (10–40% (v/v)) might precipitate high molecular TFPS, which accounted for 95% of all TFPS. The TFPS precipitated by 70%, 80%, and 90% (v/v) ethanol might be some small molecules, which only accounted for 5% of all TFPS. The result, which could get TFPS precipitated by different ethanol concentrations, demonstrated that molecules of TFPS were widely distributed and the large molecular TFPS accounted for a primary proportion. The yield of TFPS ethanol stepwise precipitation was similar to that of ethanol fractional precipitation, which again proved that most TFPS was precipitated when the final concentration of ethanol was adjusted to 30% (v/v).
Monosaccharide composition of tea flower polysaccharides
Different monosaccharide standards were run on the IC system and their retention times were recorded to identify the monosaccharide components in TFPS. As Supplementary showed, TFPS consisted of rhamnose, arabinose, galactose, glucose, xylose, mannose, GalA, and GluA with a molar ratio of 4.95:11.57:11.89:4.26:1.31: 1.98:8.41:1.00. The result suggested that TFPS consisted of acid polysaccharides.
Effect of TFPS on 𝛂-glucosidase
The α-glucosidase inhibitors are currently focused on for diabetic treatment as oral hypoglycemic agents for its high affinity to α-glucosidase. The α-glucosidase inhibitors act on the brush border of intestinal mucosa to inhibit the post-meal blood glucose level from rising and decrease fasting blood glucose to some extent by delaying the carbohydrates digestion and absorbance at intestine (Quan, Yin, Jin, & Shen, Citation2003). The α-glucosidase inhibitors are mostly evaluated by determination of α-glucosidase inhibitory activity using pNPG as the reaction substrate. The results were represented in the form of “mean number±standard deviation”.
As Supplementary showed, α-glucosidase inhibitory rate reached 92.27% when adding TFPS at the final concentration of 5 mg/ml. The result exhibited that TFPS had a stronger inhibitory effect on α-glucosidase.
Immunological activity of TFPS
Supplementary showed the proliferation effect of TFPS on the mice splenic lymphocyte. The results showed that the TFPS had stronger proliferation effect on lymphocyte at the concentration of 3.0 μg/mL (P< 0.01). The result showed that TFPS had the ability to directly promote the mice splenic lymphocyte.
Conclusions
According to yield and composition of TFPS, the optimal concentration of water extracts was solid content of 20% measured by saccharimeter. The yields of TFPS which was precipitated by 30% (v/v) of ethanol were close to that of 70% (v/v) ethanol used in the traditional method. TFPS was an acid polysaccharide and consisted of rhamnose, arabinose, galactose, glucose, xylose, mannose, GalA, and GluA with a molar ratio of 4.95:11.57:11.89:4.26:1.31:1.98:8.41: 1.00. In addition, TFPS (5 mg/mL) concentration exhibited a strong inhibitory effect on α-glucosidase with the inhibitory rate of 92.27%. The result of in vitroimmunoassay indicated the TFPS had stronger proliferation effect on lymphocyte at the concentration of 3.0 μg/mL (P<0.01).
Supplementary material
The supplementary material for this article is available online at http://dx.doi.org/10.1080/19476337.2010.523901
Supplementary Figure 1. Effect of different concentrations on the yield of TFPS.
Figura adicional 1. Efecto de las diferentes concentraciones de rendimiento de polisacáridos de flor de té.
Supplementary Figure 2. Effect of the different concentration on the composition of TFPS.
Figura adicional 2. Efecto de la diferente concentración en la composición de polisacáridos de flor de té.
Supplementary Figure 3. IC analysis of monosaccharide composition of TFPS.
Figura adicional 3. Análisis de cromatografía iónica de la composición de monosacáridos de los polisacáridos de flor de té.
Supplementary Figure 4. The proliferation effects of TFPS on the mice splenic lymphocytes.
Figura adicional 4. Efectos de proliferación de polisacáridos de flor de té en linfocitos esplénicos de ratón.
Supplementary Table 1. Yields of TFPS by ethanol fractional precipitation and stepwise precipitation.
Tabla adicional 1. Rendimiento de polisacáridos de flor de té por precipitación fraccionada y precipitación gradual por etanol.
Supplementary Table 2. The inhibitory effect of TFPS on α-glucosidase.
Tabla adicional 2. Tabla adicional 2. Efecto inhibidor de α-glucosidasa de los polisacáridos de flor de té de.
tcyt_a_523901_sup_23768409.pdf
Download PDF (1 MB)Acknowledgments
The authors are grateful for financial sponsored by National High Technology Research and Development (863) Program of China (2008AA10Z322), Shanghai Rising-Star Program (07QB14047), Innovation Program of Shanghai Municipal Education Commission (11ZZ121), Shanghai Rising-Star Tracking Program (11QH1401800), Produce-learn-research Project of Shanghai Normal University (No. DCL201002), Shanghai Biomedicine Key Program (No. 08391911100, No. 10391901700), Shanghai Basic Research Key Program (No. 09JC1411500), and National Natural Science Foundation of China (No.81072308).
References
- Anesini , C. , Ferraro , G. E. and Filip , R. 2008 . Total polyphenol content and antioxidant capacity of commercially available tea (Camellia sinensis) in Argentina . Journal of Agricultural and Food Chemistry , 56 : 9225 – 9229 .
- Chapdelaine , P. , Tremblay , R. R. and Dube , J.Y. 1978 . P-Nitrophenyl-α-glucopyranoside as substrate for measurement of maltase activity in human semen . Clinical Chemistry , 24 : 208 – 211 .
- Krafczyk , N. and Glomb , M.A. 2008 . Characterization of phenolic compounds in Rooibos tea . Journal of Agricultural and Food Chemistry , 56 : 3368 – 3376 .
- Lin , Y. S. , Wu , S. S. and Lin , J.K. 2003 . Determination of tea polyphenols and caffeine in tea flowers (Camellia sinensis) and their hydroxyl radical scavenging and nitric oxide suppressing effects . Journal of Agricultural and Food Chemistry , 51
- Quan , J. , Yin , X. , Jin , M. and Shen , M. 2003 . Study on the inhibition of alpha-glucosidase by soyasaponins . Journal of Chinese Medicine Material , 26 : 654 – 656 .
- Sultana , T. , Stecher , G. , Mayer , R. , Trojer , L. , Qureshi , M. N. , Abel , G. and Bonn , G.K. 2008 . Quality assessment and quantitative analysis of flavonoids from tea samples of different origins by HPLC-DAD-ESI-MS . Journal of Agricultural and Food Chemistry , 56 : 3444 – 3453 .
- Tsubaki , S. , Iida , H. , Sakamoto , M. and Azuma , J. 2008 . Microwave heating of tea residue yields polysaccharides, polyphenols, and plant biopolyester . Journal of Agricultural and Food Chemistry , 56 : 11293 – 11299 .
- Way , T. D. , Lin , H. Y. , Hua , K. T. , Lee , J. C. , Li , W. H. , Lee , M.R. and Lin , J.K. 2009 . Beneficial effects of different tea flowers against human breast cancer MCF–7 cells . Food Chemistry , 114 : 1231 – 1236 .
- Wei , X. L. , Chen , M. A. , Xiao , J. B. , Liu , Y. , Yu , L. , Zhang , H. and Wang , Y.F. 2010 . Composition and bioactivity of tea flower polysaccharides obtained by different methods . Carbohydrate Polymers , 79 : 418 – 422 .
- Yang , R. Z. , Zhang , J. S. , Tang , Q. J. and Pan , Y.J. 2005 . High performance anion exchange chromatography method to determine the monosaccharide composition of polysaccharides . Edible fungi china , 24 : 42 – 44 .
- Yang , Z. , Xu , Y. , Jie , G. , He , P. and Tu , Y. 2007 . Study on the antioxidant activity of tea flowers (Camellia sinensis) . Asia Pacific Journal of Clinical Nutrition , 16 : 148 – 152 .