Abstract
Acrylamide is known to be a neurotoxic, genotoxic, and carcinogenic compound in animal, which is classified as a probable human carcinogen. In this study, a total of 223 samples of traditional Chinese foods were analyzed for acrylamide content, including cereal breakfast, cookie, bread, noodle, crispy rice, snow-cake, fried dough twist, fried bread stick, roasted cake, dried fruit flake, potato chips, sweet potato, dried fish or shrimp, soybean powder, chestnut, peanut, almond, crisp candy, dried vegetable, green tea, wafer, and cigarette. Results of the study showed that the average and median contents of acrylamide in all the selected foods were 113 and 76 μg kg−1, respectively. The results indicated that processing methods had significant influence on acrylamide formation. The highest acrylamide content was found by puffering processing. The data obtained here could be helpful for the estimation of exposure and risk assessment of acrylamide in Chinese population.
La acrilamida se conoce por ser un componente neurotóxico, genotóxico y cancerígeno en animales, y está clasificado como probable cancerígeno en humanos. En este estudio un total de 223 muestras de comida tradicional china se estudiaron para analizar su contenido de acrilamida, incluyendo cereales de desayuno, galletas, pan, fideos, arroz crujiente, pastel de nieve, trenzas de masa fritas, palos fritos de pan, bizcocho tostado, copos de fruta seca, patatas fritas, batata, pescado seco, soja en polvo, castañas, cacahuetes, almendras, caramelo crujiente, vegetales secos, té verde, barquillo y tabaco. Los resultados del estudio mostraron que el promedio y la mediana del contenido de acrilamida en todos los alimentos seleccionados fueron 113 y 76 μg kg−1, respectivamente. Los resultados indicaron que los métodos de procesado tenían influencia significante en la formación de acrilamida. El contenido de acrilamida más alto se encontró en el proceso de inflado. Los datos obtenidos podrían ser usados para la estimación de la exposición y riesgo de acrilamida en la población china.
Palabras clave:
Introduction
In April 2002, researchers in Swedish National Food Administration (SNFA) and Stockholm University announced that carbohydrate-rich foods which were heated or fried at high temperature contained relatively high levels of acrylamide, such as fried potato products (SNFA, 2002). After the announcement of acrylamide in foods, confirmation experiments were performed by other research groups and most foods were found to contain different amounts of acrylamide (Ahn et al., Citation2002; Becalski, Lau, Lewis, & Seaman, Citation2003). These investigations cause considerable concern as acrylamide has been known to be a neurotoxic, genotoxic, and carcinogenic compound in animal, which is classified by the International Agency for Research on Cancer (IARC) as a probable human carcinogen (IARC, Citation1994). Thus, experts all over the world agree that acrylamide levels in food should be minimized as far as possible. Nowadays, numerous research groups commenced studies into the possible sources about the formation of acrylamide in foods. These studies showed that an important route to form acrylamide is the Maillard reaction which is favored byhigh temperature (Mottram, Wedzicha, & Dodson, Citation2002; Stadler et al., Citation2004). Asparagine and reducing sugar such as glucose and fructose are two kinds of important precursors on acrylamide formation, and the use of 13C-labeled isotopes can prove that asparagine needs carbonyl source, that is to say reducing sugars, to form acrylamide (Stadler et al., Citation2004).
And so far, many new methods were developed to analyze acrylamide content in food. High performance liquid chromatography mass spectrometry (HPLC–MS) and high-performance liquid chromatography tandem mass spectrometry (HPLC–MS/MS) become the most useful and authoritative methods for acrylamide detection in complex food matrix (Chen, Yuan, Liu, Zhao, & Hu, Citation2008; Roach, Andrzejewski, Gay, Nortrup, & Musser, Citation2003; Tareke, Rydberg, Karlsson, Eriksson, & Tornqvist, Citation2002), and lots of data on acrylamide levels in foods have been obtained in many countries such asAmerica (FDA, Citation2004–2006), Spain (Rufian-Henares, Arribas-Lorenzo, & Morales, Citation2007), and Turkey (Ölmez, Tuncay, Özcan, & Demirel, Citation2008; Şenyuva & Gökmen, Citation2005), but the available data about Chinese food, especially traditional Chinese foods, were a few (Zhang, Ren, Zhao, & Zhang, Citation2007). Since Chinese foods play an important role in today's world, Chinese food is the typical representative oftraditional Asian foods; it is necessary to learn about acrylamide contents in traditional Chinese foods in order to make the risk assessment for the government and to help the consumers choose the healthy food in their daily life. Thus, the main purpose of the present work is to study acrylamide content in different food products from traditional Chinese foods and to show the effect of processing methods on acrylamide content in food products.
Materials and methods
Chemicals
Acrylamide (purity > 99.8%) and [13C3]-acrylamide (99% isotopic purity) were purchased from Sigma-Aldrich (St. Louis, MO, USA) and Cambridge Isotope Laboratories (Andover, MA, USA), respectively. Formic acid, anhydrous magnesium sulfate, sodium chloride, and n-hexane were of analytical grade and obtained from Beijing Chemicals Co. (Beijing, China). HPLC methanol was purchased from Merck Ltd. (Beijing, China). HPLC-grade and 0.20-μm filtered water was prepared. The solid-phase extraction (SPE) cartridges Oasis MCX (3 ml, 60 mg) were supplied by Waters (Milford, MA, USA).
Sampling, sample grouping, and storing
All samples selected in this study were bought at local supermarkets and stores in Changchun city in 2008 and 2009. A total of 223 samples covered 22 categories of traditional Chinese foods including breakfast cereal, cookie, bread, noodle, crispy rice, snow-cake, fried dough twist, fried bread stick, roasted cake, dried fruit flakes, potato chip, sweet potato, dried fish or shrimp, soybean powder, chestnut, peanut, almond, crisp candy, dried vegetable, green tea, wafer, and cigarette. All samples were stored at −18°C before analysis.
Sample preparation
The sample preparation was performed according to the method of Liu, Zhao, Yuan, Chen, and Hu (Citation2008) and Chen et al. (Citation2008). All the samples were homogenized in a blender (HR2094, Philips Instruments Co., Ltd., Zhuhai, China). A portion of 1.000 g of sample was transferred to a 50-ml centrifuge tube. Then, 1 ml [13C3]-acrylamide solution of 900 μg l−1and 9 ml water were added into the tube. The mixture was incubated on a horizontal shaker (1500 rpm) at 25°C for 20 min; then 10 ml of acetonitrile, 4 g of anhydrous magnesium sulfate, and 0.5 g of sodium chloride were added consecutively. The tube was sealed and shaken vigorously for 1 min immediately and then centrifuged at 5000 rpm for 5 min at 4°C. Three layers were obtained as follows: an acetonitrile layer containing acrylamide at the top, the matrix layer in the middle, and the water layer with the excessive salts and solid matters in the bottom. The acetonitrile solution (9 ml) was transferred into a glass tube and evaporated to dryness under a stream of nitrogen in a water bath at 40°C. The residues on the wall of glass tube were redissolved in 0.5 ml of water under vortex; so, some highly lipophilic co-extractives were excluded again. Aqueous extract was filtered through a 0.45-μm syringe filter for further clean-up by Oasis MCX SPE cartridge. The redissolved extract (0.5 ml) passed through the SPE cartridge which was conditioned consecutively with 2 ml of methanol and 2 ml of water, and the effluent was collected. Subsequently, acrylamide retained on the SPE column was eluted by 0.5 ml of water. The initial effluent and the wash part were combined and filtered through a 0.22-μm syringe filter for HPLC–MS/MS analysis.
Acrylamide analysis by HPLC–MS/MS method
The analysis of acrylamide in food was performed according to the method of Liu et al. (Citation2008) and Chen et al. (Citation2008) by an Alliance 2695 Separation Module (Waters, Milford, MA, USA) coupled to a Micromass Quattro Micro triple-quadrupole mass spectrometer (Micromass, Manchester, UK). The final tested solution (20.0 μl) was injected onto a reversed octadecylsilyl-C18(ODS-C18) column (25064.6 mm, 5 mm, Hypersil, Thermo Fisher Scientific, Waltham) maintained at 30°C. The elution mode was isocratic using a mixture of 10% acetonitrile and 90% water containing 0.1% formic acid as the mobile phase at a flow rate of 0.4 ml min−1. Acrylamide was detected by MS/MS using electrospray ionization in the positive ion mode. Themultiple reaction monitoring (MRM) of degradation patterns m/z72 → 55 for acrylamide and m/z75 → 58 for [13C3]-acrylamide was used for quantification of acrylamide. The optimized MS instrument parameters were as follows: capillary voltage, 1 kV; cone voltage, 20 V; source temperature, 110°C; desolvation temperature, 400°C; desolvation gas flow, 600 l h−1; cone gas flow, 50 l h−1; argon collision gas pressure was 2 × 10⁻³mbar for MS/MS; and the collision energy for each transition was 13 eV in MRM mode. In the MRM transitions, the dwell and inter scan times were 0.4 and 0.1 s, respectively. Each determination was performed in triplicate.
Statistical analysis
Statistical analysis was performed by using Student's t-test with SPSS 15.0 software. Analysis of variance was tested on a significance level of p = 0.05. A box-and-whisker plot was generated by OriginPro 7.5 (OriginLab Corporation, Northampton, MA, USA) in order to statistically evaluate the data obtained in different food samples.
Results and discussion
Analytical quality assurance
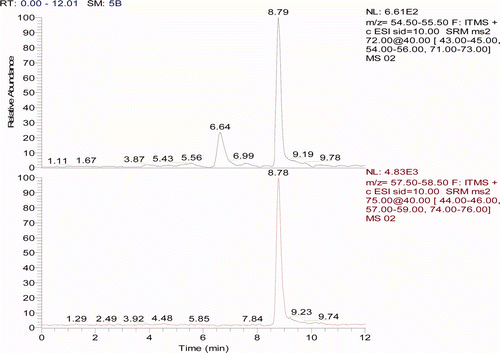
The analytical method was in-house validated with respect to limit of detection (LOD), limit of quantification (LOQ), precision, recovery, and linearity. The LOD and LOQ were 10 and 25 μg kg−1, respectively. Precision was evaluated in terms of intra-day repeatability and inter-day reproducibility as relative standard deviation (RSD)%. The values of RSD ranged from 1.8% to 4.2% forthe intra-day precision tests (n = 5) and 3.1% to 7.2% for the inter-day precision tests (n = 15). The recovery was determined on matrix blank (potato powder treated with freeze-drying), instant noodle, and potato chips at two concentrations of acrylamide (20 and 200 μg kg−1). Each test was performed three times and the mean recovery values were between 71.5% and 119.5%. The good linearity of method was achieved in the ranges of <10 to 500 μg kg−1(R 2 = 0.9977). A standard curve was made before and after analysis. In order to ensure the stability of the method, after every 10 injection was a standard and this standard had to be within the 95% confidence interval of the standard curve. The standard curve could be seen in . The MRM chromatogram profile of an instant noodle sample obtained after sample extraction and HPLC–MS/MS analysis (concentration of acrylamide in the sample was 28 μg kg−1) is shown in .
Figure 1. The standard curve of acrylamide.
Figura 1. Curva estándar de acrilamida.
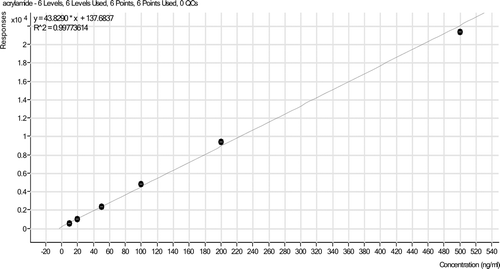
Figure 2. MRM chromatograms of an instant noodle sample obtained after sample extraction and HPLC–MS/MS analysis (concentration of acrylamide in the sample was 28 μg kg−1).
Figura 2. Cromatograma MRM de fideo instantáneo obtenido tras la extracción de muestra y análisis HPLC–MS/MS (la concentración de acrilamida en la muestra fue 28 μg kg−1).
Occurrence of acrylamide in traditional Chinese foods
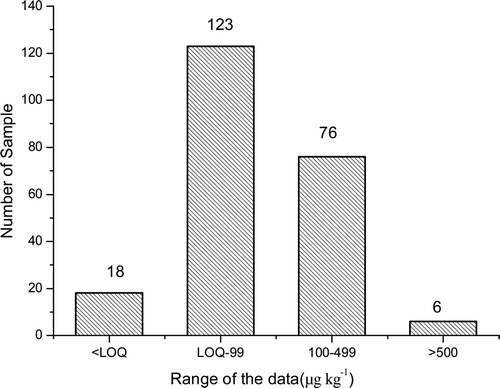
A total of 223 samples of traditional Chinese foods were analyzed for acrylamide content, including breakfast cereal, cookie, bread, noodle, crispy rice, snow-cake, fried dough twist, fried bread stick, roasted cake, dried fruit flakes, potato chip, sweet potato, dried fish or shrimp, soybean powder, chestnut, peanut, almond, crisp candy, dried vegetable, greentea, wafer, and cigarette. Acrylamide contents were detected in 223 samples at concentrations ranging from <10 to 935 μg kg−1. The average and median contents in all the samples were 113 and 76 μg kg−1, respectively. Results of the study showed, in 2.7% of the samples, the level of acrylamide found was higher than 500 μg kg−1(). Only 18 samples, 8.1% in 223 samples, were below detectable limit for acrylamide analysis. One hundred and twenty-three samples (55.2% of total) contained acrylamide contents ranging from<LOD to 100 μg kg−1, while 76 samples (34.1% of total) contained acrylamide contents ranging from 100 to 500 μg kg−1. The data obtained here showed that most foods consumed in traditional Chinese food contained acrylamide, and within a concentration of 500 μg kg−1.
Figure 3. Number of samples according to the range of acrylamide content in the study.
Figura 3. Número de muestras de acuerdo a la escala de contenido de acrilamida en el estudio.
For statistical evaluation of the data obtained in different traditional Chinese foods about acrylamide content, a box-and-whisker plot (generated by software of OriginPro 7.5) was used. The box-and-whisker plot is a powerful statistic tool which displays the median, range, the minimum, the maximum, the median, the 25th percentiles, and 75th percentiles. It is necessary since the analytical results are not normally distributed, especially in this kind of survey. Acrylamide content in different traditional Chinese foods was varied (), and the median and the interquartile range are two statistics that are appropriately used to describe the central tendency and the spread around the median, respectively. Acrylamide levels in all food samples were less than 200 μg kg−1, except of snow-cake, potato chip, and hazelnut from the median of the data. Moreover, from the median, we could also see that most of the data are toward the lower rather than higher end of the range. This box plot offered a great deal more insight than a lone average, and even much more than an average complemented by the low and high data as well.
Figure 4. Acrylamide content in traditional Chinese foods. Notes: 1, breakfast cereal; 2, cookies; 3, bread; 4, noodles; 5, fried dough twist; 6, fried bread stick; 7, roasted cakes; 8, crispy rice; 9, snow-cake; 10, dried fruit flakes; 11, potato chips; 12, sweet potato; 13, dried fish or shrimp; 14, soybean powder; 15, chestnut; 16, peanut; 17, hazelnut; 18, crisp candy; 19, dried vegetables; 20, green tea; 21, wafer; 22, cigarette. The center horizontal line of the box is the median of the data; the top and bottom of the box are the 25th and 75th percentiles (quartiles); the ends of the whiskers are the 10th and 90th percentiles. Moreover, any points outside are considered outliers, which are labeled as X. The small square of each box means the average of the data.
Figura 4. Contenido de acrilamida de comidas tradicionales chinas. 1, cereales de desayuno; 2, galletas; 3, pan; 4, fideos; 5, trenzas de masa fritas; 6, palos fritos de pan; 7, bizcocho tostado; 8, arroz crujiente; 9, pastel de nieve; 10, copos de fruta seca; 11, patatas fritas; 12, batata; 13, pescado seco; 14, soja en polvo; 15, castañas; 16, cacahuetes; 17, avellana; 18; caramelo crujiente; 19, vegetales secos; 20, té verde; 21, barquillo; 22, tabaco. La línea horizontal central en la caja es la mediana de los datos; las partes superior e inferior de la caja son los percentiles vigésimo quinto y septuagésimo quinto (cuartiles); los extremos de los bigotes son los percentiles décimo y nonagésimo. Cualquier punto fuera se considera valor atípico, el cual se indican con X. El pequeño cuadrado de cada caja indica el promedio de los datos.
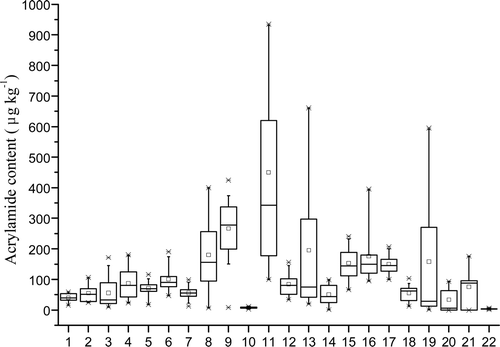
Meanwhile, acrylamide contents were varied with food categories. Raw material had significant influence on acrylamide formation (p < 0.05). The highest average value of acrylamide content was found in potato products (449 μg kg−1). Higher acrylamide contents could also be found in crispy rice, snow-cake, dried fish or shrimp, chestnut, peanut, hazelnut, and dried vegetable, which were over 100 μg kg−1on average. There was a great variation in acrylamide contents between the brands in each food groups as easily seen in . The high variability of the data is mainly a result of variable processing temperatures, variable raw materials, and variable recipes used for production.
Grain foods are one of the most important parts in traditional Chinese dietary structure. A total of 117 kinds of grain food were analyzed in this study. They were cereal breakfast, cookie, bread, noodle, fried dough twist, fried bread stick, crispy rice, snow-cake, roasted cake, and wafer. Within this group, higher levels of acrylamide were detected in snow-cake, reached at 280 and 298 μg kg−1on average and on median, respectively; the dehydration process at high temperature would contribute to acrylamide formation. Fried bread stick also had high level of acrylamide, which reached at 100 μg kg−1on average. Fried bread stick is a traditional Chinese food, which is processed by frying with oil at high temperature about 180°C, and that means the high temperature by stir-frying for a longer time and the addition of sugar in recipe would contribute to acrylamide formation. For most traditional Chinese grain foods, acrylamide contents were much lower, such as breakfast cereal, cookie, bread, and roasted cake. Within this food group, most of them were processed by roasting; a wide variation was observed for acrylamide contents of each food group; since these foods were purchased from different manufacturers, the wide variation in the acrylamide content within a specific 117 grain foods could be attributed to the level of heat treatment it underwent and the differences in the recipes which is known to play an important role in acrylamide formation.
A total of 10 potato chips and 15 sweet potato products were analyzed in this study, and the results are also shown in . The average content of acrylamide reached at 449 μg kg−1in potato chips, with a range of 100–935 μg kg−1, which is the highest in this study. However, much lower acrylamide content (91 μg kg−1on average) was detected in sweet potato products including baked sweet potato and boiled sweet potato with a range between 45 and 166 μg kg−1. Differences in processing parameters, processing methods, type and quality of raw materials, and formulations may all account for the variations of acrylamide contents in potato chips and sweet potato products. The food processing style has significant influence on acrylamide formation, since most of sweet potato products were boiled or baked in China and potato chips were mainly fried. The processing temperature for the sweet potato was much lowerthan that in fried potato chips; meanwhile, the higher water activity occurred in baked sweet potato and boiled sweet potato than fried potato products that will decrease acrylamide contents.
The data obtained here may provide guidance for the consumers to choose the suitable foods with lower acrylamide content, and it is also a caution for the industry to decrease the acrylamide content in their products in order to protect the health of their consumers.
Effect of processing methods on acrylamide contents
The effect of processing methods on acrylamide contents wasalso observed in this study (). The selected food samples were divided into six processing methods as dried food, fried food, puffered food, bakery food, stir-fried food, and roasted food, and significant difference could be found among the processing methods (p < 0.05). All selected processing methods might form acrylamide in this study. Food processed by puffering contained the highest acrylamide content, which reached at 197 and 177 μg kg−1on average and on median, respectively. Most of the puffed foods were made of grains, which were forced out of a little hole at high temperature and pressure. Some sugars or salt would also be added into the recipe, which will enhance acrylamide content in puffed food. Frying food also had high level of acrylamide, and the concentration of acrylamide was 167 μg kg−1on average, which was lower than the puffered food. The highest acrylamide contents were found in potato chips, but some traditional Chinese fried food, such as fried dough twist, fried bread stick, and fried instant noodles, had rather low acrylamide content. The total acrylamide content by frying method was lower because of the participation of some traditional Chinese fried food. As for the dried food, stir-fried food, and roasted food, the acrylamide content wassimilar, which reached at 105, 104, and 91 μg kg−1on average, respectively. The dried vegetable, such as some dried fungi, had a rather high content of acrylamide, because of the dehydrated processing with high thermal treatment temperature made the concentration of reducing sugar and amino acid precursors, enhanced the concentration of reaction precursors. Since most of baked foods were made from the flour or grain, the reaction precursors of reducing sugar and amino acid and processing temperature were restricted by the processing method; the acrylamide content was the lowest among the selected processing methods.
Figure 5. Acrylamide content influenced by food processing methods. Note: 1, dried food; 2, fried food; 3, puffered food; 4, bakery food; 5, stir-fried food; 6, roasted food.
Figura 5. Contenido de acrilamida influido por los métodos de procesado. 1, comida seca; 2, comida frita; 3, comida inflada; 4, comida asada; 5, comida salteada; 6, comida tostada.
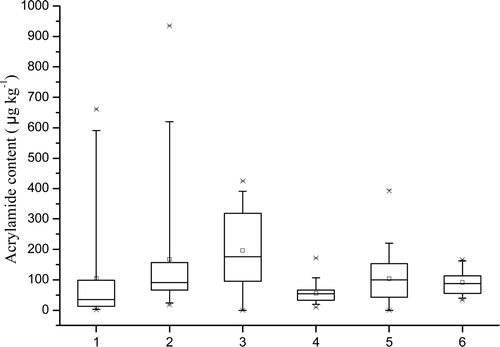
From the point of distribution of processing methods onacrylamide formation (), most data obtained were less than 150 μg kg−1on median, except for puffed food, which reached at 177 μg kg−1. The highest acrylamide content was found by puffering processing, followed by frying, drying, stir-frying, roasting, and baking on average. The largest variability was found by frying processing; thehighest and lowest acrylamide contents were 935 and 23 μg kg−1, respectively.
Acknowledgments
This work was supported by the fund from “National Natural Science Foundation (31000750)” and China Postdoctoral Science Foundation (20100471259). Accordingly, the authors gratefully acknowledge the fund supports.
References
- Ahn , J.S. , Castle , L. , Clarke , D.B. , Lioyd , A.S. , Philo , M.R. and Speck , D.R. 2002 . Verification of the findings of acrylamide in heated foods . Food Additives and Contaminants , 19 : 1116 – 1124 . doi: 10.1080/0265203021000048214
- Becalski , A. , Lau , B.P.-Y. , Lewis , D. and Seaman , S.W. 2003 . Acrylamide in food: Occurrence, sources, and modeling . Journal of Agricultural and Food Chemistry , 51 : 802 – 808 . doi: 10.1021/jf020889y
- Chen , F. , Yuan , Y. , Liu , J. , Zhao , G. and Hu , X.S. 2008 . Survey of acrylamide levels in Chinese foods . Food Additives and Contaminants: Part B , 1 : 85 – 92 . doi: 10.1080/02652030802512461
- FDA . 2004–2006 . Survey data on acrylamide in food: Total diet study results Retrieved from http://www.fda.gov/Food/FoodSafety/FoodContaminantsAdulteration/ChemicalContaminants/Acrylamide/ucm053566.htm
- IARC . 1994 . IARC monographs on the evaluation of carcinogenic risks to humans. Some industrial chemicals, acrylamide , 389 – 433 . Lyon, France: WHO .
- Liu , J. , Zhao , G. , Yuan , Y. , Chen , F. and Hu , X.S. 2008 . Quantitative analysis of acrylamide in tea by liquid chromatography coupled with electrospray ionization tandem mass spectrometry . Food Chemistry , 108 : 760 – 767 . doi: 10.1016/j.foodchem.2007.11.015
- Mottram , D.S. , Wedzicha , B.I. and Dodson , A.T. 2002 . Acrylamide is formed in the Maillard reaction . Nature , 419 : 448 – 449 .
- Ölmez , H. , Tuncay , F. , Özcan , N. and Demirel , S. 2008 . A survey of acrylamide levels in foods from the Turkish market . Journal of Food Composition and Analysis , 21 : 564 – 568 . doi: 10.1016/j.jfca.2008.04.011
- Roach , J.A.G. , Andrzejewski , D. , Gay , M.L. , Nortrup , D. and Musser , S.M. 2003 . Rugged LC–MS/MS survey analysis for acrylamide in foods . Journal of Agricultural and Food Chemistry , 51 : 7547 – 7554 . doi: 10.1021/jf0346354
- Rufian-Henares , J.A. , Arribas-Lorenzo , G. and Morales , F.J. 2007 . Acrylamide content of selected Spanish foods: Survey of biscuits and bread derivatives . Food Additives and Contaminants: Part A , 24 : 343 – 350 . doi: 10.1080/02652030601101169
- Şenyuva , H.Z. and Gökmen , V. 2005 . Survey of acrylamide in Turkish foods by an in-house validated LC–MS method . Food Additives and Contaminants: Part A , 22 : 204 – 209 . doi: 10.1080/02652030512331344178
- SNFA (Swedish National Food Administration) . 2002 . Information of acrylamide in food Retrieved from http://www.slv.se
- Stadler , R.H. , Robert , F. , Riediker , S. , Varga , N. , Davidek , T. , Devaud , S. and Blank , I. 2004 . In-depth mechanistic study on the formation of acrylamide and other vinylogous compounds bythe Maillard reaction . Journal of Agricultural and Food Chemistry , 52 : 5550 – 5558 . doi: 10.1021/jf0495486
- Tareke , E. , Rydberg , P. , Karlsson , P. , Eriksson , S. and Tornqvist , M. 2002 . Analysis of acrylamide, a carcinogen formed in heated foodstuffs . Journal of Agricultural and Food Chemistry , 50 : 4998 – 5006 . doi: 10.1021/jf020302f
- Zhang , Y. , Ren , Y. , Zhao , H. and Zhang , Y. 2007 . Determination of acrylamide in Chinese traditional carbohydrate-rich foods using gas chromatography with micro-electron capture detector and isotope dilution liquid chromatography combined with electrospray ionization tandem mass spectrometry . Analytica Chimica Acta , 584 : 322 – 332 . doi: 10.1016/j.aca.2006.10.061