Abstract
The aim of this work was to evaluate sensory changes in grape skins during ripening and to obtain a correlation with their phenolic composition. Flavan-3-ols (monomers and dimers), prodelphinidins, hydroxybenzoic acids, hydroxycinnamic acids, anthocyanins and flavonols were determined by HPLC-DAD-MS. In addition, skin dilaceration, tannic intensity, astringency, acidity, aroma intensity (AI) and type of aroma were evaluated. Multivariate analysis showed the evolution of these samples during ripening and the relationship among sensory scores and phenolic composition of grapes skins. Skin dilaceration, type of aroma and to a lesser extent AI tend to increase during ripening. The contents in the phenolic compounds in grape skins present a similar pattern to the aforementioned sensory parameters. Nevertheless, tannic intensity, astringency, dryness and acidity present an opposite pattern which indicates a decrease of these sensory scores during ripening.
El objetivo de este trabajo ha sido evaluar los cambios en los parámetros sensoriales del hollejo de uva durante la maduración y obtener una correlación con su composición fenólica. Se han determinado flavan-3-oles (monómeros y dímeros), prodelfinidinas, ácidos hidroxibenzoicos, ácidos hidroxicinámicos, antocianos y flavonoles mediante HPLC-DAD-MS. Además, se han evaluado los siguientes atributos sensoriales del hollejo: facilidad de dilaceración, intensidad tánica, astringencia, acidez, sequedad, intensidad de aroma y tipo de aroma. El análisis multivariante mostró la evolución de los hollejos a lo largo de la maduración y la relación entre las puntuaciones sensoriales y la composición fenólica de los mismos. La facilidad de dilaceración, el tipo de aroma y en menor medida la intensidad del aroma tienden a aumentar con la maduración, pauta similar a la presentada por los compuestos fenólicos estudiados. Sin embargo, la intensidad tánica, la astringencia, la sequedad y la acidez presentan una pauta opuesta, lo que indica una disminución de estos atributos sensoriales durante la maduración.
Palabras clave:
Introduction
Phenolic compounds are widely distributed in fruits, vegetables, nuts and beverages. Among them, three types of flavonoids (i.e. anthocyanins, flavanols and flavonols) are particularly relevant to red wine quality. Their reactivity during winemaking and aging define wine colour, astringency, bitterness and the evolution of all these sensory attributes.
The anthocyanins structurally depend on the conditions and composition of the media where they are dissolved and suffer interactions with other compounds that influence their structural equilibria and modify their colour (Santos-Buelga & Freitas, Citation2009).
Among phenolics, flavanols are the most studied compounds in relation to their influence on wine astringency. Grape flavanols are mainly derived from (epi)catechin and, to a lesser extent, from epicatechin-3-O-gallate and (epi)gallocatechin. They can be found in grapes as monomers but also as oligomers and polymers, also called condensed tannins or proanthocyanidins. It is well known that skins contain both catechins and gallocatechins and their corresponding derived proanthocyanidins highly contribute to the phenolic composition of wines (Darias-Martín, Díaz-González, & Díaz-Romero, Citation2004; Darias-Martín, Rodríguez, Diaz, & Lamuela-Raventós, Citation2000). Their concentration and chemical structure seem to have an important contribution to astringency, although concentration appears to be less important than chemical structure (de Freitas & Mateus, Citation2001; Delcour, Vandenberghe, Corten, & Dondeyne, Citation1984; Kielhorn & Thorngate III, Citation1999; Lesschaeve & Noble, Citation2005; Peleg, Gacon, Schlich, & Noble, Citation1999; Vidal et al., Citation2004).
The perception of the astringency seems to increase with the molecular weight of the proanthocyanidin, as well as with the degree of galloylation (Vidal et al., Citation2003). However, there are different trends about the influence of high molecular weight proanthocyanidins on astringency. Some authors have reported that proanthocyanidins with mean molecular size bigger than seven are insoluble and unable to contribute to astringency (Lee & Jaworski, Citation1990).
Recent studies have shown that high polymerized proanthocyanidins are soluble in wine-like water-alcoholic solution and are very astringent (Vidal et al., Citation2003) and have reported that galloylated tannins induce a puckering astringent mouthfeel (Vidal et al., Citation2004). Nevertheless, it has been suggested that this sensation could get largely modulated by the presence of some flavonol glycosides and phenolic acids (Hufnagel & Hofmann, Citation2008). In contradiction to previous literature about astringent perception, recent studies have suggested that flavanols were not relevant compounds (Hufnagel & Hofmann, Citation2008; Sáenz-Navajas, Ferreira, Dizy, & Fernández-Zurbano, Citation2010).
It has been suggested that oral astringency results from the precipitation of salivary proteins. However, by itself it does not explain all aspects of astringency (Jackson, Citation2009) and it has been recently pointed out that tannin–protein interaction is more closely associated to astringency than tannin–protein complex precipitation (Obreque-Slier, López-Solís, Peña-Neira, & Zamora-Marín, Citation2010). The mechanism of astringency has not been fully understood yet, and nowadays the sensory analysis is a useful tool to evaluate organoleptic attributes (Condelli, Dinnella, Cerone, Monteleone, & Bertuccioli, Citation2006; Le Moigne, Maury, Bertrand, & Jourjon, Citation2008; Sáenz-Navajas, et al., Citation2010).
The aim of this work was to evaluate sensory changes in grape skins during ripening and to investigate correlations between the sensory parameters and the phenolic composition of grapes. For this, the phenolic composition of grape skins with different degrees of maturity was analyzed by high-performance liquid chromatography with diode array and mass spectrometry detection (HPLC-DAD-MS) and the results were correlated with the following sensory parameters, skin dilaceration (Dil), tannic intensity (TI), astringency (A), acidity (Ac), aroma intensity (AI), dryness (D) and type of aroma (Ar).
Material and methods
Samples
Vitis vinifera L. cv. Graciano red grape samples were collected from two different vineyards located in La Rioja (Spain). Vineyard V is located in Logroño (Rioja Media) and vineyard Z is located 40 km away, in Haro (Rioja Alta). The samples were collected at different developmental stages from veraison (September) to over-ripeness (November) in two different vintages (2008 and 2009). In the case of 2008 vintage, seven dates were taken into account for vineyard V and eight for vineyard Z. For 2009 vintage, the number of dates taken into account was six for vineyard V and seven for the vineyard Z. Three groups of 150 berries per vineyard were collected at each date. The berries were collected from both sides of vines located in different rows within the vineyard. Edge rows and the first two vines in a row were avoided. Berries were collected from the top, middle and bottom of the cluster. Two subsamples were taken from each sample, one for the sensory analysis, which was performed immediately, and the other one was frozen and stored at −20°C until chromatographic analyses.
Phenolic compounds extraction and determination
Grape skins were separated manually, and 10 g of skins were macerated at 4°C in methanol containing 0.1% of 12M HCl. Methanolic phases were successively pooled, a few milliliters of water were added and the extract was concentrated under vacuum at 30°C until methanol was removed and finally made up to 100 mL with ultrapure water. HPLC-DAD-MS analysis and procedure of cationic exchange were carried out as previously described (Ferrer-Gallego, Hernández-Hierro, Rivas-Gonzalo, & Escribano-Bailón, Citation2011).
The determined phenolic compounds were grouped taking into account their basic structures and their degree of polymerization: flavan-3-ols (Mon, monomers; Dim, dimers); PD, prodelphinidins; HB, hydroxybenzoic acids; HC, hydroxycinnamic acids; Ant, anthocyanins; Flavo, flavonols. Supplementary shows the contents of the aforementioned compounds expressed as mg g−1 of grape skins.
Sensory analysis
Prior to their participation in the experiments, subjects were trained to recognize and rate the perceived intensity of the following sensations: sourness, bitterness and astringency using the following standard solutions, respectively: tartaric acid: 0.06, 0.12, 0.25, 0.5, 1, 2 g/L; quinine monohydrochloride dihydrate: 0.025, 0.037, 0.05 g/L; aluminium potassium sulphate: 0.3, 0.45, 0.6, 0.9 g/L. During training sessions, subjects were asked when they began to feel some taste or mouth sensation. Moreover, they have to order different concentrations and to realize duo–trio tests. Several tests were carried out to familiarize the panelist with grape aromas. An aroma kit was used to recognize the type of aroma (herbal, neutral, fruit, ripening fruit or post-harvest fruit) and AI (slight intensity, moderate intensity, rather strong intensity or strong intensity). Subjects participated in a total of four training sessions.
Eleven non-smokers subjects, seven women and four men, took part in the experiment. Some judges had experience in this kind of tasting but the others were instructed to sip the sample (grape skin), to practice the same number of chews and to rate the intensity (Rousseau & Delteil, Citation2000).
Chemometric analysis
Unsupervised methods are applied to observe trends in the data indicating relationships between samples and variables (Brereton, Citation2003; Massart et al., Citation1998). Principal components analysis (PCA) was used for data analysis as unsupervised pattern recognition method. The data matrix was constituted not only by sensory scores of samples but also by their phenolic composition. The aforementioned chemometric tool was applied to the correlation matrix of the original variables.
The software package SPSS 13.0 for Windows (SPSS, Inc., Chicago, IL) was used for data processing.
Results and discussion
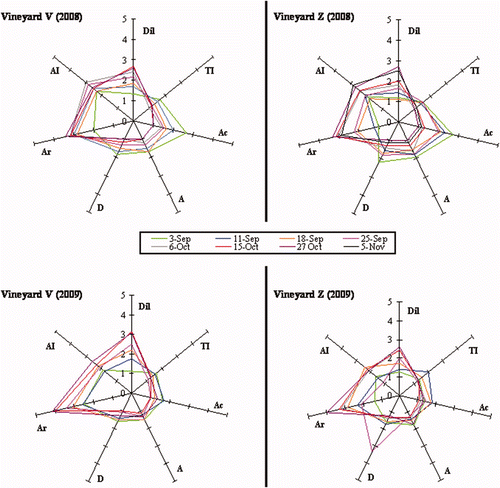
Supplementary presents the obtained sensory scores of grape skins during the ripening process using a radial plot which is useful for illustrating temporal data. It is noteworthy that the main differences in these scores are related with the vintage instead of the vineyard. Samples corresponding to 2008 vintage present more acidity at the beginning of the ripening and also show more AI than 2009 vintage samples. Nevertheless, the samples corresponding to 2009 vintage reach more ripening fruity aromas at the last steps of ripening. This plot also reveals the evolution of these sensory parameters during ripening. Skin dilaceration, type of aroma and AI tend to increase during ripening. Nevertheless, TI, astringency, dryness and acidity present an opposite trend which indicates a decrease of these sensory scores during ripening.
Figure 1. Representation of the grape skin samples in the score plot (a) and the variables in the loadings plot (b) on the plane defined by the first and second principal components.
Figura 1. Representación de las muestras de hollejo en el diagrama de puntuaciones (a) y de las variables en el diagrama de cargas (b) en el plano definido por el primer y segundo componente principal.
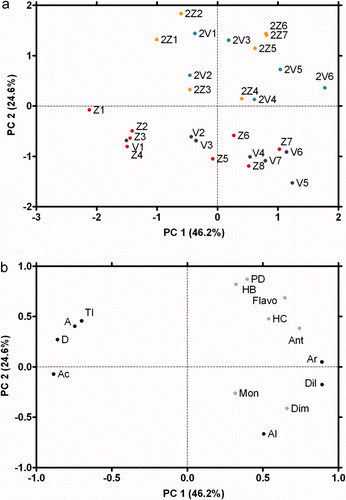
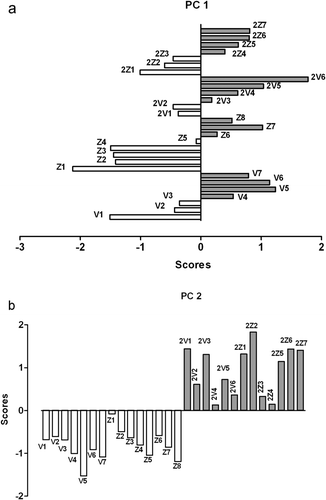
In order to evaluate the relationship between sensory parameters and phenolic composition of grape skin samples, PCA was applied. shows the projection of the samples on the plane defined by the first and second principal components and also the corresponding loading plot (. The first principal component (PC 1) describes 46.2% of the variability in the data and the second (PC 2) 24.6%. Each sample was represented by an alphanumeric code indicating the vintage (i.e. none = 2008; 2 = 2009), vineyard (V and Z) and sampling date. PC 1 describes the evolution of grape skin samples during ripening; this pattern has been emphasized in Supplementary Figure 2(a). In this plot, the first dates of each sample presents negative scores in PC 1 and these scores increased during ripening. It is also noticeable that the 2009 vintage presents a more homogeneous pattern and the 2008 vintage starts at more negative scores. This may be related to a faster and more homogeneous ripening in the 2009 and later verasion in the 2008 vintage. This plot also shows when the samples reach the highest values in PC 1 which correspond to the most suitable sensory attributes (i.e. lower astringency, acidity, dryness and TI and higher skin dilaceration, type and intensity of aroma) and the associated values of the studied phenolic compounds (b)). Foreach vineyard, the samples which presented the highest values in this principal component were V5, Z7 in 2008 vintage and 2V6, 2Z6 and 2Z7 in 2009 vintage (Supplementary Figure 2(a)). It could reveal the optimum harvest date taking into account not only the sensory maturity but also the phenolic ripeness.
The loadings plot ((b)) shows that the most important variables in this principal component are mainly the sensory variables. (b) shows a relationship among skin dilaceration (Dil), type of aroma (Ar) and to a lesser extent AI. The sensory scores of these variables tend to increase during ripening. This pattern suggests that skin dilaceration (Dil) may have relationship with aroma parameters but not with the rest of the sensory parameters [i.e. TI, astringency (A), acidity (Ac) and dryness (D)] evaluated. Easiness of skin dilaceration increases during ripening and could improve the release of volatile compounds.
Phenolic compounds of grape skins present in PC 1 a similar pattern to skin dilaceration , type of aroma (Ar) and AI, especially anthocyanins (Ant) and dimers of procyanidins (Dim). These compounds also increased during ripening. Nevertheless, TI, astringency (A), dryness (D) and acidity (Ac) present an opposite pattern which indicates a decrease of these sensory scores during ripening. Moreover, dryness (D) and acidity (Ac) present a high relationship in PC 1, which is less noticeable in the case of TI and astringency (A). This can be inferred from b) where the loadings of these variables are presented.
PC 2 shows a clear separation between 2008 and 2009 vintages (a)). This pattern has been emphasized in Supplementary Figure 2(b). The loadings plot (b)) shows that the most important variables in this principal component are prodelphinidins (PD), hydroxybenzoic acids (HB) and to lesser extend flavonols (Flavo) and AI, since they present the highest absolute values in this principal component loading. This pattern suggests higher values of these compounds prodelphinidins (PD), hydroxybenzoic acids (HB) and flavonols (Flavo) in the 2009 vintage and more intense aroma (AI) in the 2008 vintage. The intensity of aroma trend has already been observed in Supplementary which present the results obtained only from the sensory analysis.
Conclusions
Multivariate analysis was applied to sensory and phenolic composition of grape skin. This procedure has shown the evolution of these samples during ripening and the relationship among sensory scores and phenolic composition of grapes skins. The relationship between some studied sensory parameters and phenolic compounds may be indirect and cannot be easily described by their phenolic composition. Therefore, a wide study could be useful in order to explain the variation in the aforementioned sensory attributes taking into account not only the phenolic composition but also volatile composition, etc.
tcyt_a_601430_sup_27125796.pdf
Download PDF (1.6 MB)Acknowledgments
Thanks are due to the Spanish MICINN (Project ref. AGL2008-05569-C02-01), to Junta de Castilla y León (group GR133) and to the Consolider-Ingenio 2010 Programme (FUN-C-FOOD, CSD2007-00063) for financial support. R. Ferrer-Gallego thanks the Spanish MICINN for the F.P.I. predoctoral scholarship. The authors also thank Bodegas RODA S.A. (Haro, La Rioja, Spain) for supplying the grape samples and the sensory panel for tasting and evaluating the samples.
References
- Brereton , R. G. 2003 . Chemometrics: Data analysis for the laboratory and chemical plant , Chichester, West Sussex , UK : John Wiley .
- Condelli , N. , Dinnella , C. , Cerone , A. , Monteleone , E. and Bertuccioli , M. 2006 . Prediction of perceived astringency induced by phenolic compounds II: Criteria for panel selection and preliminary application on wine samples . Food Quality and Preference , 17 : 96 – 107 .
- Darias-Martín , J. , Díaz-González , D. and Díaz-Romero , C. 2004 . Influence of two pressing processes on the quality of must in white wine production . Journal of Food Engineering , 63 : 335 – 340 .
- Darias-Martín , J. , Rodríguez , O. , Diaz , E. and Lamuela-Raventós , R. M. 2000 . Effect of skin contact on the antioxidant phenolics in white wine . Food Chemistry , 71 : 483 – 487 .
- de Freitas , V. and Mateus , N. 2001 . Structural features of procyanidin interactions with salivary proteins . Journal of Agricultural and Food Chemistry , 49 : 940 – 945 .
- Delcour , J. A. , Vandenberghe , M. M. , Corten , P. F. and Dondeyne , P. 1984 . Flavor thresholds of polyphenolics in water . American Journal of Enology and Viticulture , 35 : 134 – 136 .
- Ferrer-Gallego , R. , Hernández-Hierro , J. M. , Rivas-Gonzalo , J. C. and Escribano-Bailón , M. T. 2011 . Determination of phenolic compounds of grape skins during ripening by NIR spectroscopy . LWT – Food Science and Technology , 44 : 847 – 853 .
- Hufnagel , J. C. and Hofmann , T. 2008 . Quantitative reconstruction of the nonvolatile sensometabolome of a red wine . Journal of Agricultural and Food Chemistry , 56 : 9190 – 9199 .
- Jackson , R. S. 2009 . Wine tasting , 2nd ed. , San Diego : Academic Press .
- Kielhorn , S. and Thorngate III , J. H. 1999 . Oral sensations associated with the flavan-3-ols (+)-catechin and (−)-epicatechin . Food Quality and Preference , 10 : 109 – 116 .
- Lee , C. Y. and Jaworski , A. W. 1990 . Identification of Some Phenolics in White Grapes . American Journal of Enology and Viticulture , 41 ( 1 ) : 87 – 89 .
- Le Moigne , M. , Maury , C. , Bertrand , D. and Jourjon , F. 2008 . Sensory and instrumental characterisation of Cabernet Franc grapes according to ripening stages and growing location . Food Quality and Preference , 19 : 220 – 231 .
- Lesschaeve , I. and Noble , A. C. 2005 . Polyphenols: factors influencing their sensory properties and their effects on food and beverage preferences . The American Journal of Clinical Nutrition , 81 ( 1 ) : 330S – 335S .
- Massart , D. L. , Vandeginste , B. G. , Buydens , L. M. , Lewi , P. J. , Smeyers-Verbeke , J. and Jong , S. D. 1998 . Handbook of chemometrics and qualimetrics , Amsterdam, The Netherlands : Elsevier Science Inc .
- Obreque-Slier , E. , López-Solís , R. , Peña-Neira , Á. and Zamora-Marín , F. 2010 . Tannin–protein interaction is more closely associated with astringency than tannin–protein precipitation: Experience with two oenological tannins and a gelatin . International Journal of Food Science & Technology , 45 : 2629 – 2636 .
- Peleg , H. , Gacon , K. , Schlich , P. and Noble , A. C. 1999 . Bitterness and astringency of flavan-3-ol monomers, dimers and trimers . Journal of the Science of Food and Agriculture , 79 : 1123 – 1128 .
- Rousseau , J. and Delteil , D. 2000 . Présentation d'une méthode d'analyse sensorielle des raisins. Principe, méthode et grille d'interprétation . Revue Française d'Oenologie , 183 : 10 – 13 .
- Sáenz-Navajas , M. P. , Ferreira , V. , Dizy , M. and Fernández-Zurbano , P. 2010 . Characterization of taste-active fractions in red wine combining HPLC fractionation, sensory analysis and ultra performance liquid chromatography coupled with mass spectrometry detection . Analytica Chimica Acta , 673 : 151 – 159 .
- Santos-Buelga , C. and Freitas , V. 2009 . “ Influence of phenolics on wine organoleptic properties ” . In Wine chemistry and biochemistry , Edited by: Moreno-Arribas , M. V. and Polo , C. (pp. 529–570). New York , , USA : Springer .
- Vidal , S. , Francis , L. , Guyot , S. , Marnet , N. , Kwiatkowski , M. and Gawel , R., Cheynier, V., & Waters, E.J. 2003 . The mouth-feel properties of grape and apple proanthocyanidins in a wine-like medium . Journal of the Science of Food and Agriculture , 83 : 564 – 573 .
- Vidal , S. , Francis , L. , Noble , A. , Kwiatkowski , M. , Cheynier , V. and Waters , E. 2004 . Taste and mouth-feel properties of different types of tannin-like polyphenolic compounds and anthocyanins in wine . Analytica Chimica Acta , 513 ( 1 ) : 57 – 65 .
Supplementary material
Supplementary Table 1. Phenolic composition of grape skins (mg g−1 of grape skins).
Tabla adicional 1. Composición fenólica de los hollejos (mg g−1 de hollejo).
Supplementary Figure 1. Sensory analysis of grape skins during ripeness. Skin dilaceration (Dil), tannic intensity (TI), astringency (A), acidity (Ac), aroma intensity (AI), dryness (D) and type of aroma (Ar).
Figura adicional 1. Análisis sensorial de los hollejos de uva durante la maduración. Facilidad de dilaceración (Dil), intensidad tánica (TI), astringencia (A), acidez (Ac), intensidad de aroma (AI), sequedad (D) y tipo de aroma (Ar).
Supplementary Figure 2. Bar diagrams of the scores in the first (a) and the second (b) principal components.
Figura adicional 2. Diagrama de barras de las puntuaciones del primer (a) y del segundo (b) componente principal.