
Abstract
Iron microencapsulation is one of the best approaches to achieve controlled iron release in fortified foods as it not only reduces the apparent organoleptic problems but also increases the bioavailability of iron. The present study was carried out to prepare iron microencapsules using different methods for food fortification. Microencapsules were prepared using liposome, fatty acid esters (FAE), freeze-drying and emulsification methods. Among all the microencapsules, those prepared using FAE method resulted in lowest encapsulation efficiency (EE); however, highest EE was observed for emulsification method. Three microencapsules were selected for fortification of milk, i.e. egg phosphatidylcholine liposomes, sodium alginate (SA) and modified starch microencapsules prepared by freeze-drying method and SA microencapsules prepared by emulsification method that had EE 64.047%, 62.972% and 74.850%, respectively. Sensory analysis revealed that SA and MS microencapsules fortified milk containing 10 mg/L iron, resembled control (unfortified) milk the most as compared to others.
El microencapsulado del hierro es uno de los mejores métodos para lograr la liberación controlada de hierro en los alimentos fortificados, ya que no solo reduce los problemas organolépticos aparentes sino que también eleva la biodisponibilidad de hierro. El presente estudio se realizó con el fin de preparar microencapsulados de hierro utilizando distintos métodos destinados a fortificar los alimentos. Dichos microencapsulados fueron preparados haciendo uso de liposomas, de ésteres de ácidos grasos (fae), de la liofilización y de métodos de emulsificación. De todos los microencapsulados obtenidos, los preparados utilizando el método fae mostraron la eficiencia de encapsulado (ee) más baja, mientras que los elaborados utilizando el método de emulsificación tuvieron la ee más alta. Para la fortificación de la leche se seleccionaron tres microencapsulados, a saber, liposomas de fosfatidilcolina de huevo, alginato de sodio (sa) y microencapsulados de almidón modificado (ms) elaborados por el método de liofilización, y microencapsulados de sa preparados por el método de emulsificación, los cuales mostraron una ee de 64.047%, 62.972% y 74.850%, respectivamente. El análisis sensorial evidenció que la leche fortificada mediante microencapsulados de sa y de ms con un contenido de 10 mg/L de hierro se asemejó más a la leche de control (sin fortificar) que la leche fortificada a través de los demás métodos de fortificación.
1. Introduction
Iron is an essential trace element; its deficiency causes lower growth rate, impaired cognitive scores in children, poor pregnancy outcomes and lower working capacity in adults (Derbyshire, Brennan, Li, & Bokhari, Citation2010). In India, 79% of children between 6 and 35 months and women between 15 and 49 years of age are anaemic; inadequate intake of iron and consumption of foods low in bioavailable iron are identified as the major cause of iron deficiency anaemia (Tripathi & Platel, Citation2011). Among the multiple strategies used to control micronutrients deficiencies, i.e. dietary modifications, supplementations and food fortification, food fortification seems to be the most practical and long-term approach (Akhtar, Anjum, & Anjum, Citation2011).
Food fortification is an effective measure to increase the intake of iron without causing a change in the existing dietary patterns (Tripathi & Platel, Citation2011). Milk and milk-based products are good carriers of iron, not only due to worldwide consumption by all age groups but also because of their high nutritional value and positive effect on growth, cognition and morbidity (Boccio & Monteiro, Citation2004). An advantage of using milk and milk products as the vehicle for fortifying iron is that, it has a relatively high iron bioavailability (Woestyne, Bruyneel, Mergeay, & Verstraeta, Citation1991).
Adding iron directly to the milk results in reaction with milk components (lipids and protein) further resulting in decreased bioavailability and development of organoleptic problems such as colour, odour and taste (Gaucheron, Citation2000). Hence, to reduce the apparent organoleptic problems and increase the bioavailability, microencapsulation of iron is one of the best approaches (Khosroyar, Akbarzade, Arjoman, Safekordi, & Mortazavi, Citation2012). Microencapsulation process has gained considerable attention as a convenient drug delivery and controlled drug release system (De souza et al., Citation2013). The use of microencapsulation technologies to retard or avoid the oxidation of iron has been reported earlier and has also drawn considerable attention (Abbasi & Azari, Citation2011; Khosroyar et al., Citation2012; Kwak, Yang, & Ahn, Citation2003; Xia & Xu, Citation2005). Ferrous sulphate heptahydrate has been used as core material for preparation of iron microencapsules as it is the cheapest iron source with high iron bioavailability. Various researchers have microencapsulated iron using different iron salts, i.e. ferric ammonium sulphate, ferrous sulphate and ferric chloride by fatty acid ester (FAE) method (Jackson & Lee, Citation1992a, Citation1992b; Kim, Ahn, Seok, & Kwak, Citation2003; Kwak, Ihm, & Ahn, Citation2001; Kwak et al., Citation2003); ferrous sulphate and ferric ammonium sulphate by liposome method (Abbasi & Azari, Citation2011; Xia & Xu, Citation2005) and ferric saccharate by emulsification method (Khosroyar et al., Citation2012). Freeze-drying is also a suitable and multistage technique for dehydration and microencapsulation of various heat-sensitive materials (Ezhilarasi, Indrani, Jena, & Anandharamakrishnan, Citation2013). Chandramouli, Kailasapathy, Peiris, and Jones (Citation2004), Gbassi, Vandamme, Ennahar, and Marchioni (Citation2009) and Kim et al. (Citation2008) used sodium alginate (SA) as wall material for microencapsulation of various probiotic bacteria using freeze-drying. At present, studies are not available for microencapsulation of iron using SA as wall material in combination with freeze-drying.
Therefore, the present study was focused on preparation of iron microencapsules by liposome, FAE, emulsification and freeze-drying method and elucidated for their EE. Milk was also fortified with iron microencapsules and was evaluated for its sensory properties.
2. Materials and methods
2.1. Materials
Iron salt (FeSO4 heptahydrate), L-α-phosphatidylcholine (lecithin, from egg), apple pectin, Tween 80 and Tween 60 were procured from Sigma Aldrich, St. Louis, MO, USA. Polyglycerol monostearate (PGMS) was obtained from two sources, i.e. Zhengzhou Honest Food Co., Ltd., Mainland, China, and Oleon, Ertvelde, Europe. L-α-phosphatidylcholine (lecithin, from soy bean) was obtained from Srinidhi Enterprises, Indore, India. Modified starch HiCap 100 (MS) was obtained from CP Ingredients Pvt. Ltd., Mumbai, India. Ascorbic acid, cholesterol, SA, dihydrogen sodium phosphate and calcium chloride were purchased from Thermo Fisher Scientific India Pvt. Ltd., Mumbai, India. Cellulose membrane (wall thickness 28 µm) was procured from Membrane Filtration Products, St. Seguin, TX, USA. Fresh cow and buffalo milk were collected from cattle yard of National Dairy Research Institute, Karnal, India. Chemicals used were of AR grade. Milli Q water (10 µS) and acid washed glassware were used throughout the experiments.
2.2. Microencapsulation of iron by liposome method
Iron liposomes were prepared using the method of Abbasi and Azari (Citation2011). Briefly, 1.14 g L-α-phosphatidylcholine (lecithin) and 60 mg cholesterol were dissolved in 30 mL diethyl ether (organic phase). Organic phase was then mixed with 10 mL of citric acid sodium phosphate buffer solution (105 mg citric acid and 71 mg di-sodium hydrogen phosphate were dissolved in 50 mL water, pH was adjusted to 6.8 using 0.1 N NaOH) containing 438 mg iron salt (FeSO4 heptahydrate) and 30 mg ascorbic acid. Mixture of aqueous (citric acid sodium phosphate buffer solution) and organic phase was placed in a water bath maintained at 5°C for sonication using a probe sonicator (Sonics and Materials Inc., New Town, CT, USA) with 5.0-sec pulse rate for 10 min to prepare an emulsion. Furthermore, the organic solvent was evaporated using a rotary evaporator (absolute pressure 300 mbar, temperature 60°C) (RV 10 DS 96, IKA, Wilmington, NC, USA) and gel was formed. The gel was broken after persistent evaporation in rotary evaporator. The aqueous phase (20 mL) containing Tween 80 (5% v/v) was added and rest of diethyl ether was evaporated. Liposomes were lyophilised (−50°C, 6.67 Pa) using a freeze-dryer (Daihan Lab Tech India Pvt. Ltd., Hyderabad, India), powdered and stored in airtight glass containers.
2.3. Microencapsulation of iron by FAE method
FAE method of iron microencapsulation reported by Kwak et al. (Citation2003) was used. A measure of 5 g of PGMS with 50 mL of distilled water was heated at 55°C for 20 min and mixed thoroughly with stirring at 800 rpm. Measures of 1 g of iron salt and 60 mg of ascorbic acid were added into the solution, and the resulting mixture was stirred at 800 rpm for 1 min. Mixture was nebulised using an airless paint sprayer into a cylinder containing 0.05% Tween 60 solution at 5°C. The diameter of nozzle orifice was 1.4 mm. Microencapsules were formed as lipid solidified in the chilled fluid (Tween 60). The chilled fluid was centrifuged at 2490 × g for 10 min to separate iron microencapsules. Microencapsules were lyophilised, powdered and stored in airtight glass containers.
2.4. Microencapsulation of iron by freeze-drying method
Method of Kim et al. (Citation2008) was modified for preparation of iron microencapsules. Microencapsules were prepared using SA, pectin and MS. Briefly, three samples were prepared by dissolving 2 g SA (I), 1 g SA and 1 g pectin (II) and 1.0 g SA and 1.0 g MS (III) in 100 mL water. Content was mixed on magnetic stirrer for 30 min at 500 rpm. It was then degassed for 15 min using sonicator. Iron salt (200 mg) and ascorbic acid in the ratio of 15:1 were added to it and stirred using the magnetic stirrer at 500 rpm for 30 min. Solution was then sprayed in different concentration of chilled CaCl2 solution (0.1, 0.5 and 1 mol/L CaCl2). Microencapsules formed were allowed to remain in the chilled CaCl2 solution for 3–4 hrs for solidification. Content was filtered for removal of CaCl2 through vacuum filtration assembly using Whatman No. 1 filter paper. It was then frozen at −20°C and freeze-dried using lyophiliser to obtain a free-flowing powder.
2.5. Microencapsulation of iron by emulsification method
Microencapsulation of iron by emulsification method was assessed by Khosroyar et al. (Citation2012). Measures of 1.5 g of SA and 0.798 mg ferrous sulphate were dissolved to 100 mL water. Sunflower oil containing Tween 80 in the ratio of 100:0.5 (oil:Tween) was separately prepared using a magnetic stirrer at 900 rpm for 20 min. The mixture of SA and ferrous sulphate was added drop by drop to 500 mL of oil solution (aqueous mixture to oil ratio of 1:5) and stirred at 900 rpm/30 min for emulsion formation. A 500 mL of 0.1 mol/L CaCl2 solution was then added to the emulsion and stirred for another 20 min. Mixture was then left undisturbed for 30 min allowing phase separation of oil and water and microencapsules.
Oil–water phase was then discarded and capsules were washed thrice with distilled water. It was then centrifuged twice at 3000 rpm for 15 min. Finally, microencapsules were collected and freeze-dried using a lyophiliser.
In this process, the calcium chloride solution was added both slowly and rapidly for disruption of emulsion, and the effect of addition process on EE was also elucidated.
2.6. Estimation of iron content
Iron content of microencapsules was estimated using AAS (AA-7000, Shimadzu, Tokyo, Japan) using the method described by AOAC (Citation2005). Microencapsules were subjected to ashing (at 550°C for 8 hrs), solubilised in triacid mixture and heated for complete dissolution. All the samples were diluted to a suitable dilution before analysis by AAS at λmax = 248.3 nm.
2.7. Encapsulation efficiency
2.7.1. Method 1
Encapsulation efficiency (EE) of iron microencapsules was determined by the method standardised by Abbasi and Azari (Citation2011) for estimation of EE of liposomes. Total iron content was estimated using the same method as described in Section 2.6. To measure the encapsulated iron or bound iron content in liposomes and microencapsules (emulsification method), they were filled in cellulose membrane bag (molecular weight cut-off 12,000 Da) and dialysed against deionised water for 24 hrs at 4°C, where nonencapsulated iron was removed. Microencapsules that remained inside the cellulose membrane bags were then treated in the same way as described in Section 2.6.
2.7.2. Method 2
Method standardised by Abbasi and Azari (Citation2011) for estimation of EE of microencapsules prepared by FAE method was adapted for estimation of EE of iron microencapsules. Iron microencapsules were separated from rest of the mixture by centrifugation/filtration during preparation of iron microcapsules by FAE method and freeze-drying method. It was assumed that iron in the pellet/retentate was in bound form. Nonencapsulated iron was present in centrifuged supernatant/filtrate and was estimated using the same method as described in Section 2.6. Encapsulated/bound iron was calculated by subtracting the nonencapsulated iron from total iron. Iron content that was initially added for the preparation of iron microencapsules was the total iron content. Encapsulation efficiency was calculated as follows:
2.8. Fortification in milk
Fresh cow and buffalo milk were mixed in the ratio of 1:1 and standardised to the fat and SNF percent of toned milk. Toned milk (3% fat and 8.5% solid not fat [SNF]) was fortified with iron salt (ferrous sulphate) and iron microencapsules (10 mg/L iron). Addition of iron salt and iron microencapsules was accompanied by mixing for 10 min with the help of magnetic stirrer for the complete dissolution of fortificants. After mixing, the milk samples were pasteurised at 63°C for 30 min followed by cooling to 4°C.
2.8.1. Sensory evaluation of fortified milk
Prepared milk samples were evaluated by the sensory panelists. Sensory panel of 10 trained judges were asked to grade all microencapsules fortified milk samples for any change in colour and appearance, odour, taste and mouthfeel. Composite score card for sensory analysis of milk as approved by Bureau of Indian Standards [BIS] (IS: 7768, Citation1975) was used. In taste characteristics, the main focus was on metallic, rancid and oxidised taste. Other mentioned taste characteristics, e.g. cowy, acidic, astringent, bitter, cooked, flat, foreign, malty, salty and barney were excluded. All sensory assessments took place in Dairy Chemistry Division of National Dairy Research Institute, Karnal, India. The sensory booth environment was held at a constant temperature (20°C), red lighting was used to obscure any colour differences between the samples and a positive airflow removed any odours from the testing area. Saline water (0.89% sodium chloride solution) at 25°C was provided as palate cleanser for rinsing mouth and cleaning the tongue before sensory evaluation of each sample.
2.9. Statistical analysis
Means and standard error mean was calculated using Microsoft Excel 2010 (Microsoft Corp., Redmond, WA, USA). Significant difference between the EE of iron microencapsules were verified by one-way analysis of variance followed by a least significant difference test at 95% confidence (Snedecor & Cochran, Citation1989).
3. Results and discussion
3.1. EE of iron microencapsules
EE of iron microencapsules prepared by liposome method and emulsification method were estimated by only method 1, while for iron microencapsules prepared by FAE method and freeze-drying method, it was estimated by both the methods. During preparation of iron microencapsules by FAE method and freeze-drying method, filtrate/supernatant were obtained, which contain free iron, while in iron microencapsules preparation by liposome and emulsification method, filtrate/supernatant were not obtained; therefore, only method 1 was preferred for estimation of EE of iron microencapsules prepared by liposome and emulsification method.
Liposomes were prepared by the reverse-phase evaporation method using both egg and soy phosphatidylcholine. EE of iron microencapsules prepared using egg phosphatidylcholine was significantly higher (p < 0.05) than soy phosphatidylcholine (). Our results were in agreement with Xia and Xu (Citation2005) who reported EE of egg phosphatidylcholine as 67%. Abbasi and Azari (Citation2011) did not specify the type of phosphatidylcholine but reported the EE of liposomes to be 85.5%, which was higher than the obtained results. Among these two microencapsules, iron microencapsules prepared using egg phosphatidylcholine was selected for fortification in milk.
Figure 1. EE of microencapsules prepared by liposome method.Note: a,bSamples represented with different letters are significantly different (p < 0.05) from each other. Error bars show the variations of three determinations in terms of standard error of mean.
Figura 1. ee de microencapsulados preparados por el método de liposomas.Nota: a,bLas muestras representadas con letras diferentes son significativamente diferentes (p < 0,05). Las barras de error muestran las variaciones de tres determinaciones en términos de error estándar de la media.
Two different PGMS samples were used for preparation of iron microencapsules by FAE method. According to method 1, EE of iron microencapsules prepared using PGMS Zhengzhou was significantly lower (p < 0.05) than PGMS Oleon (). PGMS Oleon showed higher EE (34.79%) as compared to PGMS Zhengzhou (19.79%). Results revealed that the rate of release of iron from the microencapsules prepared using PGMS Oleon was slower than PGMS Zhengzhou, which might be due to inherent properties of the PGMS supplied by the respective firms. According to method 2, EE of iron microencapsules prepared using PGMS Zhengzhou did not differ significantly (p > 0.05) from PGMS Oleon (). This might be due to less entrapment of iron inside the microencapsules during centrifugation. Since, both the microencapsules showed low EE, therefore were not selected for fortification in milk. Abbasi and Azari (Citation2011) also evaluated the PGMS iron microencapsules for EE using the same method but reported a higher EE of 81.8%. Kim et al. (Citation2003) also reported higher values for EE of PGMS iron microencapsules as 73%.
Figure 2. EE of microencapsules prepared by FAE method. (a) EE estimated by method 1 and (b) EE estimated by method 2.Notes: a,bSamples represented with different letters are significantly different (p < 0.05) from each other. Error bars show the variations of three determinations in terms of standard error of mean.
Figura 2. ee de microencapsulados preparados por el método fae (a) ee estimada por el método 1 (b) ee estimada por el método 2.Nota: a,bLas muestras representadas con letras diferentes son significativamente diferentes (p < 0,05). Las barras de error muestran las variaciones de tres determinaciones en términos de error estándar de la media.
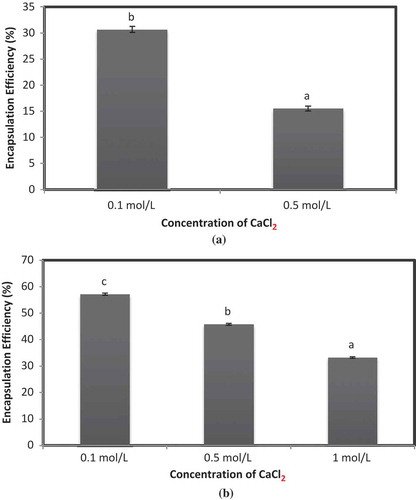
Initially, iron microencapsules prepared using a blend of SA and pectin as coating material were elucidated for the effect of different concentration of CaCl2 on EE of iron microencapsules. According to method 1, EE of iron microencapsules prepared using SA + pectin (0.1 mol/L CaCl2) was significantly higher (p < 0.05) than SA + pectin (0.5 mol/L CaCl2) (). Iron microencapsules comprising SA + pectin 1 mol/L CaCl2 were difficult to dry and resulted in lower EE. CaCl2 is hygroscopic at higher concentration and it also interfered with the drying of the microencapsules as it formed a sticky mass on drying. According to method 2, EE of all the iron microencapsules were significantly different (p < 0.05) from each other (). SA + pectin 0.1 mol/L CaCl2 showed higher EE as compared to SA + pectin 0.5 mol/L CaCl2 and SA + pectin 1 mol/L CaCl2. It is evident from the preceding results that EE of iron microencapsules decreased with increase in the concentration of CaCl2.
Figure 3. EE of microencapsules prepared by freeze-drying method using SA + pectin as wall material. (a) EE estimated by method 1 and (b) EE estimated by method 2. Note: a,b,cSamples represented with different letters are significantly different (p < 0.05) from each other. Error bars show the variations of three determinations in terms of standard error of mean.
Figura 3. ee de microencapsulados preparados por el método de liofilización usando sa + pectina como material de paredes (a) ee estimada por el método 1 (b) ee estimada por el método 2.Nota: a,b,cLas muestras representadas con letras diferentes son significativamente diferentes (p < 0,05). Las barras de error muestran las variaciones de tres determinaciones en términos de error estándar de la media.
It is concluded from the preceding two methods used for calculating the EE that 0.1 mol/L CaCl2 was the most suitable cooling and hardening medium for microencapsulation of iron. Our results were in agreement with Chandramouli et al. (Citation2004) who evaluated the effect of different concentrations of CaCl2 solution (0.1, 0.2 and 1 mol/L) on viability of microencapsulated Lactobacillus spp. and found that increase in CaCl2 concentration beyond 0.1 mol/L during encapsulation did not improve the capsules efficacy in protecting the viable cells.
Estimation of EE by method 2 was faster as compared to method 1 as no dialysis was required for the separation of the free iron, which took almost 24 hrs. Similar trend was observed by both the methods for EE of all the iron microencapsules formulated. However, higher value of EE was estimated by method 2 as compared to method 1. Method 2 estimated the iron content in the filtrate whereas method 1 in the dialysed water. Higher EE of microencapsules by method 2 revealed higher entrapment of iron inside the microencapsules during preparation, whereas higher EE of microencapsules by method 1 showed lower release of iron in the aqueous system.
Concentration of CaCl2 0.1 mol/L was used for further preparation of iron microencapsules by freeze-drying method using SA and blend of SA + MS. According to method 1, EE of iron microencapsules prepared using SA + MS (0.1 mol/L CaCl2) was significantly higher (p < 0.05) than SA (0.1 mol/L CaCl2) ()). Similar trend was observed by method 2 ()). It is evident from the preceding results that MS enhances the EE of iron microencapsules. The results obtained were in agreement with the observations of Sultana et al. (Citation2000) who reported that incorporation of Hi-maize starch (a prebiotic) with SA improved encapsulation of viable bacteria. Tan, Chan, and Heng (Citation2009) microencapsulated fish oil by spray-drying using a blend of SA and starch and observed that the addition of SA to the wall component resulted in rounder microspheres with higher oil encapsulation efficiencies. Microencapsulated oil was found to be more stable to degradation than unencapsulated oil.
Figure 4. EE of microencapsules prepared using SA and SA + MS by freeze-drying method. (a) EE estimated by method 1 and (b) EE estimated by method 2. Note: a,bSamples represented with different letters are significantly different (p < 0.05) from each other. Error bars show the variations of three determinations in terms of standard error of mean.
Figura 4. ee de microencapsulados preparados utilizando sa y sa + ms por el método de liofilización (a) ee estimada por el método 1 (b) ee estimada por el método 2.Nota: a,bLas muestras representadas con letras diferentes son significativamente diferentes (p < 0,05). Las barras de error muestran las variaciones de tres determinaciones en términos de error estándar de la media.
In emulsification method, the emulsion of oil and water phase was disrupted by chilled 0.1 mol/L CaCl2 solution. CaCl2 solution of 0.1 mol/L was added both slowly and rapidly for disruption of emulsion, and the effect of addition process on EE was elucidated. EE of iron microencapsules prepared by slow addition of CaCl2 was significantly lower (p < 0.05) than fast addition of CaCl2 (). It is evident from the preceding results that deemulsification should be fast for higher EE.
Figure 5. EE of microencapsules prepared by emulsification method using SA as wall material. Note: a,bSamples represented with different letters are significantly different (p < 0.05) from each other. Error bars show the variations of three determinations in terms of standard error of mean.
Figura 5. ee de microencapsulados preparados por el método de emulsificación utilizando sa como material de paredes.Nota: a,bLas muestras representadas con letras diferentes son significativamente diferentes (p < 0,05). Las barras de error muestran las variaciones de tres determinaciones en términos de error estándar de la media.
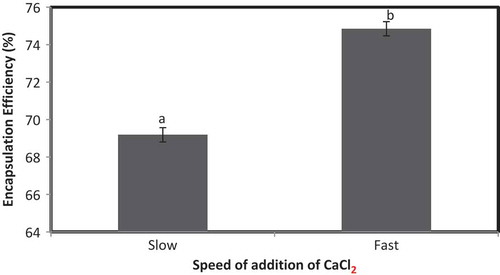
Khosroyar et al. (Citation2012) encapsulated ferric saccharate with fast addition of calcium alginate and observed a decrease in organoleptic and appearance problem and enhanced bioavailability. Fast addition of CaCl2 solution resulted in immediate disruption of the emulsion and provides very less time for coalescence, and therefore, smaller size microencapsules were formed with higher EE. Slow addition of CaCl2 solution provides sufficient time for coalescence, and therefore, bigger size microencapsules were formed with lower EE.
3.2. Effect of iron fortification on sensory scores of milk
Among all the microencapsules, three microencapsules were selected for fortification in milk on the basis of their EE, i.e. egg phosphatidylcholine liposomes, SA + MS microencapsules prepared by freeze-drying method and SA microencapsules with fast addition of CaCl2 prepared by emulsification method. These milk samples were evaluated for effect of fortification on sensory properties. Effects of fortification on sensory properties of milk are illustrated in . Colour and appearance scores of liposome fortified milk were lowest followed by SA microencapsules, SA + MS microencapsules and control (unfortified) milk. Similar trend was observed for odour, taste, mouthfeel and total scores. Colour and appearance scores of SA + MS microencapsules fortified milk was nonsignificantly different (p > 0.05) from control (unfortified) milk. Odour, taste, mouthfeel and total scores of SA + MS microencapsules were nonsignificantly different (p > 0.05) from control (unfortified) milk but showed lower values as compared to control (unfortified) milk. SA + MS microencapsules fortified milk showed highest resemblance with control (unfortified) milk as compared to liposome and SA microencapsules fortified milk. Liposomes were hard to dissolve and took around 45 min for their complete dissolution in milk. Milk fortified with liposomes had an oily and unacceptable odour and taste. Lower odour and taste scores of this milk were not due to the oxidised flavour but due to the inherent flavour of phosphatidylcholine. It also imparted slight yellow–brown colour to the milk. Therefore, lowest sensory scores were observed for liposome fortified milk. SA microencapsules were prepared using sunflower oil, and after deemulsification, some amount of oil adhered to the microencapsules. Therefore, lower sensory scores were observed as compared to SA + MS microencapsules fortified and control (unfortified) milk. Abbasi and Azari (Citation2011) fortified milk with liposomes and FAE microencapsules and reported a significant difference between treated and control samples regarding smell and metallic taste, whereas nonsignificant differences were observed in terms of astringency, bitterness and colour scores. They also reported that FAE microencapsules showed similar results to control particularly at low concentration (7 mg/L).
Table 1. Sensory scores of fortified milk (10 mg/L iron).
Tabla 1. Puntajes sensoriales de la leche fortificada (con 10 mg/L de hierro).
4. Summary and conclusion
Iron microencapsules were prepared using four different methods and evaluated for EE. It was observed that higher concentration of CaCl2 decreased the EE of microencapsules prepared using SA as wall material. Incorporation of MS along with SA increased the EE of microencapsules. Three microencapsules were finally selected for fortification of milk on the basis of their better EE. Sensory analysis revealed that SA + MS microencapsules fortified milk resembled control (unfortified) milk.
Acknowledgements
The authors would like to thank Zhengzhou Honest Food Co., Ltd., Mainland, China and Oleon, Ertvelde, Europe for providing PGMS and CP Ingredients Pvt. Ltd., Mumbai, India for providing modified starch HiCap 100.
References
- Abbasi, S., & Azari, S. (2011). Efficiency of novel iron microencapsulation techniques: Fortification of milk. International Journal of Food Science and Technology, 46, 1927–1933. doi:10.1111/j.1365-2621.2011.02703.x
- Akhtar, S., Anjum, F. M., & Anjum, M. A. (2011). Micronutrient fortification of wheat flour: Recent development and strategies. Food Research International, 44, 652–659. doi:10.1016/j.foodres.2010.12.033
- AOAC (2005). Official methods of analysis. The Association of Official Analytical Chemists. 18th Edition. 481. North Fredrick Avenue Gaithersburg, Maryland, USA.
- Boccio, J., & Monteiro, J. B. (2004). Food fortification with iron and zinc: Pros and cons from a dietary and nutritional viewpoint. Revista de Nutrição, 17(1), 71–78. doi:10.1590/S1415-52732004000100008
- Chandramouli, V., Kailasapathy, K., Peiris, P., & Jones, M. (2004). An improved method of microencapsulation and its evaluation to protect Lactobacillus spp. in simulated gastric conditions. Journal of Microbiological Methods, 56, 27–35. doi:10.1016/j.mimet.2003.09.002
- De souza, J. R. R., Feitosa, J. P. A., Ricardo, N. M. P. S., Trevisan, M. T. S., De paula, H. C. B., Ulrich, C. M., & Owen, R. W. (2013). Spray drying encapsulation of mangiferin using natural polymers. Food Hydrocolloids, 33, 10–18. doi:10.1016/j.foodhyd.2013.02.017
- Derbyshire, E., Brennan, C. S., Li, W., & Bokhari, F. (2010). Iron deficiency – is there a role for the food industry? International Journal of Food Science and Technology, 45, 2443–2448. doi:10.1111/j.1365-2621.2010.02431.x
- Ezhilarasi, P. N., Indrani, D., Jena, B. S., & Anandharamakrishnan, C. (2013). Freeze drying technique for microencapsulation of Garcinia fruit extract and its effect on bread quality. Journal of Food Engineering, 117(4), 513–520. doi:10.1016/j.jfoodeng.2013.01.009
- Gaucheron, F. (2000). Iron fortification in dairy industry. Trends in Food Science and Technology, 11, 403–409. doi:10.1016/S0924-2244(01)00032-2
- Gbassi, G. K., Vandamme, T., Ennahar, S., & Marchioni, E. (2009). Microencapsulation of Lactobacillus plantarum spp. in an alginate matrix coated with whey proteins. International Journal of Food Microbiology, 129, 103–105. doi:10.1016/j.ijfoodmicro.2008.11.012
- IS: 7768. (1975). Methods for sensory evaluation of milk. Manak Bhawan, New Delhi: Indian Standard Institution.
- Jackson, L. S., & Lee, K. (1992a). The effect of dairy products on iron availability. Critical Reviews in Food Science and Nutrition, 31(4), 259–270. doi:10.1080/10408399209527573
- Jackson, L. S., & Lee, K. (1992b). Fortification of cheese with microencapsulated iron. Cultured Dairy Products Journal, 27, 4–7.
- Khosroyar, S., Akbarzade, A., Arjoman, M., Safekordi, A. A., & Mortazavi, S. A. (2012). Ferric–saccharate capsulation with alginate coating using the emulsification method. African Journal of Microbiology Research, 6(10), 2455–2461.
- Kim, S. J., Ahn, J., Seok, J. S., & Kwak, H. S. (2003). Microencapsulated iron for drink yogurt fortification. Asian-Australian Journal of Animal Sciences, 16(4), 581–587.
- Kim, S. J., Cho, S. Y., Kim, S. H., Song, O. J., Shin, I. S., Cha, D. S., & Park, H. J. (2008). Effect of microencapsulation on viability and other characteristics in Lactobacillus acidophilus ATCC 43121. LWT – Food Science and Technology, 41, 493–500. doi:10.1016/j.lwt.2007.03.025
- Kwak, H. S., Ihm, M. R., & Ahn, J. (2001). Microencapsulation of β-galactosidase with fatty acid esters. Journal of Dairy Science, 84, 1576–1582. doi:10.3168/jds.S0022-0302(01)74590-0
- Kwak, H. S., Yang, K. M., & Ahn, J. (2003). Microencapsulated iron for milk fortification. Journal of Agricultural and Food Chemistry, 51(26), 7770–7774. doi:10.1021/jf030199+
- Snedecor, G. W., & Cochran, W. G. (1989). Statistical methods (8th ed.). Amer Iowa: Affiliated East-West Press, Iowa State University Press.
- Sultana, K., Godward, G., Reynolds, N., Arumugaswamy, R., Peiris, P., & Kailasapathy, K. (2000). Encapsulation of probiotic bacteria with alginate–starch and evaluation of survival in simulated gastrointestinal conditions and in yoghurt. International Journal of Food Microbiology, 62, 47–55. doi:10.1016/S0168-1605(00)00380-9
- Tan, L. H., Chan, L. W., & Heng, P. W. S. (2009). Alginate/starch composites as wall material to achieve microencapsulation with high oil loading. Journal of Microencapsulation, 26(3), 263–271. doi:10.1080/02652040802305519
- Tripathi, B., & Platel, K. (2011). Iron fortification of finger millet (Eleucine coracana) flour with EDTA and folic acid as co-fortificants. Food Chemistry, 126, 537–542. doi:10.1016/j.foodchem.2010.11.039
- Woestyne, M. V., Bruyneel, B., Mergeay, M., & Verstraeta, W. (1991). The Fe chelator proferrorosamine A is essential for the siderophore-mediated uptake of iron by Psuedomonas roseus fluorescences. Applied and Environmental Microbiology, 57, 949–954.
- Xia, S., & Xu, S. (2005). Ferrous sulfate liposomes: Preparation, stability and application in fluid milk. Food Research International, 38, 289–296. doi:10.1016/j.foodres.2004.04.010