
Abstract
There are few papers considering the effect of oat fiber particle size in bread production. The response surface methodology (RSM) was used for optimizing the flour replacement (FR) and particle size (PS) with the oat fiber powder in the production of wheat bread rolls. Response variables are bread quality characteristics (yield, volume, moisture content, crumb and crust color, firmness, springiness, sensory attributes, and total dietary fiber (TDF) content). The results obtained in the study indicated that a lower size of dietary fiber resulted in increased yield and moisture content and decreased the volume. The color characteristics were slightly affected by FR and PS. The measured firmness increased when increasing FR and PS. The sensory analysis reveals that the most acceptable combination was the lowest FR with the highest PS. RSM was an efficient statistical tool to model the influence of FR and PS of the oat dietary fiber on wheat bread characteristics.
Existen pocos estudios que consideren el efecto del tamaño de las partículas de fibra de avena en la elaboración del pan. Se utilizó la metodología de superficie de respuesta para optimizar la sustitución de la harina (FR) y el tamaño de las partículas (PS) con fibra en polvo en la producción de panecitos de trigo. Las variables de respuesta fueron las características de calidad del pan (masa, volumen, contenido de humedad, color de las migas y de la corteza, firmeza, ligereza, atributos sensoriales y contenido total de fibra alimentaria). Los resultados obtenidos en este estudio indicaron que la fibra alimentaria de menor tamaño, cuando es añadida en productos horneados, resultaba en un aumento de la masa y del contenido de humedad mientras que disminuía el volumen. Las características del color se vieron ligeramente afectadas por la sustitución de la harina y el tamaño de las partículas. La firmeza aumentó a medida que se aumentaba la sustitución de la harina y el tamaño de las partículas. El análisis sensorial reveló que la combinación más aceptable fue con la menor sustitución de la harina y con el mayor tamaño de las partículas. La metodología de superficie de respuesta fue una herramienta estadística eficaz para demostrar la influencia de la sustitución de la harina y del tamaño de las partículas de la fibra alimentaria de avena en las características del pan de trigo.
Introduction
Contemporary modes of consumption are responsible for many diseases of affluence (diabetes, asthma, coronary heart disease, and obesity) (Melanson et al., Citation2006). On the other hand, the general consumption of bread products that should be naturally rich in dietary fibers has decreased in the societies with a higher gross domestic product (Quilez & Salas-Salvado, Citation2012). Dietary fiber (DF) is beneficial for the improvement of many essential physiological and metabolic functions, i.e., intestinal motility, binding of cholesterol, bile acids, and improvement of viability of the intestinal flora, as well as reducing the absorption of toxins, including heavy metals. Dietary fiber has become an increasingly popular raw material in many food categories (Melanson et al., Citation2006; Purhagen, Sjöö, & Eliasson, Citation2011; Staffolo, Bertola, Martino, & Bevilacqua, Citation2004). In fact, the intake of the TDF recommended by the World Health Organization (WHO) should be increased to an amount of 20‒40 g per day (Chizuru, Ricardo, Shiriki, & Prakash, Citation2004)). Therefore, the most advisable solution is to fortify white-bread products with dietary fiber that offers many technological and nutritional functions: caloric reduction, metabolizable-carbohydrate reduction, moisture control, anticaking properties, textural modification, and structural enhancement (Angioloni & Collar, Citation2011). Due to their health potential, oat fiber is higly recommended in the bread production among the fiber sources. Oat fiber is especially rich in the insoluble fractions (ca. 73%) – hemicelluloses, cellulose, lignin, and insoluble pectin. Since insoluble fibers have influence on bowel function, the gel forming soluble fibers are considered to reduce glycaemic response. On the other hand, it is also accepted that the insoluble dietary fibers may slow gastric emptying through their water binding capacity delaying the absorption of glucose (Borczak, Sikora, Sikora, Rosell, & Collar, Citation2012). Moreover, scientific authorities like FDA or EFSA pay great attention to the oat fiber functions issuing health claims connected with increasing fecal bulk (EFSA, Citation2010) or showing the connection between oat fiber consumption and lowering the risk of coronary heart disease (FDA, Citation2006). Thus, there is a need to scientifically develop the processes that could widen the range of products containing oat fiber.
The addition of large amounts of fiber to bread is associated with a change in its physical properties, such as increased crumb firmness, crumb darkening, or taste change (Gómez, Jiménez, Ruiz, & Oliete, Citation2011). Replacing flour with dietary fiber leads to disruption of the starch-gluten matrix and negatively influences the volume of bread. These negative effects can be reduced by using an appropriate proportion of soluble to insoluble fiber fractions (Collar, Santos, & Rosell, Citation2007; Rosell & Santos, Citation2010) and adding enzymes (Baiano & Terracone, Citation2011; Laurikainen, Härkönen, Autio, & Poutanen, Citation1998) or processing the fiber (Rosell, Santos, & Collar, Citation2009).
There are a few methods which could modify the properties of dietary fiber to be more suitable for bakery products. The methods are chemical, mechanical, thermal and enzymatic processing.. Some studies have been carried out to establish the negative effect of large wheat bran size on bread quality, owing to the hydration restriction and its integration in the gluten viscoelastic structure (Sanz Penella, Tamayo-Ramos, Sanz, & Haros, Citation2009). The particle size reduction leads to improvement of the functional properties of dietary fiber (Chen, Gao, Yang, & Gao, Citation2013). For example, particle size reduction of dietary fiber allows for an increase of water-holding capacity by increasing the degree of surface development. In the bread production process, this feature is extremely important, because water is involved in starch gelatinization, protein denaturation, and formation of both flavor and color related compounds. Moreover, water content slows down the retrogradation of starch in bread, preventing the bread from staling. (Rosell et al., Citation2009; Sabanis, Lebesi, & Tzia, Citation2009).
The response surface methodology (RSM) is an effective statistical technique appropriate for optimization of processes or formulations (Bas, Ismail, & Boyaci, Citation2007). Successful application of RSM in the development and optimization of different types of gluten-free bread has been reported (Marcoa & Rosell, Citation2008; McCarthy, Gallagher, Gormley, Schober, & Arendt, Citation2005). However, there are no data in the literature related to the use of dietary fiber with beta-glucan, its level of addition, and particle size on wheat-bread formulation.
To the best of our knowledge, there are few papers about the effect of different particle sizes of the oat fiber powder as a source of dietary fiber on bread production. This research was designed to examine the effects of various levels of flour replacement (FR) and particle size (PS) using the oat fiber powder. The RSM was used for optimizing the particle size and flour replacement with the oat fiber powder in the production of wheat bread rolls.
Materials and methods
Materials
Commercial Triticum aestivum wheat flour was provided by a local supplier and consisted of 14.02% moisture content, 10.16% proteins with 29.8% of wet gluten, and 0.52% ash. Proximate composition was measured using near-infrared spectroscopy (NIRFlex N-500, Buchi, Switzerland).
The oat fiber powder consisted of 80% dietary fiber (78% insoluble fractions; 2% soluble fractions) (Microfood Inc., Poland). The chemical composition of the dietary fiber was provided by the manufacturer and consisted of 8.5% of moisture, 4% protein, 3.2% available carbohydrates 2.5%, and 1.8% fat.
Methods
Design of experiments
The combinations of levels of flour replacement (FR) and particle size of dietary fiber (PS) were considered to be independent variables using a fractional design with two entry variables, one block and nine assays. The one additional center point was added to each block using Design Expert software version 9 (Stat-Ease, Inc., USA) which conducted the experiments to 10 assays (). The ranges of the FR were 5–20% and of the PS were 40–150 µm.
Oat fiber production and particle size distribution
There were three particle sizes used in the study: 150, 95, and 40 µm. The 150 and 95 µm samples were supplied by the manufacturer, and the 40 µm samples were manufactured in the laboratory using a rotor mill (Retsch ZM 200, Retsch, Germany) with a 0.5 mm screen.
Fiber particle size distribution (PSD) was determined using a Morphologi G3SE (Malvern Instrument Ltd, Malvern, England) equipped with a sample dispersion unit for dry samples. Size distribution was calculated with respect to the relative volume of particles in size bands, presented as size distribution curves (Malvern Micro software v 5.40). PSD parameters included the largest particle size (D90), mean particle volume (D50), smallest particle size (D10), Sauter mean diameter (D [3, 2], in µm), and mean particle diameter (D[4, 3], in µm). The results obtained from measurements of the oat fiber are presented in .
Table 1. The results obtained from particle size measurements of the oat fiber.
Tabla 1. Los resultados de las mediciones del tamaño de las partículas de la fibra de avena.
Table 2. The central composite design arrangement and responses of wheat bread rolls with different flour replacement (FR) and particle size (PS) of the oat fiber.
Tabla 2. Diseño central del compuesto y respuestas de los panecitos de trigo con diferentes sustituciones de la harina (HS) y tamaño de las partículas (PS) de fibra de avena.
Bread roll preparation
The formulation used in the study was calculated for 100 g of flour-DF mixture: 6 g of compressed yeasts, 2 g salt, 1 g sugar, and 1 g vegetable oil. The amount of water was determined in the preliminary set of experiments to reach 500 BU (Brabender Units) due to increased dietary fiber water absorption (Pourfarzad, Mahdavian-Mehr, & Sedaghat, Citation2013).
All constituents apart from oil were mixed using a spiral mixer (TRQ – 42, RM Gastro, Poland) at 200 rpm for 4 min, and, after adding oil, mixing was continued for the next 6 min and rested for 30 min. The dough then was divided and formed into 60 g rolls. The proofing time was 75 min for each roll (35°C, 80% RH). The rolls were baked at 180°C for 14 min in a convection oven (CPE 110, Kuppersbuch, Germany). The rolls were allowed to cool to room temperature before serving. After cooling, the rolls were placed into plastic bags and stored for 24 h at 20°C.
Physical measurements
Yield
The measurements carried out on the fresh product included process performance based on the mass measurement, volume, color, and texture profile measurement. The mass measurement was conducted before fermentation, immediately after baking, and 2 hours after cooling. The yield was calculated as the mass of final product after cooling for every 100 g of the flour–DF powder.
Volume and moisture loss determination
The volume of baked bread rolls was determined using the rapeseed displacement method (American Association of Cereal Chemists (AACC) method 10–05.01 (AACC, Citation2000)). The oven drying method was used to determine the moisture content (AACC method 44–15.02 (AACC, Citation2000)) 24 h after baking.
Color measurement
Color determination was carried out on bread crumbs using a Minolta CR-400 colorimeter (Konica Minolta Inc., Japan), using CIE standard illuminant D65, a measurement area of ø = 8 mm, and a 2° standard observer. The results were expressed in accordance with the Commission internationale de l’éclairage Lab color space. Parameters for color determination were L* (L* = 0 [black] and L* = 100 [white]), a* (–a* = greenness and +a* = redness), b* (–b* = blueness and +b* = yellowness), and ΔE (total color difference). These parameters were measured 24 h after baking was completed. Data were obtained by using the colorimeter 10 times on the crumb of three different rolls.
Texture parameters
Mechanical characteristics of bread in a double compression cycle were recorded using an Instron 5965 Universal Testing Machine (Instron, USA). The maximum load was 500 N with a 50% penetration depth obtained using a 40 mm diameter probe, and a 20 second gap between compressions on crumb cubes with dimensions of 20 × 20 × 20 mm with a speed of 20 cm min−1. The measured parameters included firmness 12 h after baking was completed. The results were given as the maximum level of firmness (N) and springiness (–).
Sensory evaluation
Bread quality evaluation was performed by organoleptic assessment tests, using a hedonic scoring system ranging from 1 (the lowest rating) to 9 (the highest rating). Thirty panelists were selected among post-graduate students and teachers at the Division of Engineering in Nutrition. All the members of the panel were bread consumers, familiar and experienced with the hedonic scale test system. The samples of bread rolls were served on white plastic plates by using diluted apple juice as a palate cleaner between samples. They rated a variety of sensory attributes, such as crumb color, crust color, flavor, softness, porosity, and overall quality.
Chemistry
The TDF in baked bread was measured according to the AACC 32–45.01 method using the FOSS Fibretec E 1023 system (FOSS Inc., Eden Prairie, MN, USA) (AACC, Citation2000).
Statistics
The responses obtained for the assays were subjected to the central composite rotational design (CCRD), which was used to study the effects of the independent variables – FR and PS. These were analyzed using the Design Expert software version 9 (Stat-Ease, Inc., USA). The response, or dependent, variables were the bread quality characteristics (yield, volume, moisture content, crumb and crust color, firmness, springiness, TDF content, and sensory attributes).
The significant terms in this model were found by the analysis of variance (ANOVA) for each response, the lack of fit, coefficients of determination (R2), and coefficients of variation (CV), which were calculated to check the model accuracy.
The 3-D surface plots were generated through Design Expert software version 9 (Stat-Ease, Inc., USA)
Besides explaining the behavior of variables by means of surface plots, the models fitted in this study can also be utilized for optimization purposes using the desirability function. This process consists of converting each response variable into a desirability function di from 0 to 1. It is necessary to find the factor levels that correlate with a maximum response variable value, so the di = 1 for high values and di = 0 for low values of response variable should be set. The yield, volume, L*, TDF, and overall quality were specified as “maximally desirable,” while the firmness as a sensory attribute was specified as “minimally desirable”. The desirability function acts as a penalty function that leads the algorithm to areas where we can find the desired response variable values. The factor levels that correlate with a maximum or minimum response variable are called “optimum points” (Pourfarzad et al., Citation2013).
After the optimization was carried out and the optimized bread was produced, the selected parameters were measured as they were with the other samples. The predicted and experimental values were compared adding the control sample (wheat bread roll without DF addition) and analyzed using a one-way analysis of variance (ANOVA) by Statistica version 9 (StatSoft, Inc., USA). The mechanically measured properties were correlated with the sensory parameters with Pearson’s correlation. The significant level for ANOVA and correlations was reported for p ≤ 0.05.
Results and discussion
Particle size distribution of the oat fiber
presents the results from static automated image analysis of the oat fiber powder used for the wheat roll production. The particle size of dietary fibers suggests that fibers were not homogenous as a whole, because of a wide range of particles. These ranges are not problematic for research purposes, as the fibers offered by manufacturers are not standardized in detail in terms of particle size, so using real dietary fibers is more applicable.
Adequacy of the model
The combined effects of FR and PS on yield, volume, moisture content, L*a*b* parameters, firmness, springiness, crumb color, crust color, flavor, sensory firmness, porosity, overall quality, and TDF of the wheat bread rolls are shown in . The independent and dependent variables were fitted to the polynomial response surface model and tested for lack of fit on a regression model. The analysis of variance on the effects of FR and PS as linear, quadratic, and interaction terms on the response variables are presented in . The statistical analysis indicated that the models were adequate because of the satisfactory levels of R2. The results showed that lack-of-fit tests were significant for L*, springiness, crust color, and porosity. Box and Draper (Citation1987) indicated that the lack of fit can be attributed to the fact that all appropriate functions of independent variables were not included. However, if there were sufficient data, the models with significance could still be used.
Table 3. Regression coefficients of predicted quadratic polynomial models for physical, sensory, and TDF values in wheat bread rolls.
Tabla 3. Coeficientes de regresión de los modelos polinominales cuadráticos previstos para los valores físicos, sensoriales y TDF en los panecitos de trigo.
Effect of the level of flour replacement and particle size on yield, mass, and moisture content of wheat rolls
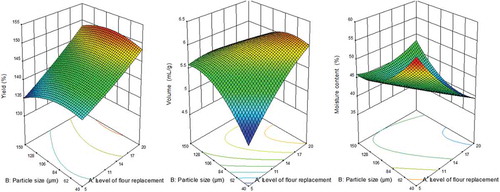
ANOVA shows that the selected quadratic models are well adjusted to the experimental data. R2 values were in the satisfactory range (0.76‒0.95), indicating that the model could explain the effects of independent variables on physical properties of wheat rolls. As shown in , there is significant linear relevance of FR on product yield and no significant effect was observed for PS. Increasing FR had a positive impact on the production yield. Therefore, the presence of DF is more vital for yield than is its form – in this case particle size in the range of particle size distribution. The yield of bread production is mainly affected by the water content retained during the baking process. The high level of water absorption of DF leads to more significant retention during baking, so the yield values are higher in the samples with a higher amount of DF (Bchir, Rabetafika, Paquot, & Blecker, Citation2014).
The model analysis showed that there is a quadratic significance of PS on product volume (). Increasing the particle size of DF positively affects the volume of the final product. Smaller particles of DF are incorporated more precisely into the food matrix and disturbed the viscoelastic network, which could leave a gluten network unable to hold the gas released during fermentation and to maintain the bread volume. There was also significant interaction between PS and FR, wherefore the reduced loaf volume was also a consequence of gluten dilution, and likely due to physical interactions and chemical reactions among fiber components, water, and gluten (Anil, Citation2007).
The moisture content was relevant to FR in the interaction between FR and PS (). Such a situation can occur because FR is more relevant to moisture content than is PS alone. Moisture content is strongly correlated with water uptake while mixing the dough (Ho, Abdul Aziz, Bhat, & Azahari, Citation2014). Dough with more water-binding substances (like fibers) can take up more water, and the water can bond during the storage. shows that the values for moisture content are the highest in cases when both lowest FR and PS are used, which means that the most negative effect of FR and PS was seen in the center points.
Figure 1. The surface plots of yield, volume, moisture content as affected by the particle size, and the level of flour replacement.
Figura 1. Gráficos de superficie de la masa, el volumen y el contenido de humedad afectados por el tamaño de las partículas y el nivel de sustitución de la harina.
Effect of the level of flour replacement and particle size on color of wheat rolls
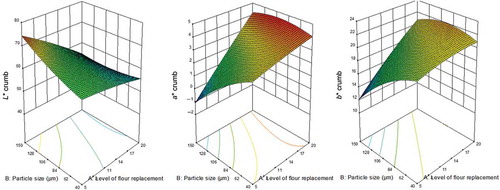
The color attributes of the crumbs were examined (). The L* parameter was assessed as linearly relevant to FR and PS. The color of bakery products with added dietary fiber changes because of changes in the caramelization process and the Maillard reaction, but this is true only for products that are exposed directly to high temperatures. In the case of bread crumbs, such high temperatures are not achieved, therefore it is reasonable to perform measurements only for crumbs with color that correlates with ingredients used for dough production (Gómez et al., Citation2011). The results obtained in this study indicate that a lower size of dietary fiber, when added to bakery products, results in an increase in the L* parameter value. However, it is worth indicating that reduced lightness of bakery products may be a result of increasing water activity. It was stated that the rate of Maillard reactions, which are mainly responsible for creating the color of bread products, is increased as the water activity is decreased (Park, Seib, & Chung, Citation1997).
The values of a* related linearly to FR and PS, to interaction of FR and PS, and quadratically in PS. It can be seen in that a* values were affected negatively by increasing particle size. The b* values related to FR and PS, and to interaction between FR and PS, as well as quadratically in PS. b* values were observed to be negatively affected by the increasing particle size. This finding is contrary observation to those of previous authors, where b* decreases with a decrease in particle size (Pourfarzad et al., Citation2013).
Figure 2. The surface plots of L*, a*, and b* as affected by the particle size and level of flour replacement.
Figura 2. Gráficos de superficie de L*, a*, b* afectados por el tamaño de las partículas y el nivel de sustitución de la harina.
Effect of the level of flour replacement and particle size on firmness and springiness of wheat bread rolls
The firmness of the crumbs was linearly related to FR (). The firmness, as shown in , increased due to the FR more so than to the PS. The staling process is one of the most important processes occurring in bakery products under storage, and it has significant effects on parameters perceived by consumers, such as aroma or firmness. Staling can be expressed as increased firmness of bakery products with time. Retrogradation of amylose and amylopectin is a process leading to staling of bakery products. For this reason, more and more interest has been paid to producing complex compounds with amylopectin and amylose in order to inhibit retrogradation (e.g., with substances belonging to a dietary fiber group) (Elleuch et al., Citation2011).
Figure 3. The surface plots of firmness and springiness as affected by the particle size and level of flour replacement.
Figura 3. Gráficos de superficie de la firmeza y la ligereza afectadas por el tamaño de las partículas y el nivel de sustitución de la harina.
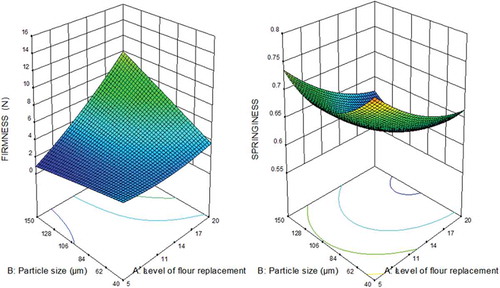
When the product is heated and water is added, hydrocolloids with strong bonds are formed, and these bonds cannot be broken by enzymes in flour due to a low amount of β-glucanase (Wang, Miller, & Hoseney, Citation1998). Minor changes in the firmness value were observed for fiber with larger particles, and there were fewer discrepancies compared to fiber with particles that were larger than those of the control sample. Due to its water-binding capacities, fiber inhibits water loss during storage, so it prevents the staling that affects crumb firmness by its increase (Gómez et al., Citation2011). Moreover, the study by Sabanis et al. (Citation2009) indicated that the addition of the oat fiber to dough results in increased firmness of the final product. The springiness was significantly affected by the linear and quadratic terms of FR and PS, showing a tendency for increasing PS to have a negative impact on the springiness of the wheat bread rolls.
The effect of flour replacement and particle size on sensorial attributes of wheat bread rolls
The sensorial scores were assessed in the research (). The obtained values made it possible to establish mathematical models for the responses as a function of FR and PS (). The color of crumbs was affected linearly by FR and in the quadratic terms by PS showing that the color acceptance of consumers was decreasing with incorporation of lower PS and higher FR values. The flavor and firmness were affected by the iteration term of FR and PS decreasing while incorporating lower PS and higher FR values. The porosity was not significant in any terms. The quality was significantly affected by linear FR, interaction FR and PS, and quadratic PS. The most desired color was observed in the samples with the lowest values of FR. It was very difficult to examine statistically the desirability of flour, but it was observed that the highest PS and the lowest FR resulted in the highest acceptance in terms of flavor. The same situation occurred in terms of the overall quality.
The correlation of texture and color values measured mechanically and those obtained using a panel were established. It could be observed that the values of firmness were negatively correlated because the most appreciable firmness by panelists were the lowest values from texture analysis (r = −0.94). The color values were not correlated significantly due to the disproportion of measured or assessed parameters. The L*a*b* analysis is a complex system of three parameters and the consumers were only asked to show the acceptance of crumb and crust color.
Effect of the level of flour replacement and particle size on the TDF content of wheat rolls
The TDF was significantly affected by the PS in the quadratic terms (). An interesting tendency is the fact that bakery products with smaller PS include more fiber. It is associated with the fact that smaller particles of fiber have more surface area, and consequently their water-binding capacity is higher. Water is released faster during baking and storage, so that a lower mass is obtained, and there is a relative increase in the fiber content (Noort, van Haaster, Hemery, Schols, & Hamer, Citation2010).
The optimization of flour replacement and particle size
The optimization of FR and PS was done using multiple response optimization. The final result of this optimization suggested that the FR should be 7.704% and the PS should be 125.97 µm. These results were compared to those for the control sample, which was a wheat bread roll without the addition of dietary fiber. The conditions obtained from the model were sufficient to produce the wheat bread roll, and were not statistically different in the measured variables from those predicted. The RSM is a satisfactory tool for producing a roll that is similar to the control wheat bread roll without DF addition, but with significantly higher TDF content (). The measured TDF content of optimized wheat rolls showed that the final product could be provided with the health statement that the product is high in fiber while it contains at least 6 g of fiber per 100 g, which should cause the product to be considered beneficial to human health (EFSA, Citation2010).
Table 4. Comparison of selected parameters of optimized bread using predicted, experimental, and control values for optimized FR and PS of wheat bread rolls. The control value was a wheat bread roll without the addition of the dietary fiber.
Tabla 4. Comparación de los parámetros seleccionados del pan optimizado utilizando los valores previstos, experimentales y de control para FR y PS optimizadas de panecitos de trigo. El valor de control fue un panecito de trigo sin la adición de fibra alimentaria.
Conclusion
There are few scientific reports focusing on the use of the oat fiber as an additive to bakery products. However, none of them takes into consideration conducting research combining flour replacement and particle size of DF using one of the most health beneficial types of DF, oat fiber. Through this study, it was possible to verify that depending on FR and PS, various responses could be obtained for the traits of bread. Knowing this, the oat fiber could be used by the researchers and food technologists to obtain desired properties. RSM was an efficient statistical tool to model the influence of FR and PS using the oat dietary fiber on wheat bread roll characteristics. Based on these models, the optimum levels of FR and PS were obtained. The effectiveness of the formula was tested, yielding satisfactory results.
Disclosure statement
No potential conflict of interest was reported by the authors.
Acknowledgements
The authors would like to give special recognition to Cristina M. Rosell of Food Science Department, Institute of Agrochemistry and Food Technology (IATA-CSIC), Spain, for the substantial assistance in the improvement of the quality of this paper.
Additional information
Funding
References
- American Association of Cereal Chemists. (2000). Methods 10-05.01; 44-15.02; 32-45.01, AACC methods. Approved methods of the American Association of Cereal Chemists (10th ed.). St Paul, MN: AACC International.
- Angioloni, A., & Collar, C. (2011). Physicochemical and nutritional properties of reduced-caloric density high-fibre breads. LWT – Food Science and Technology, 44(3), 747–758. doi:10.1016/j.lwt.2010.09.008
- Anil, M. (2007). Using of hazelnut testa as a source of dietary fiber in breadmaking. Journal of Food Engineering, 80(1), 61–67. doi:10.1016/j.jfoodeng.2006.05.003
- Baiano, A., & Terracone, C. (2011). Dough rheology and bread quality of supplemented flours. CyTA – Journal of Food, 9(3), 180–186. doi:10.1080/19476337.2010.504885
- Bas, D., Ismail, H., & Boyaci, J. (2007). Modeling and optimization. Usability of response surface methodology. Journal of Food Engineering, 78(3), 836–845. doi:10.1016/j.jfoodeng.2005.11.024
- Bchir, B., Rabetafika, H. N., Paquot, M., & Blecker, C. (2014). Effect of pear, apple and date fibres from cooked fruit by-products on dough performance and bread quality. Food and Bioprocess Technology, 7(4), 1114–1127. doi:10.1007/s11947-013-1148-y
- Borczak, B., Sikora, E., Sikora, M., Rosell, C. M., & Collar, C. (2012). Glycaemic response to frozen stored wheat rolls enriched with inulin and oat fibre. Journal of Cereal Science, 56(3), 576–580. doi:10.1016/j.jcs.2012.07.008
- Box, G. E. P., & Draper, N. R. (1987). Empirical model building and response surfaces. New York, NY: John Wiley & Sons.
- Chen, J., Gao, D., Yang, L., & Gao, Y. (2013). Effect of microfluidization process on the functional properties of insoluble dietary fiber. Food Research International, 54(2), 1821–1827. doi:10.1016/j.foodres.2013.09.025
- Chizuru, N., Ricardo, U., Shiriki, K., & Prakash, S. (2004). The joint WHO/FAO expert consultation on diet, nutrition and the prevention of chronic diseases: Process, product and policy implications. Public Health Nutrition, 7, 245–250. doi:10.1079/PHN2003592
- Collar, C., Santos, E., & Rosell, C. M. (2007). Assessment of the rheological profile of fibre-enriched bread doughs by response surface methodology. Journal of Food Engineering, 78(3), 820–826. doi:10.1016/j.jfoodeng.2005.11.026
- EFSA. (2010). Scientific opinion on the substantiation of a health claim related to oat beta-glucan and lowering blood cholesterol and reduced risk of (coronary) heart disease pursuant to article 14 of regulation (EC). EFSA Journal, 8(1924), 1–15. doi:10.2903/j.efsa.2010.1885
- Elleuch, M., Bedigian, D., Roiseux, O., Besbes, S., Blecker, C., & Attia, H. (2011). Dietary fibre and fibre-rich by-products of food processing: Characterisation, technological functionality and commercial applications: A review. Food Chemistry, 124(2), 411–421. doi:10.1016/j.foodchem.2010.06.077
- FDA. (2006, January 27). FDA – Food and drug administration. Office of nutritional products, labeling and dietary supplements (hfs-800). 5100 paint branch parkway. Petition for health claim: Barley beta fiber and coronary heart disease, College Park, MD.
- Gómez, M., Jiménez, S., Ruiz, E., & Oliete, B. (2011). Effect of extruded wheat bran on dough rheology and bread quality. LWT – Food Science and Technology, 44(10), 2231–2237. doi:10.1016/j.lwt.2011.06.006
- Ho, L. H., Abdul Aziz, N. A., Bhat, R., & Azahari, B. (2014). Storage studies of bread prepared by incorporation of the banana pseudo-stem flour and the composite breads containing hydrocolloids. CyTA – Journal of Food, 12(2), 141–149. doi:10.1080/19476337.2013.806597
- Laurikainen, T., Härkönen, H., Autio, K., & Poutanen, K. (1998). Effects of enzymes in fibre-enriched baking. Journal of the Science of Food and Agriculture, 76(2), 239–249. doi:10.1002/(SICI)1097-0010(199802)76:2<239::AID-JSFA942>3.0.CO;2-L
- Marcoa, C., & Rosell, C. M. (2008). Effect of different protein isolates and transglutaminase on rice flour properties. Journal of Food Engineering, 84(1), 132–139. doi:10.1016/j.jfoodeng.2007.05.003
- McCarthy, D. F., Gallagher, E., Gormley, T. R., Schober, T. J., & Arendt, E. K. (2005). Application of response surface methodology in the development of gluten-free bread. Cereal Chemistry Journal, 82(5), 609–615. doi:10.1094/CC-82-0609
- Melanson, K. J., Angelopoulos, T. J., Nguyen, V. T., Martini, M., Zukley, L., Lowndes, J., & Rippe, J. M. (2006). Consumption of whole-grain cereals during weight loss: Effects on dietary quality, dietary fiber, magnesium, vitamin B-6, and obesity. Journal of the American Dietetic Association, 106(9), 1380–1388. doi:10.1016/j.jada.2006.06.003
- Noort, M. W. J., van Haaster, D., Hemery, Y., Schols, H. A., & Hamer, R. J. (2010). The effect of particle size of wheat bran fractions on bread quality ‒ Evidence for fibre–protein interactions. Journal of Cereal Science, 52(1), 59–64. doi:10.1016/j.jcs.2010.03.003
- Park, H., Seib, P. A., & Chung, O. K. (1997). Fortifying bread with a mixture of wheat fiber and psyllium husk fiber plus three antioxidants. Cereal Chemistry, 74(3), 207–211. doi:10.1094/CCHEM.1997.74.3.207
- Pourfarzad, A., Mahdavian-Mehr, H., & Sedaghat, N. (2013). Coffee silverskin as a source of dietary fiber in bread-making: Optimization of chemical treatment using response surface methodology. LWT – Food Science and Technology, 50(2), 599–606. doi:10.1016/j.lwt.2012.08.001
- Purhagen, J. K., Sjöö, M. E., & Eliasson, A.-C. (2011). The use of normal and heat-treated barley flour and waxy barley starch as anti-staling agents in laboratory and industrial baking processes. Journal of Food Engineering, 104(3), 414–421. doi:10.1016/j.jfoodeng.2011.01.004
- Quilez, J., & Salas-Salvado, J. (2012). Salt in bread in Europe: Potential benefits of reduction. Nutrition Reviews, 70(11), 666–678. doi:10.1111/j.1753-4887.2012.00540.x
- Rosell, C. M., & Santos, E. (2010). Impact of fibers on physical characteristics of fresh and staled bake off bread. Journal of Food Engineering, 98(2), 273–281. doi:10.1016/j.jfoodeng.2010.01.008
- Rosell, C. M., Santos, E., & Collar, C. (2009). Physico-chemical properties of dietary fibers from different sources: A comparative approach. Food Research International, 42(1), 176–184. doi:10.1016/j.foodres.2008.10.003
- Sabanis, D., Lebesi, D., & Tzia, C. (2009). Effect of dietary fibre enrichment on selected properties of gluten-free bread. LWT – Food Science and Technology, 42(8), 1380–1389. doi:10.1016/j.lwt.2009.03.010
- Sanz Penella, J. M., Tamayo-Ramos, J. A., Sanz, Y., & Haros, M. (2009). Phytate reduction in bran-enriched bread by phytase-producing bifidobacteria. Journal of Agricultural and Food Chemistry, 57(21), 10239–10244. doi:10.1021/jf9023678
- Staffolo, M. D., Bertola, N., Martino, M., & Bevilacqua, A. (2004). Influence of dietary fiber addition on sensory and rheological properties of yogurt. International Dairy Journal, 14(3), 263–268. doi:10.1016/j.idairyj.2003.08.004
- Wang, L., Miller, R. A., & Hoseney, R. C. (1998). Effects of (1→3)(1→4)-β-d-glucans of wheat flour on breadmaking. Cereal Chemistry, 75(5), 629–633. doi:10.1094/CCHEM.1998.75.5.629