
ABSTRACT
Fenugreek (Trigonella foenum-graecum L.) seed was used for the recovery of phenolic compounds by employing different process modifications of ultrasonic-assisted extraction (UAE). It was observed that a 3-day germination (35°C) process negatively affected the phenolic contents of seed. Preliminary studies found that maximum quantities of phenolic compounds obtained from germinated and un-germinated seed were 5.882 and 7.534 mg GAE/g when extraction was carried out at 35°C for 30 min using ethanol (30%) as solvent. Un-germinated seed was used for further studies. In order to improve total phenolic compound recovery, Box–Behnken experimental design, regression analysis and response surface methodology were applied following the initial studies. The optimum UAE conditions were established as 38°C temperature, 32 min time and 33% ethanol for the maximum total phenolics (8.41 mg GAE/g DW). Fenugreek seed extract also showed a good radical scavenging activity (62.74 ± 1.66%).
RESUMEN
Se utilizó semilla de fenogreco (Trigonella foenum-graecum L.) para la recuperación de compuestos fenólicos mediante la utilización de modificaciones de diferentes procesos de extracción asistida por ultrasonido (UAE). Se observó que el proceso de germinación de tres días (35°C) afectó negativamente a los contenidos fenólicos de la semilla. Estudios preliminares determinaron que las cantidades máximas obtenidas de compuestos fenólicos en semillas germinadas y sin germinar fueron 5,882 y 7,534 mg GAE/g con una extracción realizada a 35°C durante 30 min utilizando etanol (30%) como solvente. Se utilizó la semilla sin germinar para otros estudios. Para mejorar la recuperación del compuesto total de fenoles, se aplicaron las metodologías de diseño experimental Box–Behnken, análisis de regresión y superficie de respuesta siguiendo los estudios iniciales. Las condiciones UAE óptimas se establecieron a una temperatura de 38°C, un tiempo de 32 minutos y 33% de etanol para el máximo de total de fenoles (8,41 mg GAE/g DW). El extracto de semilla de fenogreco también mostró una buena actividad de barrido de radicales (62,74 ± 1,66%).
1. Introduction
It is a well-established fact that many traditional plant-based foods are effective and safe sources of natural remedies for different health problems (Zheng, Hwang, Kim, Kim, & Chung, Citation2014). Fenugreek (Trigonella foenum-graecum L.) is a herbal plant, traditionally being used to treat different diseases such as diabetes (Kenny, Smyth, Hewage, & Brunton, Citation2013). Studies report the presence of substantial amounts of phenolic compounds in fenugreek seed and different quantification studies for individual compounds have been carried out to identify such compounds. These compounds were also linked with the health-promoting potential of fenugreek (Chatterjee, Variyar, & Sharma, Citation2009; Shang et al., Citation1998). Dixit et al. (Citation2005) studied the occurrence of different flavonoids and phenolic compounds and they related the antioxidant activity of germinated fenugreek seeds (GFS) with the presence of such bioactive compounds. It has been previously reported that germination of plant seed can improve the presence of essential amino acids, improve protein digestibility and decrease the level of total lipids and triglycerides (Dixit et al., Citation2005); however, its effect on phenolic compounds is still not clear. Hence, more studies are required to explore the nutraceutical potential of different parts of fenugreek plant by employing innovative methodologies aimed at optimizing the recovery of different bioactive compounds.
The extraction of polyphenols from plant materials is important for their maximum recovery and use. Different process parameters can affect this process which may include plant matrix, the particle size, method of extraction, process time and temperature in addition to the selection of a suitable solvent and its concentration (Ghafoor, AL-Juhaimi, & Choi, Citation2012; Ghafoor, Hui, & Choi, Citation2011). Ultrasound-assisted extraction (UAE) is an innovative approach in which the efficiency of an extraction process can be enhanced due to sonication waves which trigger production of cavitation and improve the solubility strength of the extraction medium or solvent such as ethanol (Ghafoor, Choi, Jeon, & Jo, Citation2009; Ghafoor et al., Citation2011). Furthermore, it has been observed that the use of UAE can improve recovery of phenolic compounds from plant materials (Ghafoor & Choi, Citation2009). The optimization of an extraction process for bioactives’ recovery from plant matrix is an important area of research and different techniques such as designed experiments, regression analysis and response surface methodologies are often adopted in such studies (Petridis, Zotos, Kampouris, & Roumelioti, Citation2012; Teng & Choi, Citation2012). As discussed earlier, fenugreek seed is a potential source of health-benefiting phenolic compounds, hence it is worthwhile to study an extraction process with reference to optimizing their yields.
The objectives of carrying out this study were to evaluate GFS and un-germinated fenugreek seeds (UFS) for the recovery of phenolic compounds along with studying the effects of different process variables such as time, temperature and solvent concentration during UAE process. A designed experiment was utilized to optimize extraction conditions using regression analysis and response surface methodology (RSM) for maximizing the yield of phenolic compounds from fenugreek seeds. The free radical scavenging property of extracts was also studied.
2. Materials and methods
2.1. Materials
The fenugreek seeds used were purchased from a local market in Riyadh, Saudi Arabia. The seeds were cleaned and stored in refrigerator at 4°C. All the chemicals used were of analytical grade and procured from Sigma-Aldrich, St Louis, MO, USA. The cleaned fenugreek seeds were divided into two portions. The first portion was germinated by placing in an oven at 35°C and moistened at every 6 h for 3 days. The GFS were then stored in a refrigerator at 4°C before use. The UFS and GFS were dried in a conventional oven (FX14, Shell Lab, Sheldon Manufacturing, Cornelius, OR, USA) for 3 days at 50°C. After drying (moisture contents 3.5% w/w), the sample was ground to a powder form using a blender (PBB2 Waring, Conair Corporation, East Windsor, NJ, USA) and passed through a 1-mm sieve. The milled samples were then stored in polyethylene bags at room temperature for further use.
2.2. Ultrasound-assisted extraction from fenugreek seeds
Approximately 1 g of dried GFS and UFS samples were weighed and extracted with 30 mL of the extracting solution (ethanol) in a conical flask. Conical flask was covered with parafilm and aluminum foil to prevent light exposure. It was then placed in ultrasound bath (CPX2800H-E, Branson, USA) and sonicated for different times at set temperature. The sonication frequency and power were fixed at 40 kHz and 110 W, respectively, according to previous studies (Ghafoor et al., Citation2009). The temperature and time of ultrasonic-assisted extraction (UAE) were controlled from the panel. Once extraction completed, the extract was cooled to around 15°C using cold water and centrifuged (RC5C, Sorvall Instruments, Hertfordshire, UK) at 4500×g for 15 min. The supernatant was collected in a volumetric flask and was subsequently used for the determination of total phenolic contents. The initial trials carried out using a normal water bath (without sonication) showed significantly lower recoveries of phenolics from fenugreek seed (data not shown) in comparison to UAE. The percentage yield of the extract was obtained as 100 × DWextract/DWsample, where DWextract is the weight of dried extract, and DWsample is the dry weight of fenugreek seed powder.
2.3. Experimental design
The experimental design for this study was divided into two major parts. First, single-factor experiments were performed to determine the appropriate ranges of extraction conditions for the recovery of phenolic compounds from GFS and UFS. Ethanol concentration, extraction time and extraction temperature were varied individually by keeping the other two as constant. It involved ethanol concentrations of 20, 30, 50, 70 and 90% (v/v) at fixed extraction temperature of 25°C and extraction time of 30 min. Then, the effects of extraction temperature were evaluated from 25°C to 55°C at a fixed ethanol concentration of 20% (v/v) and extraction time of 30 min. Extraction time was changed from 10 to 40 min at a fixed ethanol concentration of 20% (v/v) and extraction temperature of 35°C. The best ethanol concentration, extraction temperature and extraction time were selected according to the quantity of total phenolic compounds.
The second part of this study was aimed at optimization UAE of phenolic compounds using regression analysis and RSM. Based on the results of single-factor experiments, the UFS showed higher phenolic contents as compared to GFS; therefore, UFS samples were used for further experiments. The optimization experiments involving three independent variables, i.e. ethanol concentration (20–40%), extraction temperature (30–50°C) and extraction time (20–40 min) and total phenolics being the dependent variable, were based on a three-factor Box–Behnken experimental design. The experimental factors and their levels are shown in and the complete design consisting of 17 experimental runs is shown in . The data obtained from triplicate measurements of total phenolics were analyzed using regression methods followed by response surface analysis of the experimental data in order to calculate optimum conditions. The prediction for optimum levels of variables was based on following equation:
Table 1. Factors and levels of response surface analysis.
Tabla 1. Factores y niveles del análisis de superficie de respuesta.
Table 2. Box–Behnken experimental design of process variables for the optimization of ultrasound-assisted extraction of phenolic compounds from fenugreek seed.
Tabla 2. Diseño experimental Box–Behnken de las variables del proceso para la optimización de la extracción asistida por ultrasonido de compuestos fenólicos de la semilla de fenogreco.
where Y is the predicted response, i.e. total phenolics from UFS, and β0 is a constant. β1, β2 and β3 are the linear regression coefficients ; β11, β22 and β33 are quadratic terms and β12, β13 and β23 are the interaction terms. X1, X2 and X3 are the independent variables, i.e. extraction time, concentration of ethanol and temperature, respectively.
2.4. Determination of total phenolic content
The total phenolic compounds were analyzed using the Folin–Ciocalteu method with some modifications (Singleton & Rossi, Citation1965). A 200 μL of the extract was mixed with 400 μL of Folin–Ciocalteu reagent. Ethanol was used for control experiment. The solution was diluted to a total volume of 4.6 mL using deionized water and then thoroughly mixed. After incubation for 10 min at room temperature, 1 mL of 20% Na2CO3 solution was added, then immediately mixed, and incubated for 2 h. The absorbance was read at 765 nm on a spectrophotometer (PD-303UV, Apel, Saitama, Japan). Gallic acid of 1 mg/mL was used as the standard, and total phenolic contents of the samples were expressed in milligram gallic acid equivalent per gram of the dry weight (mg GAE/g dry weight, DW). All the measurements were carried out in triplicate, and the data reported were means ± SD.
2.5. Determination of radical scavenging activity
The radical scavenging activity of phenolic-rich fenugreek seed extract was determined using 1,1-diphenyl-2-picrylhydrazyl or DPPH assay (Ghafoor et al., Citation2012). The extract sample (1 mL) was mixed with 2 mL of DPPH radicals’ solution (prepared by dissolving 1 mg DPPH in 100 mL of methanol). After thorough mixing and 5 min incubation at room temperature, the absorbance values (Δ517 nm) were obtained. The control consisted of 1 mL of distilled water in 2 mL of DPPH solution and the free radical scavenging activities (RSA) were calculated using Equation (2):
2.6. Statistical analysis
All experiments and analytical measurements were carried out in triplicates. The experimental results in single-factor experiments were analyzed using SAS (v 9.1, SAS Institute, Cary, NC, USA). All data were expressed as means ± standard deviations of triplicate measurements. One way analysis of variance (ANOVA) was used to determine the significant differences (p < 0.05) between the means. Means were also compared for estimating differences using Duncan’s multiple range test. The Design Expert (Version 8.0, Stat Ease Inc., Minneapolis, USA) statistical software was employed for the Box–Behnken design and to analyze the experimental data using RSM. Three-dimensional response surface graphs were constructed using SAS.
3. Results and discussion
3.1. Extraction of phenolic compounds from germinated and un-germinated fenugreek seeds
A series of experiments were conducted to study the effects of ultrasonic-assisted extraction (UAE) of phenolic compounds from two types of fenugreek seeds, i.e. germinated and un-germinated ones. The concentration of ethanol was varied from 20–90% by keeping other variables as constant. The quantities of phenolic compounds recovered from GFS and UFS are shown in . It was observed that the optimal recoveries of total phenolic compounds from both GFS and UFS (6.515 and 5.214 mg GAE/g, respectively) were achieved when ethanol concentration was 30%.
Figure 1. Effects of ethanol concentration (A), extraction temperature (B) and extraction time (C) on the yield of phenolic compounds from germinated (GFS) and un-germinated fenugreek seed (UFS).
Figura 1. Efectos de la concentración de etanol (A), la temperatura de extracción (B) y el tiempo de extracción (C) en el rendimiento de los compuestos fenólicos de semilla de fenogreco germinada (GFS) y sin germinar (UFS).
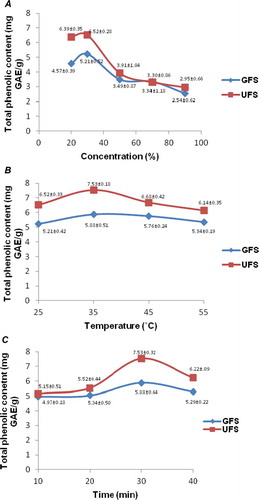
The effects of extraction temperature (25–55°C) were studied on the recovery of phenolic compounds from GFS and UFS and results are presented in . It was observed that UAE temperature in the range of 35–45°C resulted in recovery of more phenolics from the seed sample and UFS yielded more phenolics (7.534 mg GAE/g) at 35°C than at 45°C (6.683 mg GAE/g). The lower recoveries were obtained at 25°C and 55°C which show that phenolics may be sensitive to higher temperatures and too low temperature may have reduced the solubility of phenolics in ethanol. Hence an optimum temperature is an essential variable to obtain higher phenolics yields from plant materials (Ghafoor et al., Citation2012). The UAE time was varied from 10–40 min to evaluate its effects on phenolic compounds. The data in show that an increase in extraction time up to 30 min resulted in increasing the yield of phenolics both from GFS (5.882 mg GAE/g) and UFS (7.534 mg GAE/g). It was also observed in all of these single-factor trials that UFS carried more quantities of phenolic compounds as compared to GFS, which indicate the phenolic compounds, may have been utilized during germination. It has been reported that phenolic compounds may protect plant or a germinating seedling from environmental stresses (Ghafoor, AL-Juhaimi, Ozcan, & Jahurul, Citation2015). Similarly prolonged incubation (3 days at 35°C) during germination process may have a deleterious effect on phenolics as different studies discuss the sensitivity of these compounds toward heat (Ghafoor & Choi, Citation2009; Ghafoor et al., Citation2012). Hooda and Jood (Citation2003) also observed that a 48-h germination of fenugreek seed resulted in reduction of polyphenols, starch, dietary fiber and phytic acid whereas the contents of sugars, proteins and lysine increased. In the current study, a 3-day germination process reduced the phenolic contents in fenugreek seed significantly (p < 0.05). In another study (Cevallos-Casals & Cisneros-Zevallos, Citation2010), germination of seeds from mungbean, alfalfa, fava, fenugreek, mustard, wheat, broccoli, sunflower, soybean, radish, kale, lentil and onion was reported to improve the phenolic and antioxidant activity of 7 day sprouts. It may be explained that during the initial germination period, phenolic compounds in seed are utilized because they may act as radical scavengers to protect the emerging seedling from environmental stresses; however, during later stages of germination, phenolics may be synthesized and become structural part of the newly born seedling.
3.2. Optimization for phenolics extraction from un-germinated fenugreek seed
The experimental design for RSM and regression analysis was based on Box–Behnken design involving three extraction process or independent variable (ethanol concentration, time and temperature) and one response or dependent variable (total phenolics from UFS during UAE process). The designed experiment was based on a series of preliminary experiment and an extraction time of 30 min, ethanol concentration of 30% and temperature of 40°C were selected as center points (). The complete design and the yields of phenolic compounds obtained in each experimental run are shown in along with the percentage extract yield. The data were analyzed using analysis of variance for the adequacy of model and results are shown in along with the goodness of fit. The significance of regression coefficient was evaluated using Student’s t test and p values. The statistical analysis results showed goodness of fit with Equation (1), considering that they were acceptable when p < 0.05 and R2 values were satisfactory.
Table 3. Regression coefficients and model analysis for total phenolic compounds from fenugreek seed.
Tabla 3. Coeficientes de regresión y análisis modelo para el total de compuestos fenólicos de la semilla de fenogreco.
The maximum amount of phenolic compounds (8.52 mg GAE/g) from UFS was recovered when UAE was carried out at 40°C for 30 min using 30% ethanol as solvent. During preliminary trials, it was observed that the proper selection of all these three parameters can be crucial to the recovery of phenolic compounds; that is, any increase or decrease may result in altering the UAE process efficiency. Hence in order to describe the exact statistical relationship of all three process variables on the response variable, multiple regression analysis was carried out for the predicting a model based on significance of different regression coefficients. It was observed that the effects of time (20–40 min), ethanol concentration (20–40%) and temperature (30–50°C) were significant (p < 0.05) on total phenolic compounds. These effects relate to fact that any variations in UAE process variables, either increasing or decreasing them beyond certain levels, can significantly affect phenolics recovery from UFS.
The statistical results for values of coefficients to be used in the regression model are presented in . It was observed that the linear (β1, β2, β3) and quadric terms (β11, β22, β33) had significant values, so they were used to obtain a predictive model as shown in (Equation (3)). The cross-product terms had nonsignificant values and hence excluded from the final model as follows:
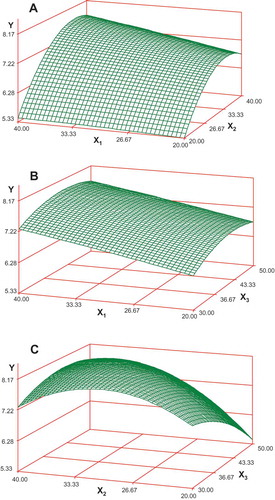
where Y is representing total phenolic compounds from UFS and X1, X2 and X3 are UAE process variables, i.e. time, ethanol concentration and temperature, respectively. Based on this model response, surface plots were constructed to show relationship of response variable, i.e. total phenolics (Y) with UAE time, solvent concentration and temperature as presented in . These graphs show that there is a linear increase in total phenolic compounds by increasing either of two process variables up to certain levels while keeping the third one as constant. It is worth mentioning that the optimization of these process variables can affect the yield as well as the functionality of these bioactives. The regression analysis and response surface studies showed that the optimum UAE conditions were 38°C temperature, 32 min time and 33% ethanol for the maximum possible amount of total phenolic compounds (8.41 mg GAE/g DW) from UFS. The model’s R2 value was 0.956, the adjusted R2 value was 0.902, F value was 39.29 and p value was 0.03 ( and ). Based on these statistical interpreters, it can be inferred that the model can be effectively used for prediction of optimal yield of phenolics during UAE process from UFS. In order to compare the actual values with those of predicted values, a confirmatory experiment was conducted by carrying out UAE at predicted conditions and the yield of phenolics from UFS was 8.39 ± 1.26 mg GAE/g that was close to the predicted value. A Student’s t test also showed a nonsignificant difference between predicted and actual values for the UAE response which establishes that the model was effective to estimate the optimized recovery of phenolic compounds from UFS. The results of this study can be effectively used in establishing a UAE system for the recovery of important bioactive compounds from fenugreek seed. The radical scavenging activities of phenolic rich extract obtained in the designed experiments were up to 62.74 ± 1.66%, which shows that the phenolic compounds of UFS are effective natural antioxidants.
Table 4. Analysis of variance of the second-order model for total phenolic compounds from fenugreek seed.
Tabla 4. Análisis de varianza del modelo de segunda orden para el total de compuestos fenólicos de la semilla de fenogreco.
Table 5. Statistical interpreters of the predicted model.
Tabla 5. Interpretadores estadísticos del modelo previsto.
Figure 2. Response surface figures showing effects of (A) extraction time (X1, min) and ethanol concentration (X2, %) at constant extraction temperature; (B) X1 and temperature (X3, °C) at constant ethanol concentration; and (C) ethanol and temperature at constant time for the extraction yield of phenolic compounds from fenugreek seed.
Figura 2. Gráficos de superficie de repuesta que muestran los efectos de: A, tiempo de extracción (X1, min) y concentración de etanol (X2, %) a una temperatura constante de extracción; B, X1 y temperatura (X3, °C) a una concentración constante de etanol y C, etanol y temperatura a un tiempo constante para el rendimiento de extracción de los compuestos fenólicos de la semilla de fenogreco.
The extraction of phytochemicals from plant materials can be referred as solid–liquid extraction and explained as a mass transport phenomenon. The solids in the plant matrix are released into the solvent surrounding the matrix and this mass transport phenomenon can be increased by ultrasounds application and optimizing extraction temperature and other process variables (Corrales, Garcia, Butz, & Tauscher, Citation2009). The effects of solvent concentration and extraction time can also be significant while extracting phenolic compounds from plant materials (Wang, Sun, Cao, Tian, & Li, Citation2008). The application of UAE can help break plant matrix releasing bioactive molecules into the solvent surrounding it (Vinatoru et al., Citation1997). It has been reported earlier that extraction optimization can involve the selection of the appropriate process time, solvent concentration and temperature (Spigno, Tramelli, & De-Faveri, Citation2007). Different organic solvents can be used; however, the use of ethanol, which is regarded as a dietary alcohol, is common in phytochemicals’ extraction (Castañeda-Ovando, Pacheco-Hernandez, Páez-Hernandez, Rodriguez, & Galán-Vidal, Citation2009). Studies show that the increase in working temperature may favor extraction by improving the solute solubility and the diffusion coefficient; however, a too high temperature can also result in denaturation of phenolic compounds, which justifies the selection of the best temperature limits (Spigno et al., Citation2007; Yilmaz & Toledo, Citation2006). It was observed that application of UAE for the extraction of phenolics from UFS was effective and may have resulted in optimal extraction at lower temperature in a shorter time and making use of less concentrated organic solvent. This increased efficiency of UAE process may be related to sonication which improved hydration and fragmentation processes, thereby improving the transfer of solute from sample into the extraction medium (Toma, Vinatoru, Paniwnyk, & Mason, Citation2001). The results of this study are not only useful for the recovery of phenolic compounds from UFS but can also be used for designing an extraction process for other plant materials, especially plant seed.
4. Conclusions
It can be concluded that a 3-day germination (35°C) process did not result in improving the yield of phenolic compounds from fenugreek; rather it showed a detrimental effect on total phenolics quantities. The UAE variables such as time, temperature and solvent concentration were observed to affect the yield of phenolics and based on preliminary trial, a designed experiment was used to predict their optimal level. It was observed that optimum UAE conditions were 38°C temperature, 32 min time and 33% ethanol for the maximum phenolics yield (8.41 mg GAE/g DW), which conformed with the confirmatory experiment. Fenugreek seed was observed to be a valuable source of phenolic compounds carrying radical scavenging properties both of which can be improved through process optimization.
Disclosure statement
No potential conflict of interest was reported by the authors.
Additional information
Funding
References
- Castañeda-Ovando, A., Pacheco-Hernandez, M. L., Páez-Hernandez, M. E., Rodriguez, J. A., & Galán-Vidal, C. A. (2009). Chemical studies of anthocyanins: A review. Food Chemistry, 113, 859–871. doi:10.1016/j.foodchem.2008.09.001
- Cevallos-Casals, B. A., & Cisneros-Zevallos, L. (2010). Impact of germination on phenolic content and antioxidant activity of 13 edible seed species. Food Chemistry, 119, 1485–1490. doi:10.1016/j.foodchem.2009.09.030
- Chatterjee, S., Variyar, P. S., & Sharma, A. (2009). Stability of lipid constituents in radiation processed fenugreek seeds and turmeric: Role of phenolic antioxidants. Journal of Agricultural Food Chemistry, 57, 9226–9233. doi:10.1021/jf901642e
- Corrales, M., Garcia, A. F., Butz, P., & Tauscher, B. (2009). Extraction of anthocyanins from grape skins assisted by high hydrostatic pressure. Journal of Food Engineering, 90, 415–421. doi:10.1016/j.jfoodeng.2008.07.003
- Dixit, P., Ghaskadbi, S., Mohan, H., & Devasagayam, T. P. A. (2005). Antioxidant properties of germinated fenugreek seeds. Phytotherapy Research, 19, 977–983. doi:10.1002/ptr.1769
- Ghafoor, K., AL-Juhaimi, F., & Choi, Y. H. (2012). Supercritical fluid extraction of phenolic compounds and antioxidants from grape (Vitis labrusca B.) seeds. Plant Foods for Human Nutrition, 67, 407–414. doi:10.1007/s11130-012-0313-1
- Ghafoor, K., AL-Juhaimi, F., Ozcan, M. M., & Jahurul, M. H. A. (2015). Some nutritional characteristics and mineral contents in barley (Hordeum vulgare L.) seeds cultivated under salt stress. Quality Assurance and Safety of Crops & Foods, 7(3), 363–368. doi:10.3920/QAS2013.0380
- Ghafoor, K., & Choi, Y. H. (2009). Optimization of ultrasound-assisted extraction of phenolic compounds and antioxidants from grape peel through response surface methodology. Journal of the Korean Society of Applied Biological Chemistry, 52(3), 295–300. doi:10.3839/jksabc.2009.052
- Ghafoor, K., Choi, Y. H., Jeon, J. Y., & Jo, I. H. (2009). Optimization of ultrasound-assisted extraction of phenolic compounds, antioxidants and anthocyanins from grape (Vitis vinifera) seeds. Journal of Agricultural and Food Chemistry, 57(11), 4988–4994. doi:10.1021/jf9001439
- Ghafoor, K., Hui, T., & Choi, Y. H. (2011). Optimization of ultrasonic-assisted extraction of total anthocyanins from grape peel using response surface methodology. Journal of Food Biochemistry, 35, 735–746. doi:10.1111/j.1745-4514.2010.00413.x
- Hooda, S., & Jood, S. (2003). Effect of soaking and germination on nutrient and antinutrient contents of fenugreek (Trigonella foenum graecum L.). Journal of Food Biochemistry, 27, 165–176. doi:10.1111/j.1745-4514.2003.tb00274.x
- Kenny, O., Smyth, T. J., Hewage, C. M., & Brunton, N. P. (2013). Antioxidant properties and quantitative UPLC-MS analysis of phenolic compounds from extracts of fenugreek (Trigonella foenum-graecum) seeds and bitter melon (Momordica charantia) fruit. Food Chemistry, 141, 4295–4302. doi:10.1016/j.foodchem.2013.07.016
- Petridis, D., Zotos, A., Kampouris, T., & Roumelioti, Z. (2012). Optimization of a steaming with liquid smoke smoking process of Mediterranean mussel (Mytilus galloprovincialis). Food Science and Technology International, 19, 59–68. doi:10.1177/1082013212442183
- Shang, M., Cai, S., Han, J., Li, J., Zhao, Y., & Namba, T. (1998). Studies on flavonoids from fenugreek (Trigonaella foenum graecum L.). Zhongguo Zhong Yao Za Zhi, 23(10), 614–639.
- Singleton, V. L., & Rossi, J. J. (1965). Colorimetry of total phenolics with phosphomolybdic phosphotungstic acid reagents. American Journal of Enology and Viticulture, 16, 144–158.
- Spigno, G., Tramelli, L., & De-Faveri, D. M. (2007). Effects of extraction time, temperature and solvent on concentration and antioxidant activity of grape marc phenolics. Journal of Food Engineering, 81, 200–208. doi:10.1016/j.jfoodeng.2006.10.021
- Teng, H., & Choi, Y. H. (2012). Optimization of extraction of total alkaloid content from rhizome coptidis (Coptis chinensis franch) using response surface methodology. Journal of the Korean Society for Applied Biological Chemistry, 55(2), 303–309. doi:10.1007/s13765-012-1148-z
- Toma, M., Vinatoru, M., Paniwnyk, L., & Mason, T. J. (2001). Investigation of the effects of ultrasound on vegetal tissues during solvent extraction. Ultrasonics Sonochemistry, 8, 137–142. doi:10.1016/S1350-4177(00)00033-X
- Vinatoru, M., Toma, M., Radu, O., Filip, P. I., Lazurca, D., & Mason, T. J. (1997). The use of ultrasound for the extraction of bioactive principles from plant materials. Ultrasonics Sonochemistry, 4, 135–139. doi:10.1016/S1350-4177(97)83207-5
- Wang, J., Sun, B., Cao, Y., Tian, Y., & Li, X. (2008). Optimisation of ultrasound-assisted extraction of phenolic compounds from wheat bran. Food Chemistry, 106, 804–810. doi:10.1016/j.foodchem.2007.06.062
- Yilmaz, Y., & Toledo, R. T. (2006). Oxygen radical absorbance capacities of grape/wine industry byproducts and effect of solvent type on extraction of grape seed polyphenols. Journal of Food Composition and Analysis, 19, 41–48. doi:10.1016/j.jfca.2004.10.009
- Zheng, H.-Z., Hwang, I.-W., Kim, B.-K., Kim, Y.-C., & Chung, S.-K. (2014). Phenolics enrichment process from unripe apples. Journal of the Korean Society for Applied Biological Chemistry, 57(4), 457–461. doi:10.1007/s13765-014-4013-4