
ABSTRACT
The objective of the experiment was to study the influence of the intensity of light at the pork loins surface on their physicochemical and microbiological properties as a function of cold storage. Meat slices were packed in modified atmosphere packs (MAP: 80% O2 and 20% CO2) and stored in the darkness or displayed under fluorescent light (1000 lx and 2000 lx, respectively) for 12 days. Results indicated that on the last day of storage pork loins stored under light were more discolored, had greater drip loss, and were less tender (P < 0.05). Moreover, excessive light intensity (LI) accelerated microorganism growth and led to an increase of n-6/n-3 ratio (P < 0.05). Finally, MAP packages stored under 2000 lx were characterized by the lowest oxygen and the highest carbon dioxide content. Considering the above, it is recommended to store pork loins in the dark and if it is not possible in the low LI.
RESUMEN
El objetivo de este experimento fue estudiar la influencia de la intensidad de luz en la superficie del lomo de cerdo, en particular en sus propiedades fisicoquímicas y microbiológicas como función del almacenamiento en frío. Se envasaron las porciones de carne en paquetes de atmosfera modificada (MAP: 80% de O2 y 20% de CO2) y se almacenaron en la oscuridad o se colocaron bajo fluorescentes (1000 lx y 2000 lx respectivamente) durante 12 días. Los resultados indicaron que en el último día de almacenamiento el lomo de cerdo almacenado con luz presentaba una apariencia más descolorida, una mayor pérdida por goteo y menos ternura (P < 0,05). Además, el exceso de intensidad de luz aceleró el crecimiento de microorganismos y conllevó a un aumento de la proporción de n-6/n-3 (P < 0,05). Finalmente, los paquetes de MAP almacenados bajo 2000 lx se caracterizaron por tener el menor contenido de oxígeno y el mayor contenido de dióxido de carbono. Considerando los aspectos examinados, se recomienda almacenar el lomo de cerdo en la oscuridad y en caso de no ser posible, hacerlo con la menor intensidad de luz posible.
1. Introduction
Improvement of the color stability of meat and extending its shelf life represents a main problem of meat market (Kumar, Yadav, Ahmad, & Narsaiah, Citation2015), since pigment and lipid oxidation are the two main causes of meat quality deterioration (Morrissey, Sheehy, Galvin, Kerry, & Buckley, Citation1998). Packaging systems should prevent or delay undesirable changes in meat appearance, taste, smell, and texture because it may cause economic losses due to rejection by the consumers (Paramithiotis, Skandamis, & Nychas, Citation2009). Currently it is common practice to package fresh red meat under atmosphere containing 75–80% oxygen and 20–25% carbon dioxide (Resconi et al., Citation2009). In such conditions the oxygen penetrating into the muscle tissue improves color stability of meat through an increase in the concentration of the oxymyoglobin on its surface, and carbon dioxide delays growth of spoilage bacteria. If the concentration of oxygen in the atmosphere of the package is maintained at a high level, the oxygenated layer depth is much larger than in the air (increased by 3–5 mm), the desired red color of meat is more intense, and brownish metmyoglobin formation on the meat surface can be delayed. However, high O2 modified atmosphere packaging (MAP) may also promote oxidation of muscle lipids over time with deleterious effect on its color (Ščetar, Kurek, & Galić, Citation2010). Additionally light, which is typically used to illuminate refrigerated counters and resulting in a greater and more effective sale of high O2 MAP-packaging meat could be a critical factor affecting its quality. It plays a key role in the photooxidation process of myoglobin and acts as photosensitizer thus promoting lipid oxidation (Boselli, Cardenia, & Rodriguez-Estrada, Citation2012; Lee, Kim, Kim, & Song, Citation2001; Pegg, Shahidi, & Fox, Citation1997). The exposure of packaged food to light may also lead to vitamin and protein oxidation, the degree to which depends on, among applied exposure time, the degree of light permeability of packaging material and light intensity (LI) (Singh & Singh, Citation2005). Therefore, it seems to be necessary to find a balance between marketing advantages of lit refrigerated counters and the quality deterioration of MAP-stored meat when exposed to light.
Nowadays, the most popular light source in food stores, due to its relatively low-heat output and high efficiency, is fluorescent light (Barbut, Citation2001). To maximize appearance and at the same time minimize photooxidation in MAP Mancini and Hunt (Citation2005) recommended to use fluorescent light with an intensity of 1614 lx and color temperature of 3000–3500 K. According to Anderson, Bertelsen, and Skibsted (Citation1989), the degree of discoloration of the product depends on the LI and its wavelength. However, Cierach and Niedźwiedź (Citation2014) reported that the undesired changes in the chromatic parameters of beef color, resulting from exposure to the light, are not proportional to the fluorescent LI (500, 1000, and 1500 lx). Taking this into account, not all the study results regarding the influence of light on meat quality characteristics are conclusive. Additionally most researchers have investigated the effect of different light sources on meat and meat products quality and consumer preference rather than focus on the effects of LI (Barbut, Citation2001; Cardenia et al., Citation2011; Martínez, Cilla, Beltrán, & Roncalés, Citation2007; Steele et al., Citation2016). Therefore, the aim of the study presented in this paper was to evaluate the influence of fluorescent LI on physicochemical and microbial properties of pork loins stored in commercially used MAP.
2. Materials and methods
2.1. Animals and sampling
The experimental procedures were approved by the Local Ethical Commission (no 27/2009). The pigs were reared under conventional indoor system, which guaranteed an appropriate level of animal welfare with an unlimited access to water. All the animals were fed a standard diet based on rapeseed, soya, wheat, and barley meal (crude protein 160 g/kg and metabolisable energy 13 MJ) until they reached the slaughter weight of 100 ± 2 kg (around 160 ± 3 days of life).
The experiment was carried out on 30 crossbred gilts of Polish Landrace × Duroc. After slaughter in commercial slaughterhouse and 24 h chilling, pork loins (m. longissimus thoracis et lumborum) were separated from six randomly selected carcasses (six loins from the left and six loins from the right half carcasses) and transported in cold conditions at temperatures of around 2°C to the Warsaw University of Life Sciences (Warsaw, Poland).
At the 48th hour post mortem the obtained meat was divided. The whole left loins were designated for physicochemical analysis and the right ones for microbiological analysis. Each of 6 left loins was divided into 20 pork steaks (2 steaks in tray): 10 slices from left loin (thickness of 1.5 cm) were used to evaluate pH, chromatic parameters, drip loss, basic composition, and fatty acid (FA) profile and next 10 slices (thickness of 2.5 cm) were used for cooking loss and the Warner Bratzler Shear Force (WBSF) evaluation on cooked meat. Hereby, under each light condition and at each time of storage the analyses were made from the same loin. Also each of 6 right loins was divided into 20 pork steaks with 2 different thicknesses to create similar conditions for storage (2 steaks in tray). Laboratory analyses were performed at 8, 10, and 12 days of storage. The samples identified as ‘0 day’ were controls and they were analyzed on the same day of packaging within 2 h from collection time. All measurements were conducted in sextuplicate for each light condition and at each time of storage.
2.2. Packaging and storage conditions
Gas composition used for MAP was 80% oxygen (O2) and 20% carbon dioxide (CO2) and the gas headspace to meat ratio was 1:1. Pork loins were packaged in polypropylene/ethylene vinyl alcohol/polypropylene (PP/EVOH/PP) trays with oxygen permeability equal to 0.02 cm3/package/24 h (23°C and 0% R.H) using semiautomatic packaging machine (SEALPAC M3, Sealpac GmbH, Oldenburg, Germany). The samples were stored in the dark (c) or were exposed to white fluorescent light commonly used in the food cases in grocery stores (30 W/79 1 SL/25, MASTER TL-D Food G13, Philips; color temperature = 3800 K) of lux value 1000 (s1) and 2000 (s2), respectively, at a temperature of 2°C ± 1°C for 12 days. LI measured with a digital lux meter (Datalogging Light meter LXP-1, Sonel S.A., China) was adjusted by changing the distance between the meat surface and the source of light.
2.3. Gas analysis in MAP
The gas atmosphere (% O2 and % CO2) in the packages was checked on the first, eighth, tenth, and twelfth day using a gas analyzer (PAS/P, WITT-GASETECHNIK GmbH & Co KG, Witten, Germany) where the instrument needle was inserted through a rubber septum attached to the lidding material. The results were expressed as % O2 and % CO2.
2.4. Physical analysis
The pH value of pork loins was measured according to the device instructions, using a Testo 205 pH meter (Testo Inc., Germany) equipped with a glass electrode. The electrode was calibrated against buffers of pH 4.0 and 7.0 and then placed directly into the samples (2 cm deep). Each measurement was performed in three replications, taking the mean value as the assay result. The temperature of the samples during the measurements was 2 ± 1°C.
The instrumental measurement of the color parameters of pork loins (L*, a*, b*, and C*) was specified using a Minolta chromameter (CR-400, Konica Minolta Inc., Tokyo, Japan), with a spot diameter of 8 mm, a D65 illuminant (color temperature – 6500 K) and an observer angle of 2°. The chromameter was calibrated on the CIE LAB color space system using a white plate (L* = 98.45, a* = −0.10, b* = −0.13). Measurements of the samples were taken immediately after opening the package from five locations including the center and every quarter of the meat. Additionally on each day of storage total color difference (ΔE) in relation to day 0 was determined according to the following formula:
Drip loss was calculated as the difference in the meat weight before and after storage, according to the following formula:
in which DL is an indicator of drip loss in %, m1 is the weight of raw material before storage expressed in grams and m2 is the weight of raw material after storage expressed in grams.
To assess the cooking loss, pork loin chops were cooked in a water bath (80°C) until an internal temperature of 72°C was reached. Afterwards, the samples were cooled at room temperature and chilled for another 12 h to achieve an internal temperature of 4°C (Marcinkowska-Lesiak et al., Citation2016). Cooking loss was calculated as the percentage of the weight of cooked samples compared with the weight of raw samples, according to the following formula:
in which CL is an indicator of cooking loss in %, m2 is the weight of raw material after storage expressed in grams and m3 is the weight of cooked samples expressed in grams.
Shear force measurements were performed according to the method described by Marcinkowska-Lesiak et al. (Citation2016) using an Instron universal testing machine (Model 5965, Instron Co., Canton, MA, USA). Six cylindrical samples from each pork loin slice, with the diameter of 1.27 cm and height of 2.5 ± 0.3 cm, were sheared using a ‘V’ shaped steel knife perpendicular to the muscle fibers orientation. The capacity of the measuring head of the machine amounted to 500 N and crosshead speed was 200 mm∙min−1. The hardness of pork loins (N) was defined as the maximum force on the shear curve.
2.5. Chemical analysis
The determination of water, protein, fat, ash, and connective tissue content was performed using a near-infrared (NIR) spectrometer (NIR Flex N-500, Büchi Labortechnik AG, Flawil, Switzerland), operating in the spectral range of 780–2500 nm in reflectance mode. Portions of ground pork loin (150 g) were placed on a glass Petri dish to a depth of 0.5 cm. The measurement was conducted in three repetitions for each sample.
For FA profile determination the lipids were extracted from homogenized samples (5 g) with chloroform–methanol 2:1 (v/v) according to the method described by Folch and Lees (Citation1957). Fatty acid methyl esters (FAME) were analyzed following the procedure described by Poławska et al. (Citation2012) using a GC-7890 Agilent gas chromatograph equipped with a 60 m capillary column (Hewlett-Packard-88, Agilent J&W GC Columns, USA) with a 0.25 mm inner diameter and coating thickness of 0.20 μm. A 1 μl sample was injected at a split ratio of 1:40. Helium was used as a carrier gas at a flow rate of 50 mL∙min−1. The temperature program with a total run time of 47 min. was: from 140°C (held for 5 min) at a rate of 4°C∙min−1 to 190°C and then to 215°C at a rate 0.8°C∙min−1. Individual FA peaks were identified by comparison with known reference methyl esters (Supelco 37 Component FAME Mix, 47885-U, Sigma-Aldrich Co.). All FA values were expressed as a weight percentage of total FAs. The FA measurement of pork loins was carried out on the first and last day of storage.
2.6. Microbiological analysis
Microbiological analysis of stored pork loins were performed in the Accredited Laboratory (accreditation no. PCA no AB 1095) on every measurement day in accordance with the relevant harmonized standards: with the relevant harmonized standards: ISO 6579:2002/Amp.1:2007 (ISO, Citation2007) (the presence of Salmonella spp.), ISO 16649-2: 2001 (ISO, Citation2001a) (the presence of Escherichia coli), ISO 21528-2:2004 (ISO, Citation2004) (the presence of Enterobacteriaceae), ISO 4833-1:2013 (ISO, Citation2013) (total aerobic plates count (TAPC)), ISO 17410:2001 (ISO, Citation2001b) (total psychrotrophic bacteria count), ISO 15214:1998 (ISO, Citation1998) (the number of lactic acid bacteria), ISO 13720:2010 (ISO, Citation2010) (the number of Pseudomonas spp.) and ISO 21527-2:2008 (ISO, Citation2008) (the general amount of yeast and mold).
2.7. Statistical methods
All data were analyzed using the Statistica 10.0 software. The data were analyzed using an individual loin from carcass as the experimental unit. The results were analyzed using two-way ANOVA with the storage time (ST), LI, and interaction (ST × LI) as the factors for oxygen and carbon dioxide concentration, pH, color parameters, drip loss, cooking loss, shear force, basic chemical composition, FA profile, Salmonella spp., E. coli, Enterobacteriaceae, total aerobic plates count, Pseudomonas spp., psychrotrophic bacteria, lactic acid bacteria (LAB), and yeasts and molds. The differences between groups were tested according to the Tukey’s test, performed at the significant level of P < 0.05. Pearson’s linear correlation coefficient was calculated to determine the association grade between WBSF values and drip loss. The results in figures are presented as mean values and standard deviations (SD). The results in tables are presented as mean values with their pooled SEM.
3. Results and discussion
3.1. Gas analysis in MAP
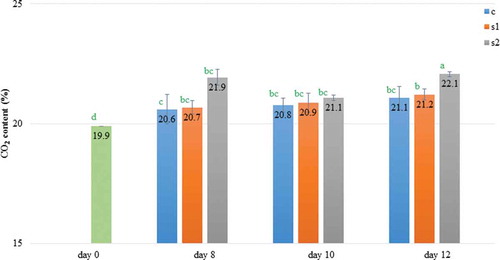
Analysis of changes in the gas concentrations in the modified atmosphere surrounding the stored meat is crucial due to their association with meat discoloration and microbiological growth. Oxygen and carbon dioxide concentrations in MAP-packages were influenced by both ST (P < 0.001), LI (P < 0.01), and the interaction between analyzed factors (P < 0.001). In the experiment on the eighth, tenth, and twelfth day of storage, the O2 concentration decreased reaching the lowest value on the last day for meat kept under 2000 lx (). Conversely, CO2 concentration on day 12 in samples stored at different light conditions increased in relation to the day of meat packaging (). However, for meat kept in the dark and under 1000 lx, the carbon dioxide level remained stable starting from day 8. Daun, Solberg, Franke, and Gilbert (Citation1971) suggested the initial increase in CO2 was due to tissue utilization of O2 while the second increase corresponded to microbial growth. In this work changes in gas composition may be also attributed to microorganism growth (), which was probably intensified by a warmer product surface temperature, when storing meat under 2000 lx (). Nonetheless Daly and Acton (Citation2004) did not report an influence of fluorescent lighting on gas composition in packages with ground beef, but for comparison used a lower illumination intensity of 1550 lx with and without a UV filter.
Table 1. Selected physical parameters of pork loins (Mean) stored under different light intensity.
Tabla 1. Parámetros físicos seleccionados del lomo de cerdo (Promedio) almacenado bajo diferentes intensidades de luz.
Table 2. Profile of fatty acids (% FAMEtotal) pork loins stored under different light intensity.
Tabla 2. Perfil de ácidos grasos (% FAMEtotal) del lomo de cerdo almacenado bajo diferentes intensidades de luz.
Table 3. Microbiological parameters of pork loins (Mean) stored under different light intensity.
Tabla 3. Parámetros microbiológicos del lomo de cerdo (Promedio) almacenado bajo diferentes intensidades de luz.
Figure 1. The O2 content (Mean ± SD) over time within MAP packages of 80% O2 and 20% CO2 containing pork loins stored under different light intensities; Storage: c – in dark; s1 – under 1000 lx; s2 – under 2000 lx; *a-d significantly different (P < 0.05).
Figura 1. El contenido de O2 (Promedio ±- SD) durante el periodo en envases de MAP con 80% de O2 y 20% de CO2 que contenían lomo de cerdo almacenado bajo diferentes intensidades de luz; Almacenamiento: c – en la oscuridad; s1 – bajo 1000 lx; s2 – bajo 2000 lx; *a-d significantivamente diferente (P < 0,05).
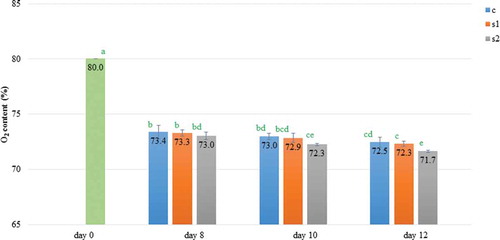
Figure 2. The CO2 content (Mean ± SD) over time within MAP packages of 80% O2 and 20% CO2 containing pork loins stored under different light intensities; Storage: c – in dark; s1 – under 1000 lx; s2 – under 2000 lx; *a-d significantly different (P < 0.05).
Figura 2. El contenido de CO2 (Promedio ± SD) durante el periodo en envases de MAP con 80% de O2 y 20% de CO2 que contenían lomo de cerdo almacenado bajo diferentes intensidades de luz; Almacenamiento: c – en la oscuridad; s1 – bajo 1000 lx; s2 – bajo 2000 lx; *a-d significantivamente diferente (P < 0,05).
3.2. Physical analysis
Storage conditions had no significant effects on pH values of meat. In the experiment the initial pH of meat was typical for normal meat, no PSE or DFD meat was used in this research. Results demonstrated no significant (P > 0.05) effect of LI on the pH value of pork loins, which ranged between 5.4 and 5.6 during the 12 days of storage (). However, on the last day pork loins kept under light were characterized by tendency to a lower pH than those stored in the dark.
The drip loss increased with increasing ST in all samples and it was greater in pork loins stored under light from the tenth to the last day of storage. Lonergan, Huff-Lonergan, Rowe, Kuhlers, and Jungst (Citation2001) suggested that the oxidative processes occurring in both lipid and protein fractions during storage may alter water-holding capacity of meat. The highest drip loss throughout the ST was observed in the pork loins kept under 2000 lx. This is probably due to the fact that increased LI in the presence of oxygen accelerates photooxidation (Alves, Van Dender, Jaime, & Moreno, Citation2002) and the extension of the exposure time increases the damage, i.e. lipid and protein oxidation (Alves et al., Citation2002; Kristensen, Orlien, Mortensen, Brockhoff, & Skibsted, Citation2000; Mortensen, Sørensen, & Stapelfeldt, Citation2002).
Cooking loss, in contrast to the drip loss did not depend on the LI and oscillated between 19% and 23% during the 12 days of storage. According to Jama et al. (Citation2008) any changes in cooking loss of meat with extending meat ST could be caused by decrease in meat acidity. In this work any significant differences in pH values were observed, which may explain obtained results in cooking loss.
All color parameters (L*, a*, b*, C*, and ΔE) were influenced by ST (P < 0.001) and the interaction between analyzed factors (P < 0.01). Moreover LI did not affect only b* parameter of stored meat (P > 0.05). All samples became lighter with increased ST regardless of whether they were kept in the dark or under light. Although, the greater the LI used, the higher the L* parameter of stored pork loins was observed. In general, a* values decreased with increasing ST and LI. On the last day of storage the highest value of a* parameter characterized pork loins stored in the dark and the lowest loins stored under 2000 lx. This is in agreement with results reported by Marriott, Naumann, Stringer, and Hedrick (Citation1967) who showed, that beef steaks stored in the dark for 10 days at a temperature of −1.1°C were characterized by a smaller color change when compared with meat exposed to light. However, Cierach and Niedźwiedź (Citation2014) did not find relations between white fluorescent LI and a* value of muscle longissimus thoracis et lumborum. Obtained in the present study results for pork lead to the conclusion, that higher LI will result in greater discoloration of stored meat, which is undesirable due to consumer acceptance however during the 12 days of storage under different light conditions, the b* value remains relatively constant (). Apart from the redness (a*), also color intensity (C*) is a good indicator of meat discoloration (Owen & John, Citation2001). Degradation of pork loin color was favored by a decrease of chroma (C*) during storage. Samples on the day of packaging (day 0) were more saturated than samples after storage (P < 0.001). By analyzing color differences an increase in the ∆E values was observed over the time. Pork loins exposed to the highest LI were characterized by the largest total changes in its color beginning on the eighth day of storage. Also, Seydim, Acton, Hall, and Dawson (Citation2006) found a clear change of color in ostrich meat under 1700 lx. Our data show that meat stored in the dark was characterized by the lowest ΔE, although total changes of color were more than 3.5 so they were clearly recognized in these samples (Anonymous, Citation1999). Our results are in agreement with the Gould (Citation1963) study, which associated discoloration of pork stored under light conditions with a warmer surface temperature of the product. He observed that a light of low intensity, which does not raise the surface temperature of meat will not change its color. Based on the results of this study, it could be concluded that the change in color of stored meat is not only related to the presence of light but also relatedto the reaction to oxygen content (photooxidation).
WBSF values were affected by ST, LI, and interaction between these two variables (). Shear force values increased only for pork loins stored under light conditions and remained relatively constant for meat kept in darkness throughout the 12 days of storage. Changes in tenderness of stored meat as explained by Mullan and McDowell (Citation2003) could be associated with microbial growth. In our study, the resulting values of correlation indicators also point out significant dependencies between these indicators (r > 0.69). Additionally, a positive correlation (r = 0.87, P < 0.05) between tenderness and drip loss was observed, what means that higher WBSF values were related to the increase in the drip loss of pork loins. Regarding industrial practice, our study shows that, taking into account the meat tenderness, it is preferable to store pork loins at the lowest LI.
3.3. Chemical analysis
In the experiment, the moisture, protein, fat, ash, and connective tissue content of the pork loins based on NIR spectroscopy were respectively: 72.3% ± 0.4; 22.2% ± 0.4; 3.1% ± 0.3; 1.3% ± 0.2; 1.1% ± 0.3. They were quite similar for all animals and should not have affected physicochemical quality of meat. Considering the FA composition, only the ratio of total n-6 FAs to total n-3 FAs in stored meat was influenced by ST, LI, and their interaction (P < 0.05, ). On the 12th day pork loins stored under 1000 lx and 2000 lx were characterized by a higher ratio of n-6/n-3 compared with the meat stored in the darkness. It can be explained by the fact, that n-3 polyunsaturated fatty acids (PUFA) are more susceptible to oxidation than n-6 PUFA and the decrease in their content is faster at high light intensities (Ruiz & Pérez, Citation2014; Walsh, Jones, & Dunstan, Citation1997). Nevertheless, the present study has not clearly demonstrated prooxidative effects of light on stored meat and need further research.
3.4. Microbiological analysis
During the 12-day storage of the pork loins there was no presence of Salmonella spp., and the number of E. coli bacteria and Enterobacteriaceae in each case was <1 log10CFU/g. All analyzed microorganism counts increased throughout the storage period (total aerobic plates count, total psychrotrophic bacteria, LAB, Pseudomonas spp., yeast and molds). Changes in the populations are shown in . Additionally, LI was the factor which had no impact only on total psychrotrophic bacteria (P > 0.05). However, interaction between ST and LI influenced all microbial counts significantly (P < 0.001).
On day 8, pork loins stored under 2000 lx were characterized by the greatest value of TAPC (total aerobic plates count), wherein, on day 10 of storage, meat stored under 1000 lx did not differ significantly from them (). On the last day of storage, a significant increase of the total aerobic plates counts for loins stored under 2000 lx compared to the other samples, was observed again. The effect of light on the growth of microorganisms has also been observed by Marriott et al. (Citation1967). They suggested that light can enhance the growth of microorganisms by the effect of increasing temperature on the meat surface.
Djenane, Sánchez-Escalante, Beltrán, and Roncalés (Citation2001) reported that after 12 days of storage the total psychrotrophic bacteria growth was enhanced in beef longissimus dorsi muscle displayed under standard supermarket fluorescent light (1000 lx) compared with steaks stored in the darkness. In our study, the psychrotrophic count also increases during pork loins storage, however till 12 day inclusive, the total psychrotrophic bacteria remained at a similar level regardless of storage conditions.
During the 12 days of storage, the number of Pseudomonas spp. increased to a small extent in all samples, and on the last day differences were not significant between samples varying in LI (). According to Bingol and Ergun (Citation2011), the growth of Pseudomonas was slowed by increasing CO2 levels in the packs; however at a low temperature they can continue their activities.
In the experiment LAB increased until the end of storage (). Starting from the 10th day, the growth of LAB stored under 2000 lx was the highest compared with the meat kept in dark or under 1000 lx. Their growth stops when glucose is exhausted, usually by 108 CFU/g. In this study, LAB counts in meat stored under the greatest LI were very high, but still remained at an acceptable level. Although the LAB normally do not produce highly harmful byproducts, meat with a lot of them will be characterized by a slightly acidic milky odor and flavor and surface discoloration (Bell, Citation2001; Samelis, Kakouri, & Rementzis, Citation2000; Stolzenbach, Leisner, & Byrne, Citation2009).
Also yeasts and molds counts (Y&M) increased progressively with ST attaining final low level of 2.17–2.66 log10CFU/g on day 12 of storage, regardless of light conditions. This is probably due to the fact that bacteria grow faster and they can greatly outnumber yeasts and molds in stored foods. Additionally it was proven that MAP packaging containing carbon dioxide (above 20%) show substantially inhibitory effects on the growth of Y&M (Dermiki, Ntzimani, Badeka, Savvaidis, & Kontominas, Citation2008).
4. Conclusions
Based on the obtained results, it was concluded that by reducing LI some physicochemical and microbiological properties of MAP-stored pork loins can be improved, which result in their longer color and shelf life. After 12 days of storage pork loins stored under light were more discolored, had greater drip loss, were less tender, and had higher n-6/n-3 ratio, than those, which were kept in the dark. However, the effect of LI on their lipid oxidation should be further examined. Moreover LI of 2000 lx accelerated total aerobic plates count and LAB growth in meat and led to a simultaneous reduction of oxygen and an increase of carbon dioxide content in MAP packages by the end of storage. Having regard to consumers as well as traders to extending meat quality and thereby reduce the economic losses in the meat market, it would be most favorable to keep pork in the darkness or under low LI (1000 lx).
Disclosure statement
No potential conflict of interest was reported by the authors.
Additional information
Funding
References
- Alves, R.M.V., Van Dender, A.G.R., Jaime, S.B.M., & Moreno, I. (2002). Stability of “Requeijao cremoso” in different packages exposed to light. Poster session presented at 26th International Dairy Conference, Paris.
- Andersen, H.J., Bertelsen, G., & Skibsted, L.H. (1989, August 20–25). Wavelength dependence on pigment oxidation investigated in model systems and under storage conditions. Proceedings of the 35th International Congress of Meat Science and Technology, Copenhagen (pp. 454–458). Roskilde: Danish Meat Institute.
- Anonymous. (1999). Color and quality (1st ed.). Kürfrsten-Anlage: Heidelberg Druckmaschinen AG.
- Barbut, S. (2001). Effect of illumination source on the appearance of fresh meat cuts. Meat Science, 59, 187–191. doi:10.1016/S0309-1740(01)00069-9
- Bell, R.G. (2001). Meat packaging: Protection, preservation and presentation. In Y.H. Hui, W.K. Nip, W.K. Rogers, & O.A. Young (Eds.), Meat science and applications (pp. 710). New York, NY: Marcel Dekker.
- Bingol, E.B., & Ergun, O. (2011). Effects of modified atmosphere packaging (MAP) on the microbiological quality and shelf life of ostrich meat. Meat Science, 88, 774–785. doi:10.1016/j.meatsci.2011.03.013
- Boselli, E., Cardenia, V., & Rodriguez-Estrada, M.T. (2012). Cholesterol photosensitized oxidation in muscle foods. European Journal of Lipid Science and Technology, 114, 644–655. doi:10.1002/ejlt.201100352
- Cardenia, V., Rodriguez-Estrada, M.T., Cumella, F., Sardi, L., Della Casa, G., & Lercker, G. (2011). Oxidative stability of pork meat lipids as related to high-oleic sunflower oil and vitamin E diet supplementation and storage conditions. Meat Science, 88, 271–279. doi:10.1016/j.meatsci.2010.12.034
- Cierach, M., & Niedźwiedź, J. (2014). Effects of three lighting intensities during display on discolouration of beef semitendinosus muscle. European Food Research and Technology, 239, 377–383. doi:10.1007/s00217-014-2231-y
- Daly, M., & Acton, J.C. (2004). Effects of dark storage time and UV-filtered fluorescent lighting during display on color stability of high-oxygen modified atmosphere packaged ground beef. Journal of Muscle Foods, 15, 1–22. doi:10.1111/j.1745-4573.2004.tb00676.x
- Daun, H., Solberg, W., Franke, W., & Gilbert, S. (1971). Effect of oxygen-enriched atmospheres on storage quality of packaged fresh meat. Journal of Food Science, 36, 1011–1014. doi:10.1111/j.1365-2621.1971.tb03334.x
- Dermiki, M., Ntzimani, A., Badeka, A., Savvaidis, I.N., & Kontominas, M.G. (2008). Shelf-life extension and quality attributes of the whey cheese “Myzithra Kalathaki” using modified atmosphere packaging. LWT – Food Science and Technology, 41, 284–294. doi:10.1016/j.lwt.2007.02.014
- Djenane, D., Sánchez-Escalante, A., Beltrán, J.A., & Roncalés, P. (2001). Extension of the retail display life of fresh beef packaged in modified atmosphere by varying lighting conditions. Journal of Food Science, 66, 181–186. doi:10.1111/j.1365-2621.2001.tb15603.x
- Folch, J., & Lees, M. (1957). A simple method for isolation and purification of total lipids from animal tissues. The Journal of Biological Chemistry, 226, 497–509.
- Gould, P.F. (1963). Discoloration of fresh meats as influenced by temperature, microflora and light ( Unpublished master’s thesis). University of Missouri, Columbia.
- ISO. (1998). Microbiology of food and animal feeding stuffs – Horizontal method for the enumeration of mesophilic lactic acid bacteria – Colony-count technique at 30º C. ISO 15214:1998. Geneva: Author.
- ISO. (2001a). Microbiology of food and animal feeding stuffs – Horizontal method for the enumeration of -glucuronidase-positive Escherichia coli - Part 2: Colony-count technique at 44 °C using 5-bromo-4-chloro-3-indolyl -D-glucoronide. ISO 16649-2:2001. Geneva: Author
- ISO. (2001b). Microbiology of food and animal feeding stuffs – Horizontal method for the enumeration of psychrotrophic microorganism. ISO 17410:2001. Geneva: Author.
- ISO. (2004). Microbiology of food and animal feeding stuffs – Horizontal methods for the detection and enumeration of Enterobacteriaceae – Part 2: Colony-count method. ISO 21528-2:2004. Geneva: Author
- ISO. (2007). Microbiology of food and animal feeding stuffs – Horizontal method for the detection of Salmonella spp. – Amendment 1: Annex D: Detection of Salmonella spp. in animal faeces and in environmental samples from the primary production stage. ISO 6579:2002/Amd.1:2007. Geneva: Author.
- ISO. (2008). Microbiology of food and animal feeding stuffs – Horizontal method for the enumeration of yeasts and moulds – Part 2: Colony count technique in products with water activity less than or equal to 0,95. ISO 21527-2:2008. Geneva: Author.
- ISO. (2010). Meat and meat products – Enumeration of presumptive Pseudomonas spp. ISO 13720:2010. Geneva: Author.
- ISO. (2013). Microbiology of the food chain – Horizontal method for the enumeration of microorganisms – Part 1: Colony count at 30 degrees C by the pour plate technique. ISO 4833-1:2013. Geneva: Author.
- Jama, N., Muchenje, V., Chimonyo, M., Strydom, P.E., Dzama, K., & Raats, J.G. (2008). Cooking loss components of beef from Nguni, Bonsmara and Angus steers. African Journal of Agricultural Research, 3, 416–420.
- Kristensen, D., Orlien, V., Mortensen, G., Brockhoff, P., & Skibsted, L.H. (2000). Light induced oxidation in sliced Havarti cheese packaged in modified atmosphere. International Dairy Journal, 10, 95–103. doi:10.1016/S0958-6946(00)00028-5
- Kumar, Y., Yadav, D.N., Ahmad, T., & Narsaiah, K. (2015). Recent trends in the use of natural antioxidants for meat and meat products. Comprehensive Reviewsin Food Science and Food Safety, 14, 796–812. doi:10.1111/1541-4337.12156
- Lee, S.K., Kim, Y.S., Kim, J.Y., & Song, Y.H. (2001). Effect of muscle pH and display conditions on surface color in Hanwoo (Korean native Cattle) Beef. Asian-Australasian Journal of Animal Sciences, 14, 365–371. doi:10.5713/ajas.2001.365
- Lonergan, S.M., Huff-Lonergan, E., Rowe, L.J., Kuhlers, D.L., & Jungst, S.B. (2001). Selection for lean growth efficiency in Duroc pigs influences pork quality. Journal of Animal Science, 79, 2075–2085. doi:10.2527/2001.7982075x
- Mancini, R.A., & Hunt, M.C. (2005). Current research in meat color. Meat Science, 71, 100–121. doi:10.1016/j.meatsci.2005.03.003
- Marcinkowska-Lesiak, M., Zdanowska-Sąsiadek, Ż., Stelmasiak, A., Damaziak, K., Michalczuk, M., Poławska, E. … Wierzbicka, A. (2016). Effect of packaging method and cold storage time on chicken meat quality. CYTA – Journal of Food, 14, 41–46. doi:10.1080/19476337.2015.1042054
- Marriott, N.G., Naumann, H.D., Stringer, W.C., & Hedrick, H.B. (1967). Color stability of prepackaged fresh beef as influenced by predisplay environments. Food Technology, 21, 1518–1520.
- Martínez, L., Cilla, I., Beltrán, J., & Roncalés, P. (2007). Effect of illumination on the display life of fresh pork sausages packaged in modified atmosphere. Influence of the addition of rosemary, ascorbic acid and black pepper. Meat Science, 75, 443–450. doi:10.1016/j.meatsci.2006.07.021
- Morrissey, P.A., Sheehy, P.J.A., Galvin, K., Kerry, J.P., & Buckley, D.J. (1998). Lipid stability in meat and meat products. Meat Science, 49, S73-86. doi:10.1016/S0309-1740(98)90039-0
- Mortensen, G., Sørensen, J., & Stapelfeldt, H. (2002). Light-induced oxidation in semihard cheeses. Evaluation of methods used to determine levels of oxidation. Journal of Agricultural Food Chemistry, 50, 4364–4370. doi:10.1021/jf025513z
- Mullan, M., & McDowell, D. (2003). Modified atmosphere packaging. In R. Coles, D. McDowel, & M.J. Kırwan (Eds.), Food packaging technology (pp. 303–339). London: CRC Press.
- Owen, A.Y., & John, W. (2001). Meat Color. In Y.H. Hui, W.-K. Nip, R.W. Rogers, & O.A. Young (Eds.), Meat Science and App.lications (pp. 38–68). Boca Raton, FL: CRC Press.
- Paramithiotis, S., Skandamis, P.N., & Nychas, G.J.E. (2009). Insights into fresh meat spoilage. In F. Toldra (Ed.), Safety of meat and processed meat (pp. 55–82). New York, NY: Springer.
- Pegg, R.B., Shahidi, F., & Fox, J.B. (1997). Unraveling the chemical identity of meat pig ments. Critical Reviews in Food Science and Nutrition, 37, 561–589. doi:10.1080/10408399709527789
- Poławska, E., Lisiak, D., Jóźwik, A., Pierzchała, M., Strzałkowska, N., Pomianowski, J., & Wójcik, A. (2012). The effect of the diet supplementation with linseed and rapeseed on the physico-chemical and sensory characteristics of ostrich meat. Animal Science Papers and Reports, 30, 65–72.
- Resconi, C.V., Escudero, A., Beltrán, J.A., Sañudo, C., Ferreira, V., & Campo, M.M. (2009, August). Effect of modified atmosphere in aroma development of beef. Proceedings of the 55th International Congress of Meat Science and Technology (ICoMST), Copenhagen.
- Ruiz, J., & Pérez, P. (2014). Ingredients. In F. Toldrá, Y.H. Hui, I. Astiasarán, J.G. Sebranek, & R. Talon (Eds.), Handbook of fermented meat and poultry (pp. 61). Ames, IA: Wiley-Blackwell.
- Samelis, J., Kakouri, A., & Rementzis, J. (2000). Selective effect of the product type and the packaging conditions on the species of lactic acid bacteria dominating the spoilage microbial association of cooked meats at 4°C. Food Microbiology, 17, 329–340. doi:10.1006/fmic.1999.0316
- Ščetar, M., Kurek, M., & Galić, K. (2010). Trends in meat and meat products packaging – a review. Croatian Jouranl of Food Science and Technology, 2, 32–48.
- Seydim, A.C., Acton, J.C., Hall, M.A., & Dawson, P.L. (2006). Effects of packaging atmospheres on shelf-life quality of ground ostrich meat. Meat Science, 73, 503–510. doi:10.1016/j.meatsci.2006.01.010
- Singh, R.K., & Singh, N. (2005). Quality of packaged foods. In J.H. Han (Ed.), Innovations in food packaging (pp. 24–44). Amsterdam: Elsevier Academic Press.
- Steele, K.S., Weber, M.J., Boyle, E.A., Hunt, M.C., Lobaton-Sulabo, A.S., Cundith, C. … Roenbaugh, T.L. (2016). Shelf life of fresh meat products under LED or fluorescent lighting. Meat Science, 117, 75–84. doi:10.1016/j.meatsci.2016.02.032
- Stolzenbach, S., Leisner, J.J., & Byrne, D.V. (2009). Sensory shelf life determination of a processed meat product ‘rullepølse’ and microbial metabolites as potential indicators. Meat Science, 83, 285–292. doi:10.1016/j.meatsci.2009.05.011
- Walsh, K., Jones, G.J., & Dunstan, R.H. (1997). Effect of irradiance on fatty acid, carotenoid, total protein composition and growth of microcystis aeruginosa. Phytochemistry, 44, 817–824. doi:10.1016/S0031-9422(96)00573-0