
 ?Mathematical formulae have been encoded as MathML and are displayed in this HTML version using MathJax in order to improve their display. Uncheck the box to turn MathJax off. This feature requires Javascript. Click on a formula to zoom.
ABSTRACT
With the aim to develop a predictive model to quantify shelf-life of yogurt, two yogurt samples were stored at various temperatures (5–35°C) and targeted for sensory assessment and evaluated using physicochemical, microbiological and sensory analysis. An increase in acidity and reduction in three parameters were observed with storage time, but the changes exhibited were relatively small at 5°C compared with the variation at higher temperatures. Our study developed a dynamic prediction model to determine the shelf-life of yogurt. Because of relatively small influence on shelf-life, microbiological data were excluded; thus, shelf-life of this product was established only based on remaining parameters. The results showed that shelf-life prediction was 15.5 and 18.5 days for sample 1 and 2 at 5°C, respectively. The prediction had a minute difference with the marked shelf-life which recognized Arrhenius model as an effective tool to predetermine the shelf-life and to improve the quality management of yogurt product.
RESUMEN
Con el fin de desarrollar un modelo de predicción que permita cuantificar el tiempo de almacenamiento de yogurt, se guardaron dos muestras de yogurt a distintas temperaturas (5–35°C). Posteriormente, las mismas fueron valoradas mediante la realización de análisis fisicoquímico, microbiológico y sensorial. Dicho análisis permitió constatar que durante el tiempo que se almacenó el yogurt, se elevó su acidez y se produjo el descenso de tres parámetros; asimismo, evidenció que los cambios observados cuando el yogurt se almacenó a 5°C fueron relativamente menores en comparación con las variaciones que se produjeron cuando el almacenamiento se realizó a temperaturas más elevadas. Nuestro estudio produjo un modelo de predicción dinámico para determinar el tiempo de almacenamiento de yogurt. Fueron excluidos los datos microbiológicos debido a que inciden de manera relativamente escasa en el tiempo de almacenamiento y, por tanto, el tiempo de almacenamiento de este producto se estableció con base en los parámetros restantes. De acuerdo a los resultados obtenidos, la predicción muestra que el tiempo de almacenamiento del yogurt a una temperatura de 5°C es de 15,5 días y de 18,5 días para las muestras 1 y 2, respectivamente. Asimismo, la predicción arrojó una diferencia mínima con respecto al tiempo de almacenamiento establecido para el yogurt, confirmando que el modelo de Arrhenius constituye una herramienta eficaz para determinar previamente el tiempo de almacenamiento y mejorar el control de calidad de productos de yogurt.
1. Introduction
Yogurt is a widely used dairy product with high consumption worldwide due to its beneficial impact on consumers’ health (Shi, Li, & Zhao, Citation2016). It contains beneficial microbes known as probiotics which following consumption ensure the improved health and nutrition of the consumer. Thus, these organisms have been extensively incorporated into various dairy foods like yogurt over the last decade (Senaka, Evans, Adams, & Baines, Citation2012). Besides, yogurt also serves as a good source of protein, and it is abundant in calcium, vitamin and trace elements (El-Abbadi, Dao, & Meydani, Citation2014; Gopinath et al., Citation2016).
Regular intake of yogurt is able to enhance the immunity and digestive system, prevents aging effectively as well as reduces the risk of hypertension and cardiovascular disease (Meyer, Micksche, Herbacek, & Elmadfa, Citation2006). With the changing life styles, consumer’s increasing consciousness, improvement of living standard and the requirement of healthy diet, yogurt has become one of the most popular dairy products (Shi et al., Citation2016). However, because of the metabolism of active probiotics, yogurt is sensitive to temperature variation and needs to be refrigerated to maintain a good quality (Vargavisi & Pápai, Citation2015). Moreover, limited manufacturing resources, storage conditions and shelf-life of yogurt seem to be relatively short because of the changes in its physical, chemical and organoleptic/sensorial characteristics, making it unacceptable for human consumption. With all the reasons mentioned above, it is equally important to establish a shelf-life prediction model for accurate identification of shelf-life (Al-Kadamany, Khattar, Haddad, & Toufeili, Citation2003).
The shelf-life stated on the product largely relies on the commercial experience and conventional methods which are not consistent, whereas the use of predictive models to establish the shelf-life of yogurt is inadequate. Some predictive models have been developed for shelf-life evaluation in past years which are expensive and laborious. Among them, electronic sensing for rapid diagnosis of food quality (Gómez, Wang, Hu, & Pereira, Citation2008) and multiple linear regression model was reported to predict the shelf-life of roasted coffee-sterilized milk drink (Goyal & Goyal, Citation2012). In the lieu of mentioned issues, recent years have witnessed the development and application of more reliable, effective and fast mathematical modeling such as Weibull hazard model (Chen & Hoover, Citation2004) and Q10 model (Dong, Xiao, Li, & Sun, Citation2015), which have been widely used on food products’ shelf-life evaluation such as chilled pork (Tang et al., Citation2013), frozen shrimp (Tsironi, Dermesonlouoglou, Giannakourou, & Taoukis, Citation2009), ketchup (Koocheki, Ghandi, Razavi, Mortazavi, & Vasiljevic, Citation2009) and juice drinks (Nguyen et al., Citation2016). But only few researches are reported to establish the shelf-life of dairy products by using these methods (Al-Kadamany et al., Citation2003; Cruz et al., Citation2010). Thus, it is important and meaningful to establish the shelf-life of yogurt by applying the mathematical prediction model.
Given that sensory qualities, chemical properties or microbial degradation of foods is quantified algebraically during storage, so it can be used to test the quality of food (Tang et al., Citation2013). In yogurt, most important quality parameters are acidity, viscosity, lactic acid bacteria (LAB) count and sensory evaluation. Thus, it is essential to monitor them during storage, because their changes have a strong relationship with temperature, so accelerated shelf-life testing was conducted to speed up yogurt samples’ spoilage evaluation in the same manner as reported previously (Gómez-Alonso, Mancebo-Campos, Ma, & Fregapane, Citation2004).
In brief, the objective of this study was to investigate the quality changes and model the effect of variable storage conditions on shelf-life so that shelf-life prediction can be carried out by using Arrhenius method through a predictive dynamic model capable of giving reliable and accurate predictions. This potential shelf-life prediction model could serve as a valuable information source for food industries, especially for dairy manufacturers.
2. Materials and methods
2.1. Sample collection, chemical reagents and experimental conditions
Two kinds of yogurt samples (different brands name not revealed) were supplied directly by the manufacturers. Sodium hydroxide, phenolphthalein, diacetyl standard, acetocaustin, MRS culture medium, 1,2-diaminobenzene were obtained from Sinopharm Chemical Reagent, China. The instruments used for our experiments were as follows: PH meter (Mettler-Toledo), UV spectrophotometer (Mettler-Toledo), constant temperature incubator (Thermo Fisher), centrifuge (Beckman Kurt), viscometer (NDJ-9S, Shanghai Yue Ping), suction-type anaerobic jar (CX-HP025, Shanghai Chuan Xiang), autoclave (Thermo Fisher).
Accelerated shelf-life testing (Rahmi, Ahmad, & Wulandani, Citation2016; Wibowo, Grauwet, Kebede, Hendrickx, & Loey, Citation2015) was conducted to identify the influence of the storage temperature on quality changes and shelf-life. The samples were stored at four different temperatures (5, 15, 25, 35°C). Samples that stored at 5°C were measured every 2 days until exceed the time limit. On the other hand, the physicochemical parameters, microbiological count and sensory analysis of samples that stored at 5, 15, 25 and 35°C were measured every day until it became unacceptable for evaluators.
2.2. Physicochemical parameters
For acidity determination, 10 mg (accurate to 0.001 g) of each sample was taken in a 150-mL conical flask, followed by adding 20 mL of distilled water and 2 mL of phenolphthalein solution, and final solution was titrated with sodium hydroxide standard solution until red color appeared and did not fade in 5 s, and the entire titration process was performed within 45 s. Based on the consumption of sodium hydroxide, acidity can be calculated (Mani-López, Palou, & López-Malo, Citation2014). Viscosity was measured by rotator viscometer at the rotation speed of 30 rpm/min followed by selection of rotor number three after repeated experiments. The tests were performed in triplicates.
2.3. Microbiological count
For LAB count, yogurt samples were diluted until appropriate concentration and 1 mL of the final diluent was spread on the surface of the MRS medium and incubated at 37°C for 72 h under anaerobic conditions by using anaerobic jar (with 80%N2, 20%CO2) (Yang, Fan, Jiang, Doucette, & Fillmore, Citation2012). Three parallel tests were conducted for evaluating microbiological count.
2.4. Sensory analysis
There essential sensory aspects (: the color, taste and odor, appearance and mouth feel), after referring to the previous studies, were evaluated by 10 experienced assessors (between 20 and 40 years of age) (Mei, Feng, & Li, Citation2016). It was confirmed that all the panelists were professionally trained according to the description given by Majchrzak, Lahm and Dürrschmid (Citation2010) before they participated in the quantitative descriptive test (Stefanowicz, Citation2013).
Table 1. The scoring scale of sensory evaluation criteria.
Tabla 1. Escala de puntuación de los criterios de evaluación.
2.5. Model development
In the procedure of food processing and storage, most of the food-related quality changes abided by zero-order or first-order reaction model, and the first-order reaction model was much more widely used. The first-order reaction model equation is shown in Equation 1 (Tsironi et al., Citation2009). The Arrhenius equation is shown in Equation 2 (Mahendradatta, Bastian, & Amaliah, Citation2007).
where A is the actual quality of product characteristic during storage time, A0 is the product characteristic at initial condition, Ka is the rate of the change of product quality, T is the storage time (D).
where Ka0 is the constant pre-exponential or absolute rate (undependable on temperature), Ea is the activation energy of change reaction of quality characteristic (kJ/mol), R is the constant of ideal gas (8.314 J/mol K), T is the absolute temperature (K).
Take logarithm on both sides of the second equation (Equation 2) simultaneously, the following equation can be acquired.
According to Equation 3, there is a good linear correlation between and
. So based on the variation of
under different temperatures, Ka was modeled by the Arrhenius equation, then the shelf-life dynamics prediction model can be established.
3. Results and discussions
3.1. Physicochemical analysis
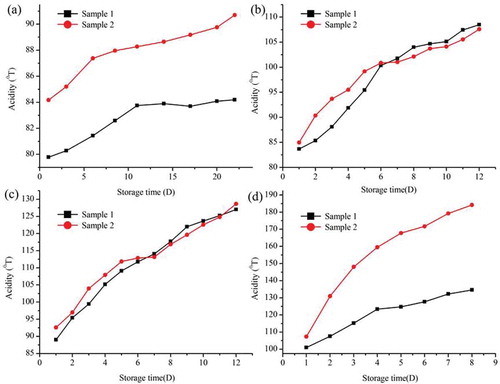
During the storage time, the acidity of two yogurt samples augmented gradually (). While comparing the acidity change trend at different temperatures, it can be concluded that temperature had a huge influence on acidity. The acidity change increased with the higher temperature in both the samples but at 5 and 35°C, the difference in acidity of two samples was very high and the difference increased with the time interval. Whereas at 15 and 25°C, both the samples displayed almost equal increase in acidity without much difference to each other with the storage time. In particular, the acidity increase of sample 2 was 2.96%/day at 5°C while it was 9.61%/day at 35°C during the whole storage time. It has also reported the increase in acidity of yogurt with increasing temperature (>10°C) which was in agreement with the current observation (Mataragas, Dimitriou, Skandamis, & Drosinos, Citation2011; Ott, Hugi, Baumgartner, & Chaintreau, Citation2000).
Figure 1. Variation of acidity with the storage time at four different temperatures: (a–d) represent the variation at 5, 15, 25 and 35°C, respectively.
Figura 1. Variación de acidez con el transcurso del tiempo de almacenamiento a 4 temperaturas diferentes. (a–d) representan las variaciones a 5°C, 15°C, 25°C y 35°C, respectivamente.
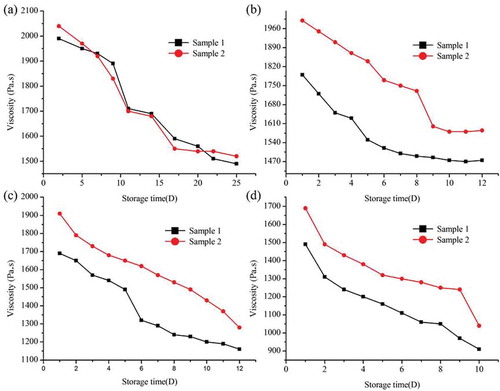
On the other hand, there was drop in viscosity of both the samples with different sensitivity to temperature with the age. The viscosity of two samples has almost followed the same trend at 5°C, but their difference arose at high-temperature range and it increased with the rising temperature (). It might be due to the fact that there were different strains of LAB in these two samples which led to different temperature sensitivity. The LAB is known to produce exopolysaccharides (EPS) which is responsible for viscosity of the final product. We anticipate and also reported in previous studies that the temperature has significant effect on EPS production, thus leading the differences of viscosity in two different samples (Sims et al., Citation2011). Based on , the viscosity decreased rapidly at first, then it was followed by slower rate and remained almost constant at later stage at both 5 and 15°C, except at 25 and 35°C, where it decreased with faster rate in both the samples with the storage period. It might be due to the fact that the increased acidity led to more whey separate out and, then, resulted in decreased viscosity. In another instance, acidity can also destroy the structure of the protein in the yogurt system and cause enhanced viscosity reduction (O’Donnell & Butler, Citation2002). Moreover, among all the physicochemical parameters, viscosity has a significant influence on food, so even little changes in viscosity can affect its taste to a great extent (Costa, Frasao, Rodrigues, Silva, & Conte-Junior, Citation2016; Costa et al., Citation2015). The above-stated facts could be stated as rationale for considering viscosity as an important factor for shelf-life prediction.
Figure 2. Variation of viscosity with the storage time at four different temperatures: (a–d) represent the variation at 5, 15, 25 and 35°C, respectively.
Figura 2. Variación de viscosidad con el transcurso del tiempo de almacenamiento a 4 temperaturas diferentes. (a–d) representan las variaciones a 5°C, 15°C, 25°C y 35°C, respectivamente.
3.2. The variation of the population of LAB during storage time
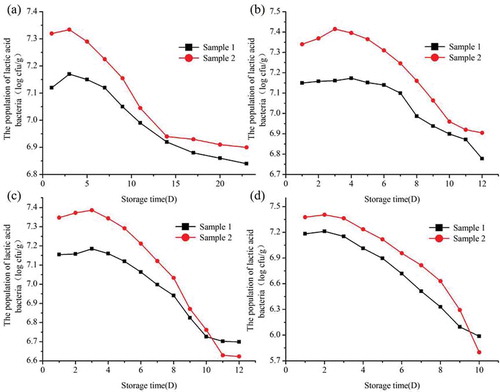
During the storage time, the population of LAB showed increase at the initial stage in both the samples at all the selected temperature ranges. But soon the count was followed by significant decrease for both the samples (). It might be that due to increase in the population of LAB after a certain period of time, the nutrients get consumed which led to competition between LAB for survival. With the increase in time, the LAB populations face scarcity of nutrients as well as LAB also secretes toxic components in the product which could suppress the growth of surrounding LAB. However, the rising temperature encouraged the population of LAB; therefore, considering the final count of LAB in a spoiled product can still fulfill the minimum of nation standard irrespective of product spoilage. In another study, the population of LAB remained unchanged in the beginning, and only at the end, there has been a slight reduction during storage (Mataragas et al., Citation2011) which is in support of our findings. So even if the higher temperature had some influence on the population of LAB, that was not as much of as compared with the variation of acidity. Therefore, acidity was selected to be used in shelf-life prediction.
Figure 3. Variation of the population of lactic acid bacteria with the storage time at four different temperatures: (a–d) represent the variation at 5, 15, 25 and 35°C, respectively.
Figura 3. Variaciones de la población de bacterias de ácido láctico con el transcurso del tiempo de almacenamiento a 4 temperaturas diferentes. (a–d) representan las variaciones a 5°C, 15°C, 25°C y 35°C, respectivamente.
3.3. The variation of sensory evaluation with storage time
Samples were presented to sensory analysts in a series and they were ranked according to the color, taste and odor, appearance and mouth feel. There were obvious overall sensory evaluation scores obtained at all temperature with the storage time (). It was observed that evaluation scores remained positive throughout the storage period at 5°C, whereas with the rising temperatures (15, 25 and 35°C), the scores began to drop and the rapid decline in the scores was observed with the time intervals. Particularly, the taste became unacceptable at day 10 for sample 2, while the score of sample 1 was still high at 15°C, which indicated both the samples differed in their sensitivity to different temperature ranges and this variation was narrowed at the higher temperatures. The change in the value of various parameters used indicates the sensitivity difference between two samples during specific period of time. Because of the increasing acidity and the decreasing viscosity, the taste of two samples deteriorates until it becomes undesirable (overall sensory score less than 60 points). For consumers, sensory is the most important evaluation criterion (Levinson, Ish-Shalom, Segal, & Livney, Citation2016) which makes it the most effective direct way to confirm shelf-life.
Figure 4. Variation of sensory evaluation scores with the storage time at four different temperatures: (a–d) represent the variation at 5, 15, 25 and 35°C, respectively.
Figura 4. Variaciones de los puntajes de la evaluación sensorial con el transcurso del tiempo de almacenamiento a 4 temperaturas diferentes. (a–d) representan las variaciones a 5°C, 15°C, 25°C y 35°C, respectivamente.
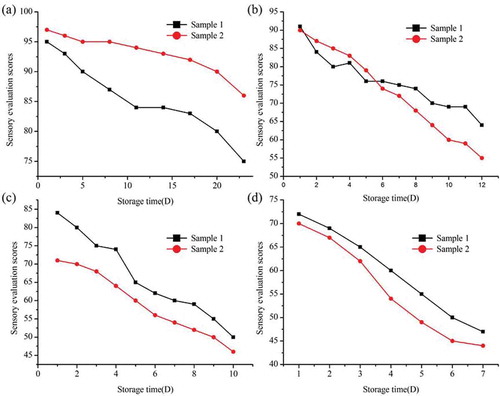
As per the evaluation scores obtained, the yogurt sample 1 was recognized better in quality (on the basis of color, taste and odor, appearance and mouth feel) than sample 2 at all the temperatures except at 5°C. In summary, the sample 1 had obtained the overall (95/100) highest and (47/100) lowest scores, whereas sample 2 showed maximum score of 97 and least score of 44 at different temperature ranges.
3.4. The establishment of shelf-life dynamic prediction model
The regression equations which were obtained by the variation of samples’ acidity are listed in . The regression equations which were obtained by the variation of samples’ viscosity are listed in . The regression equations which were obtained by the variation of samples’ sensory evaluation scores are listed in . These regression equations showed that the A0 of acidity increased with the rising temperature (), the A0 of viscosity and sensory evaluation scores declined with the rising temperature ( and ). The variation of A0 more intuitively showed that temperature had a big influence on these parameters.
Table 2. Regression equations of acidity with time under different storage temperature.
Tabla 2. Ecuaciones de regresión de la acidez con el transcurso del tiempo a distintas temperaturas de almacenamiento.
Table 3. Regression equations of viscosity with time under different storage temperature.
Tabla 3. Ecuaciones de regresión de la viscosidad con el transcurso del tiempo a distintas temperaturas de almacenamiento.
Table 4. Regression equations of sensory evaluation with time under different storage temperature.
Tabla 4. Ecuaciones de regresión de la evaluación sensorial con el transcurso del tiempo a distintas temperaturas de almacenamiento.
Based on the theory which was mentioned above, Arrhenius equations were obtained. All the Arrhenius equations are established in , for sample 1, with. According to Equation 5,
was obtained, so the first-order dynamic equation is shown in Equation 5 which is the first-order dynamic model of sample 1. The initial acidity is
; the ending acidity which cannot be accepted is
. So, the shelf-life of sample 1 was predicted as
. The other predictions were completed in the same way ().
Table 5. Dynamic prediction models of two samples.
Tabla 5. Modelos de predicción dinámicos de dos muestras.
Figure 5. Arrhenius curves: (a) Arrhenius curve of acidity changes of sample 1; (b) Arrhenius curve of acidity changes of sample 2; (c) Arrhenius curve of viscosity changes of sample 1; (d) Arrhenius curve of viscosity changes of sample 2; (e) Arrhenius curve of sensory evaluation changes of sample1 and (f) Arrhenius curve of sensory evaluation changes of sample 2.
Figura 5. Curvas de Arrhenius. (a) Curva de Arrhenius de cambios en la acidez de la muestra 1; (b) Curva de Arrhenius de los cambios en la acidez de la muestra 2; (c) Curva de Arrhenius de los cambios en la viscosidad de la muestra 1; (d) Curva de Arrhenius de cambios en la viscosidad de la muestra 2; (e) Curva de Arrhenius de los cambios en la evaluación sensorial de la muestra 1; (f) Curva de Arrhenius de los cambios en la evaluación sensorial de la muestra 2.
At 5°C, by using the Arrhenius equation (), the shelf-life prediction of sample 1 was 16.1, 20.3 and 15.5 days based on acidity, viscosity and sensory evaluation, respectively. Thus, the final prediction would be 15.5 days and marked shelf-life was 14 days. Similarly, the shelf-life prediction of sample 2 was 18.5, 21.8 and 18.7 days, respectively; so the final prediction would be 18.5 days and the marked shelf-life was 18 days. The minor difference between predicted shelf-life and marked shelf-life shows that the prediction model is effective and can be used to evaluate the shelf-life in yogurt industry.
4. Conclusions
In general, the models which provide rapid consistent information about the shelf-life of the developed products can ultimately speed up the product manufacturing process as well as its success in the marketplace. The changes in the physical, chemical and microbiological structure of yogurt determine the storage and shelf-life of the product. In our study, acidity, viscosity and population of LAB and sensory evaluation were considered as the most important parameters of yogurt. To summarize, the acidity was observed to be increased and the viscosity and sensory evaluation scores were decreased. The population of LAB was reported with a rising trend at the beginning of storage study and subsequently, the drop was observed in the count with the age. In addition, temperature enormously affected the variation of these parameters with a small change at 5°C, while great variations were found with increasing temperature and time. According to the trend of variation, regression equations were formed and all of them were significant. Arrhenius prediction shelf-life models of two yogurt samples were established. At 5°C, the prediction of shelf-life for sample 1 on the basis of model and sample 2, on the basis of model
were 15.5 and 18.5 days, respectively. Our modeling prediction values for both the samples showed that there was excellent relationship between the experimental data and predicted values, with a high determination coefficient () depicting that Arrhenius model can serve as an effective tool for evaluating the shelf-life of yogurt product by using fewer parameters and shorter calculation time. The model might be an alternative method to control the expiration date of yogurt shown in labeling and provide consumers with a safer food supply.
This research could provide valuable information on quality monitoring of yogurt products, constitute a useful practical tool for shelf-life prediction and could also enhance the quality control of yogurt at the same time. However, there is one limitation of the developed model due to its validation only under constant temperature conditions. But in real storage situation, there will always be temperature fluctuation; thus, the prediction model still needs to be improved in future. Further research is needed on the application of our model to varieties of yogurts with subtle sensory differences. Therefore, food companies and dairy industries should rely on valid methodologies such as the prediction model developed to assess the shelf-life of different kinds of yogurts.
Acknowledgements
This work was supported by the Technology center of Anhui Entry-exit Inspection and Quarantine Bureau with project reference no. 1503062007; the Shanghai Entry and Exit Inspection and Quarantine Bureau with project reference no. 14495810200; and the Major projects of science and technology in Anhui Province with project reference no.15czz03115.
Disclosure statement
No potential conflict of interest was reported by the authors.
Additional information
Funding
References
- Al-Kadamany, E., Khattar, M., Haddad, T., & Toufeili, I. (2003). Estimation of shelf-life of concentrated yogurt by monitoring selected microbiological and physicochemical changes during storage. LWT - Food Science and Technology, 36(4), 407–414. doi:10.1016/S0023-6438(03)00018-5
- Chen, H., & Hoover, D.G. (2004). Use of Weibull model to describe and predict pressure inactivation of Listeria monocytogenes Scott A in whole milk. Innovative Food Science & Emerging Technologies, 5(3), 269–276. doi:10.1016/j.ifset.2004.03.002
- Costa, M.P., Frasao, B.S., Rodrigues, B.L., Silva, A.C., & Conte-Junior, C.A. (2016). Effect of different fat replacers on the physicochemical and instrumental analysis of low-fat cupuassu goat milk yogurts. Journal of Dairy Research, 83(4), 493–496. doi:10.1017/S0022029916000674
- Costa, M.P., Frasao, B.S., Silva, A.C., Freitas, M.Q., Franco, R.M., & Conte-Junior, C.A. (2015). Cupuassu (Theobroma grandiflorum) pulp, probiotic, and prebiotic: Influence on color, apparent viscosity, and texture of goat milk yogurts. Journal of Dairy Science, 98(9), 5995–6003. doi:10.3168/jds.2015-9738
- Cruz, A.G., Ehm, W., Cadena, R.S., Jaf, F., Hma, B., Pinheiro, H.P., & Sant’Ana, A.S. (2010). Survival analysis methodology to predict the shelf-life of probiotic flavored yogurt. Food Research International, 43(5), 1444–1448. doi:10.1016/j.foodres.2010.04.028
- Dong, W.L., Xiao, W., Li, D.P., & Sun, Z.H. (2015). Prediction of quality and storage period of soybean in small packages under different temperature. Applied Mechanics & Materials, 731(1), 389–392. doi:10.1007/s12161-014-9963-y
- El-Abbadi, N.H., Dao, M.C., & Meydani, S.N. (2014). Yogurt: Role in healthy and active aging. The American Journal of Clinical Nutrition, 99(5 Suppl), 1263S–1270S. doi:10.3945/ajcn.113.073957
- Gómez, A.H., Wang, J., Hu, G., & Pereira, A.G. (2008). Monitoring storage shelf life of tomato using electronic nose technique. Journal of Food Engineering, 85(4), 625–631. doi:10.1016/j.jfoodeng.2007.06.039
- Gómez-Alonso, S., Mancebo-Campos, V., Ma, D.S., & Fregapane, G. (2004). Oxidation kinetics in olive oil triacylglycerols under accelerated shelf-life testing (25–75°C). European Journal of Lipid Science & Technology, 106(6), 369–375. doi:10.1002/ejlt.200300921
- Gopinath, B., Flood, V.M., Burlutsky, G., Louie, J.C.Y., Baur, L.A., & Mitchell, P. (2016). Dairy food consumption and health-related quality of life in boys: Preliminary findings from a 5-year cohort study. Journal of the American College of Nutrition, 35(6), 522–558. doi:10.1080/07315724.2015.1075444
- Goyal, S., & Goyal, G.K. (2012). Computerized model for estimating shelf life of roasted coffee sterilized milk drink. Advances in Computer Science & Its Applications, 1(3), 185–188.
- Koocheki, A., Ghandi, A., Razavi, S.M.A., Mortazavi, S.A., & Vasiljevic, T. (2009). The rheological properties of ketchup as a function of different hydrocolloids and temperature. International Journal of Food Science & Technology, 44, 596–602. doi:10.1111/j.1365-2621.2008.01868.x
- Levinson, Y., Ish-Shalom, S., Segal, E., & Livney, Y.D. (2016). Bioavailability, rheology and sensory evaluation of fat-free yogurt enriched with VD3 encapsulated in re-assembled casein micelles. Food & Function, 7(3), 1477–1482. doi:10.1039/C5FO01111F
- Mahendradatta, M., Bastian, F., & Amaliah, N. (2007). Shelf-life prediction of seasoning powder made from whole fermented fish (peda) by using arrhenius method. Ipb, 221–233. doi:10.3168/jds.2013-7551
- Majchrzak, D., Lahm, B., & Dürrschmid, K. (2010). Conventional and probiotic yogurts differ in sensory properties but not in consumers’ preferences. Journal of Sensory Studies, 25(3), 431–446. doi:10.1111/j.1745-459X.2009.00269.x
- Mani-López, E., Palou, E., & López-Malo, A. (2014). Probiotic viability and storage stability of yogurts and fermented milks prepared with several mixtures of lactic acid bacteria. Journal of Dairy Science, 97(5), 2578–2590. doi:10.3168/jds.2013-7551
- Mataragas, M., Dimitriou, V., Skandamis, P.N., & Drosinos, E.H. (2011). Quantifying the spoilage and shelf-life of yoghurt with fruits. Food Microbiology, 28(3), 611–616. doi:10.1016/j.fm.2010.11.009
- Mei, J., Feng, F., & Li, Y. (2016). Effective of different homogeneous methods on physicochemical, textural and sensory characteristics of soybean (Glycine max L.). Yogurt. CyTA - Journal of Food, 15(1), 21–26. doi:10.1080/19476337.2016.1197315
- Meyer, A.L., Micksche, M., Herbacek, I., & Elmadfa, I. (2006). Daily intake of probiotic as well as conventional yogurt has a stimulating effect on cellular immunity in young healthy women. Annals of Nutrition and Metabolism, 50(3), 282–289. doi:10.1159/000091687
- Nguyen, H.H., Shpigelman, A., Buggenhout, S.V., Moelants, K., Haest, H., Buysschaert, O., … Loey, A.V. (2016). The evolution of quality characteristics of mango piece after pasteurization and during shelf life in a mango juice drink. European Food Research and Technology, 242(5), 1–10. doi:10.1007/s00217-015-2578-8
- O’Donnell, H.J., & Butler, F. (2002). Time-dependent viscosity of stirred yogurt. Part I: Couette flow. Journal of Food Engineering, 51(3), 249–254. doi:10.1016/S0260-8774(01)00064-4
- Ott, A., Hugi, A., Baumgartner, M., & Chaintreau, A. (2000). Sensory investigation of yogurt flavor perception: Mutual influence of volatiles and acidity. Journal of Agricultural & Food Chemistry, 48(2), 441–450. doi:10.1021/jf990432x
- Rahmi, S., Ahmad, U., & Wulandani, D. (2016). Shelf-life soybean of seed estimation using Accelerated Shelf-life Testing (ASLT) Method. jTEP Jurnal Keteknikan Pertanian, 4(1), 75–80. 10.19028/jtep.04.1.75-80
- Senaka, R.C., Evans, C.A., Adams, M.C., & Baines, S.K. (2012). Probiotic viability and physico-chemical and sensory properties of plain and stirred fruit yogurts made from goat’s milk. Food Chemistry, 135(135), 1411–1418. doi:10.1016/j.foodchem.2012.06.025
- Shi, J., Li, D., & Zhao, X.H. (2016). Quality attributes of the set-style skimmed yoghurt containing enzymatic cross-linked or thermal polymerized whey protein isolate. CyTA - Journal of Food, 15(1), 34–40. doi:10.1080/19476337.2013.837963
- Sims, I.M., Frese, S.A., Walter, J., Loach, D., Wilson, M., Appleyard, K., … Tannock, G.W. (2011). Structure and functions of exopolysaccharide produced by gut commensal lactobacillus reuteri 100-23. Isme Journal, 5(7), 1115–1124. doi:10.1038/ismej.2010.201
- Stefanowicz, P. (2013). Sensory evaluation of food principles and practices. Journal of Wine Research, 24(1), 80–81. doi:10.1080/09571264.2013.764662
- Tang, X., Sun, X., Wu, V.C.H., Xie, J., Pan, Y., Zhao, Y., & Malakar, P.K. (2013). Predicting shelf-life of chilled pork sold in China. Food Control, 32(1), 334–340. doi:10.1016/j.foodcont.2012.12.010
- Tsironi, T., Dermesonlouoglou, E., Giannakourou, M., & Taoukis, P. (2009). Shelf life modelling of frozen shrimp at variable temperature conditions. LWT - Food Science and Technology, 42(2), 664–671. doi:10.1016/j.lwt.2008.07.010
- Vargavisi, É., & Pápai, G. (2015). How to maintain the effective levels of probiotics throughout the shelf life in yoghurt: A review. Acta Agraria Kaposváriensis, 19(1), 65–74.
- Wibowo, S., Grauwet, T., Kebede, B.T., Hendrickx, M., & Loey, A.V. (2015). Study of chemical changes in pasteurised orange juice during shelf-life: A fingerprinting-kinetics evaluation of the volatile fraction. Food Research International, 75, 295–304. doi:10.1016/j.foodres.2015.06.020
- Yang, E., Fan, L., Jiang, Y., Doucette, C., & Fillmore, S. (2012). Antimicrobial activity of bacteriocin-producing lactic acid bacteria isolated from cheeses and yogurts. Amb Express, 2(1), 1–12. doi:10.1186/2191-0855-2-48