
 ?Mathematical formulae have been encoded as MathML and are displayed in this HTML version using MathJax in order to improve their display. Uncheck the box to turn MathJax off. This feature requires Javascript. Click on a formula to zoom.
ABSTRACT
The aim of this study was to develop a model for prediction of the quality of tomato during storage. Two storage conditions (evaporatively cooled and ambient), four disinfection treatments (tap, anolyte, hot and chlorinated water) and three maturity stages (green, pink and red) were employed in this experiment. Using multivariate analysis, the principal components (PC) (PC1, PC2) were analysed. The PC1 and PC2 contributed 47.9% and 26.0% of total variation, respectively. Maturity stages and the disinfection treatments had significant (p < 0.05) influence on PC1 and PC2. Non-linear fractional and polynomial models were fitted to the experimental data to screen the best models. Hue angle, firmness, titratable acidity (TA) and total soluble solid:TA demonstrated non-linear relationship with days of storage. TA, hue angle and firmness of tomatoes fitted well to the models developed. The models are recommended for use by tomato farmers to predict changes in the quality parameters.
RESUMEN
El presente estudio se propuso crear un modelo que permitiera pronosticar la calidad del tomate durante su almacenamiento. Para este cometido, en el experimento se utilizaron dos condiciones de almacenamiento (con enfriamiento por evaporación y a temperatura ambiente), cuatro tratamientos de desinfección (agua de la llave, electrolizada, caliente y clorada) y tres etapas de madurez (verde, rosado y rojo). Mediante análisis multivariado se analizaron los componentes principales (PC1, PC2). El PC1 y el PC2 explican 47,9% y 26,0% de la variación total, respectivamente. Las distintas etapas de madurez y los diferentes tratamientos de desinfección influyeron de manera significativa (P<0,05) en PC1 y PC2. A fin de cribar los mejores modelos se ajustaron modelos fraccionales no lineales y polinomiales a los datos experimentales. Se comprobó que el ángulo del tono, la firmeza, la acidez valorable (TA) y TSS:TA tienen una relación no lineal con los días de almacenamiento (DOS). A su vez, se constató que la TA, el ángulo del tono y la firmeza de los tomates se ajustaron bien a los modelos desarrollados. En conclusión se recomienda a los productores de tomate el uso de estos modelos, ya que permitirán pronosticar los cambios que puedan producirse en los parámetros de calidad.
1. Introduction
A huge postharvest loss of fruit and vegetables including tomato fruit is a bottleneck for agricultural sector industry development. To maintain postharvest quality and freshness of tomatoes, a number of studies have been conducted to maintain the quality and thereby extend shelf-life (García-García, Taboada-Rodríguez, López-Gomez, & Marín-Iniesta, Citation2013; Gharezi, Joshi, & Sadeghian, Citation2012; López & Gómez, Citation2004; Schouten, Farneti, Tijskens, Alarcón, & Woltering, Citation2014). Quality determination is a critical operation for the ease of processing and storability for stakeholders involved in the fresh produce industry. Measurement of quality-related attributes is the tool that can help to investigate and quality control of fresh produce at postharvest handling (Abbott, Citation1999; Pinheiro, Alegria, Abreu, Gonçalves, & Silva, Citation2016; Schouten et al., Citation2014; Schouten, Huijben, Tijskens, & van Kooten, Citation2007).
Alimi, Shittu and Sanni (Citation2014) reported that the final quality is dependent on the interaction effects of the different treatments. Building multiple factors, statistical analysis to study the effects of continuous and categorical variables and covariates is vital for the determination of tomato quality (Binder, Sauerbrei, & Royston, Citation2013; Sobratee & Workneh, Citation2015). A multivariable regression model development is dependent on the selection of covariates that related to the response of interests and searching for an appropriate efficient model for continuous covariates (Binder et al., Citation2013). These data analysis methods can be used to model factors and responses and search for the relationship that exists between all factors and responses and can allow the extraction of useful information from multivariate quality data (Harrell, Citation2015; Var, Citation1998). Facts extracted from multivariate data are very helpful in understanding the characteristics of systems and processes and are useful in solving problems encountered by multiple factors (Var, Citation1998). The multivariate models can be principal component (PC) analysis, factor analysis, cluster analysis and discriminant analysis (Harrell, Citation2015; Var, Citation1998). The variable clustering approach such as oblique-rotation PC analysis was used for categorization of the variables (Alimi, Melesse, & Workneh, Citation2016). This approach can be used to reduce the number of continuous variables to put in the representative group by identifying patterns in a data set and help to eliminate the repetition in a univariate analysis (Iezzoni & Pritts, Citation1991; Martens & Martens, Citation2001). The PC is the linear combination of variables that has maximum variance subject to normalization constraints on the coefficients (eigenvectors) (Harrell, Citation2015) and the total variance created by each PC evaluated as eigenvalue (Iezzoni & Pritts, Citation1991; Martens & Martens, Citation2001; Sobratee & Workneh, Citation2015).
The non-linear dependence on some quality measures and time (days of storage [DOS]) were captured by applying fractional polynomials models. These models have the form α0 + α1tp + α2tq for p ≠ q and α0 + α1tp + α2tp ln t for p = q. The powers p and q are chosen from among −2, −1, −0.5, 0, 0.5, 2, 3 (Melesse & Zewotir, Citation2017). The power factor terms were explored by several researchers to express categorical or continuous variables in fruit and vegetable postharvest management (Binder et al., Citation2013; Long & Ryoo, Citation2010). Multivariate methods of analysis can identify important variables and functional continuous variables (Binder et al., Citation2013). Alimi et al. (Citation2016) analysed the effects of some pre- and postharvest treatments effect on the quality of tomatoes that stored inside refrigerated storage. The authors didn’t account for the effects of firmness, hue angle and maturity stages (MSs) of tomato fruit. Moreover, the cooling approach was not evaporative cooler. The authors rather used mechanical refrigerated cooling system for the study of tomato storability. However, there is no research on model development for the fresh tomato harvested at different MSs, stored under evaporative cooler, treated with environmentally friendly pre-storage disinfection treatments and stored for a period of time. This study, therefore, applied analysis of variance (analysis of covariance [ANCOVA]), multivariate analysis (multivariate analysis of variance [MANOVA]) and the factorial polynomial models to reveal the multifactorial effects of MS harvest, postharvest pre-storage disinfection treatments and low-cost evaporative cooling technology on the quality of tomato fruit during the storage period. The common quality attributes that can be affected includes tomato skin colour, firmness, total soluble solids (TSSs), titratable acidity (TA) and TSSs to TA ratio.
2. Material and methods
2.1. Sample collection and pre-storage treatments
The study took place at the Ukulinga Research Station of the University of KwaZulu-Natal, South Africa. The tomato samples harvested at different MS (i.e. green, pink and red) (Lycopersicon esculentum Mill. cv. Nemonetta) were harvested and transported from ZZ2 firm, Limpopo, South Africa, and transported during the night time by the truck to Pietermaritzburg market station, South Africa, and collected for this experiment. The tomato sample was treated with pre-storage disinfection treatments and stored under two different storage conditions (SC) (i.e. ambient environment [22.8°C and RH of 31%] and inside the experimental forced ventilation multi-pad evaporatively cooled store [EC] [15.2°C and RH of 86%]).
Different pre-storage disinfection treatments (Tr) including control (tap water) treatment (Tr1), anolyte (Tr2), hot water (Tr3) and chlorinated water (Tr4) were applied to the sample. Sample tomatoes were dipped into an anolyte water solution for 5 min (Workneh, Osthoff, Pretorius, & Hugo, Citation2003; Workneh, Osthoff, & Steyn, Citation2012) and surface air dried, before storage in the EC and under ambient conditions (temperature and RH). The hot water treatment was done by dipping the sample into hot water at 42.5°C for 30 min (Itoh, Citation2003). Chlorine disinfection was done by dipping samples into a solution containing 100 µg mL−1 total chlorine (Cl2) for 20 min, which was prepared by dissolving standard grade sodium hypochlorite (5% NaOCl) in tap water (Workneh, Osthoff, & Steyn, Citation2011). The control samples were dipped into cold water for 20 min.
2.2. Quality attributes analysis
2.2.1. pH value
Five tomato samples from each MS were taken and blended into a homogeneous pulp. This was then filtered, using Whatman filter paper No. 1, and 25 mL of the filtrate was then used to measure pH values with a pH meter (Orion Star, Model 210, Thermo Scientific Pty), according to the procedure (AOAC, Citation1995). The pH meter was buffered in to buffer solution for the calibration.
2.2.2. Total TA
A 25-mL filtrate of the pulped tomato was taken for total TA determination and was titrated with 0.1 N NaOH, using a phenolphthalein indicator. The TA content was calculated, using the following equation (AOAC, Citation1995):
where N = normality of NaOH, meq = miliequivalents of citric acid, which is 0064.
2.2.3. Total soluble solids
The TSS content measured a digital handheld refractometer (Pocket Refractometer, PAL-3, Japan). The tomato sample was pulped and filtered by Whatman filter paper No.1. The filtrate was used for the analysis (AOAC, Citation1995). The refractometer prism was cleaned with distilled water and dried by lint-free tissue paper. After every measurement, it was calibrated to zero with distilled water.
2.2.4. TSSs to TA ratio
The TSS to TA ratio of tomato slurry was determined by the following equation (Moneruzzaman, Hossain, Sani, & Saifuddin, Citation2008):
2.2.5. Firmness
The fruit firmness was determined by using the Intron Universal Testing Machine (Model No. 3345) with a 7.5-mm penetration depth, a 3.00-mm s−1 speed, a 50-N maximum force and a 2-mm diameter probe, according to the procedure used by Pinheiro, Alegria, Abreu, Gonçalves and Silva (Citation2013). Five fruits from each category of tomatoes, subjected to different treatments, were used for the analysis. The plate of the instrument, on which tomato sample was placed, is a bowl type to fix the spherical tomato fruit in place during penetration. It has a hole at the centre of the plate for safety reason.
2.2.6. Colour
Tomato skin colour was measured three times for single fruit along the equatorial diameter, using the digital Minolta Chromatic 400 method of the CIELAB colour space, according to the procedures of Batu (Citation2004). The instrument was calibrated against a white standard tile before each colour reading. The L, a*, b* and hue angle (°h) values were measured and recorded. The hue angle (°h) was used for the analysis of tomato colour skin.
2.3. Experimental design
A three factor experiment, three maturities (green, pink and red), four pre-storage treatments (control, anolyte water, hot water and chlorinated water), two SCs (ambient and evaporative cooler) and five replications for each measurements. The data were collected on 0, 7, 14, 21 and 28-DOS at evaporative cooler and ambient environment. The experimental design was arranged in a factorial type of randomized complete block design, with five fruits per sample were randomly picked for the experiment and quality data measurement.
2.4. Data analysis
Statistical analysis was performed using statistical packages for social sciences (SPSS) 24.0 (SPSS Inc.) SAS version 9.4, R ver. 3.32 and MATLAB version 2013a. The descriptive statistics in combination with univariate and multivariate analysis was performed. The significance of the interactions of quality indices in MANOVA was performed by using Wilks’ lambda (λ) test statistics. In addition, ANCOVA was performed.
The PC analysis was performed to evaluate the relationship among the quality indices analysed. The PCs were extracted using Varmix rotation approach (David & Jacobs, Citation2014; Iezzoni & Pritts, Citation1991), which was based on the eigenvalue >1.0 (Iezzoni & Pritts, Citation1991; Shlens, Citation2014). The variances are calculated based on eigenvalues of the correlation values (Iezzoni & Pritts, Citation1991). The PCs can be used in multiple regression analysis to determine the relationship among correlated groups of predictor and individual outcome variables (Alonso-Gutierrez et al., Citation2015; Iezzoni & Pritts, Citation1991; Jolliffe & Cadima, Citation2016). The univariate extraction was followed by the multivariate component analysis for ANOVA. The quality of the models was tested by using some graphical methods including a plot of residuals versus fitted values, residuals homogeneity and normal probability plot. Fractional polynomials can help to handle the presence of curvature in the relationship among variables. The Royston and Altman (Citation1994) and Ambler and Royston (Citation2001) approach to fractional polynomial were adopted to investigate the relationship between DOS and all dependent variables. The details procedure on fractional polynomials can be found on Royston, Ambler and Sauerbrei (Citation1999), Ambler and Royston (Citation2001) and Long and Ryoo (Citation2010).
3. Results and discussions
Several statistical methods were applied to determine the effects of covariates (i.e. MSs, SCs and disinfection treatments [Tr]) on different quality variables (PH, TA, TSS, TSS:TA ratio, firmness and hue angle). Both univariate ANOVA and MANOVA approaches were used to study the effect of these covariates on the quality measurement variables. An attempt to fit the MANOVA model was made. In that, all the quality attributes were considered as a response vector and the covariates as factors affecting the response vector. Four test statistics are usually applied to test for the significance of interactions among covariates used in MANOVA. Pillai’s trace, Wilks’ lambda (λ), Hotelling’s trace and Roy’s largest root were used to study the significance of interaction covariate variables. Wilks’ lambda is more commonly used when the factor variable has more than two categories (Alimi et al., Citation2016; Rencher, Citation2003; Royston & Sauerbrei, Citation2003). In this study, both treatment and MSs have more than two categories. Therefore, Wilks’ lambda test statistic is used. The significance of (p ≤ 0.05) of the three-way interaction test showed the presence of significant interactions of the factors on some, or all, of the dependent variables. Based on this result, the significance interaction for each quality parameter was tested separately using univariate analysis of variance tests.
In the univariate ANOVA tests, in addition to the p-values, the partial eta-squared statistic was employed. Eta squared (ƞ2) measures the ratio of the total variance explained in a dependent variable which was associated with the membership of different groups defined by an independent variable (Richardson, Citation2011). On the other hand, partial eta-squared value is a similar measure by which the effects of other independent variables and interactions are separately singled out (Richardson, Citation2011). That means partial eta squared was used as a measure of effect size or magnitude of variability in the dependent variable that was due to the independent variable.
3.1. pH value
The interactions of MS, Tr and SC had no significant effect on the pH of stored tomato (). Of the two-way interaction terms analysed, only MS × Tr and SC × Tr were found to be highly significant (p ≤ 0.001, p ≤ 0.01 and p ≤ 0.05) on the pH value of tomatoes and responsible for 4.5% and 4.5% variances, respectively. MS × SC interaction had no significant effect. The main factors, MS and Tr, had a significant (p ≤ 0.001, p ≤ 0.01 and p ≤ 0.05) effect on the pH of the stored tomato and responsible for the variation of 4.6% and 4.7%, respectively (). The factor SC has no significant effect on the pH of stored tomato. However, its interaction with Tr has a significant effect. Therefore, SC will remain in the ANOVA model since its higher order interaction is significant.
Table 1. The main and interactive effect of independent variables on some tomato quality indices.
Tabla 1. Efecto principal e interactivo de las variables independientes en algunos índices de calidad del tomate.
The result verifies report of Moneruzzaman et al. (2008) that the pH increased with storage time and influenced by postharvest pre-storage disinfection treatments. In this study, application of multifactorial analysis, the result showed that some of the individual treatments and two-way interactions had an effect on the pH of tomato during the storage, while the three-way interaction had no effect on the pH value.
The partial etta-squared (ƞ2) analysis, variability level in the dependent factors, which are related to and accounted for by the independent variable, was 0.045 and 0.047, respectively for the one-way interaction of Tr or MS and two-way interaction MS × SC, respectively (). This indicates that the one-way interaction was accountable for the variance of more 4.7% than the two-way interaction in pH value.
3.2. Titratable acidity
The two- and three-way interaction between MS, SC and Tr terms analysed had no significance on the TA value (). The main effects MS, SC and Tr had a significant (p ≤ 0.001, p ≤ 0.01 and p ≤ 0.05) effect on the TA of the stored tomato and, hence, responsible for their variations (partial etta squared) in variances of 7.7%, 1.6% and 3.8%, respectively. The result shows that the MS is the most responsible factor to affect the variance, followed by Tr and SC on the TA of the stored tomatoes. The result supports the Moneruzzaman et al. (2008) report that TA increased with storage time and also affected by postharvest treatments.
3.3. Total soluble solid
The three-way interactions of MS, Tr and SC had significant (p ≤ 0.01 and p ≤ 0.05) effect on the TSS content of the stored tomatoes and responsible for the variances of 3.5% (). Moreover, of the two-way interaction terms analysed, only MS × Tr and SC × Tr were significant (p ≤ 0.001, p ≤ 0.01 and p ≤ 0.05) on the TSS content. The effect sizes of these two-way interactions are 6.9% and 2.3%, respectively. The main factors (SC and Tr) had a significant (p ≤ 0.001, p ≤ 0.01 and p ≤ 0.05) effect on the TSS content of the stored tomato and accounted for the effect sizes of 2.4% and 2.3%, respectively. However, MS had a significant (p ≤ 0.01) effect on TSS and responsible for 1.3% of the variation in the dependent variable, TSS. The result shows that two-way (MS × Tr) is the most important factor that affects TSS with higher effect sizes (6.6%) than the three-way interaction (3.5%). That means interaction effect of MS by Tr had more influence on the TSS content than the three-way interaction.
3.4. TSS to TA ratio
Both the two- and three-way interaction terms analysed had no significant effect on the TSS:TA ratios (). Individually, the main effects MS and Tr had a significant (p ≤ 0.001, p ≤ 0.01 and p ≤ 0.05) effect on the TSS:TA ratio of the stored tomato, while the SC had a significant (p ≤ 0.05) effect on the TSS:TA ratio of the stored tomato. The effects size of MS, Tr and SC was found to be 3.3%, 6.3% and 1.2%, respectively. This shows that Tr is the most prominent independent factor that affects the variances of the TSS:TA ratio followed by MS and SC during the storage period. The result is similar to that of Moneruzzaman et al. (2008) report that TSS:TA ratio increased with storage time and affected by postharvest treatments. Therefore, the quality changes of tomato fruit can be maintained in terms of TSS:TA ratio by applying selective postharvest handling (Tr, MS and SC).
3.5. Firmness
The two- and three-way interaction terms analysed had no significant effect on the firmness value (). Among the main effects, only MS had a highly significant (p ≤ 0.01) effect on the firmness (N) value of the stored tomatoes and accounted 6.0% to the total variations in firmness. The result shows that the sole factor that is responsible for firmness is MS of the tomatoes, which can play a great role in the study of fresh tomato fruit texture dynamics and structure. Kader (Citation1986) reported a similar result that firmness decreased with storage time and affected by postharvest treatments. Therefore, the less mature (green and pink) tomato quality can maintain more quality. It could be due to less physiological disorders in less mature and ripe tomato fruit.
3.6. Hue angle
The two- and three-way interaction terms analysed had no significant effect on the hue angle value (). Among the main effects, only MS had a highly significant (p ≤ 0.01) effect on the hue angle (°h) value of the stored tomato and responsible for 7.1% of the variances in hue angle. The result shows that MS is the most important factor that affects the colour of the stored tomatoes. It can play a role in science and technology of colour changes in tomato fruit for quality determination. The result is in support of Kader (Citation1986) report that hue angle decreased with storage time and affected by postharvest treatments. The changes in physiological respiration might contribute to the colour change effect, which can affect the tomato quality during the storage period.
3.7. PC analysis
The PC analysis is one of the multivariate analysis methods by which the quantitative dependent variable data observations that are inter-correlated are analysed (Abdi & Williams, Citation2010). The model validity for PC analysis validity is dependent on Kaiser–Meyer–Olkin (KMO) statistical coefficient, of which the minimum requirement was 0.5 to be appropriate (Alimi et al., Citation2016). The calculated value of KMO is 0.514 which is above the minimum requirement of 0.5. The approximated value of chi-square for Bartlett’s test is 2155.75 with a p ≤ 0.0001. This indicates that the data are well suited for PC analysis. Two PCs (PC1 and PC2) were extracted, which were responsible for 47.92% and 25.97% of current data variances, respectively. Varimax rotation was used in data reduction process. The result showed that four variables (TA, TSS:TA ratio, firmness and hue angle) contributed more to PC1 and the pH and TSS contributed more to PC2 ().
Table 2. Rotated principal components of factor loading for some of the quality attributes of tomato fruit.
Tabla 2. Componentes principales rotados del factor de carga para algunos de los atributos de calidad del tomate.
Parameters that fall under the same PC were reported to have similar characteristic (Alimi et al., Citation2016; Shittu, Sanni, Awonorin, Maziya-Dixon, & Dixon, Citation2007). Accordingly, TA (92.9%) and firmness (87.9%) were the most contributing positive components to PC1, while hue angle (−88.7%) and TSS:TA ratio (−65.9%) had shown the most negative component effect on PC1. The result shows that the positive PC1 percentage value shows a positive relationship between TA and firmness, while hue angle and TSS:TA ratio had a negative percentage values and, hence, reverse relationship. Moreover, TSS (75.7%) and pH (71.5%) showed high load effect on PC2 and the result reveals that TSS and pH are related positively and had a similar effect on tomato quality during the DOS, which is similar to the report of Kader (Citation1986).
shows that the output of the univariate factorial ANOVA used to study the treatment factors on the two extracted PCs. The result can help to identify the relative importance of the treatments to the individual PCs as a group of tomato quality parameters. Moreover, it allows predicting the effects of treatments on the group, rather on the individual quality measurements. All the two-way and three-way interactions between the factors had no significant effect on PC1. The three-way interaction, MS × SC × Tr, had a significant (p ≤ 0.05) effect on PC2. Among the two-way interactions, only MS × Tr had shown significant (p ≤ 0.05) effect on PC2. MS had a significant (p ≤ 0.001) effect and SC had a significant (p ≤ 0.05) effect on PC1. The result shows that the MS is responsible for 8.2% of the overall variances, while SC contributed 1.2% of the variations in PC1. The Tr is accountable for 5.6% variation, MS × Tr for 2.8% variations and MS × SC × Tr for 2.6% of the total variances of PC2. As a result, of all treatment factors, MS and TR had shown an important contribution on the quality of stored tomatoes.
Table 3. Interactive and main effect of treatments on the extracted principal components summarized ANOVA table.
Tabla 3. Efecto interactivo y principal de los tratamientos en los componentes principales extraídos, tabla ANOVA resumida.
3.8. ANCOVA model
The analysis of variance applied in the previous section (PCs) can only consider categorical predictor (Jolliffe & Cadima, Citation2016). However, in this study, the data have also continuous covariate (DOS) that might affect the quality variables used in this study. In ANCOVA analysis, it is possible to consider both categorical and continuous predictors simultaneously (Huitema, Citation2011). Therefore, attempts to fit ANCOVA models for each of the response variables (pH, TSS, TSS:TA ratio, firmness and hue angle) on DOS and three categorical covariates (MS, Tr and SC) together with all possible interactions were performed. At the beginning, TSS was fitted as a function of these covariates (MS, Tr and SC). DOS has no significant effect on TSS. On the other hand, the three-way interaction of categorical predictors (MS × SC × Tr) is significant at 5% level (p ≤ 0.05). Therefore, no further model reduction step is necessary (Huitema, Citation2011). A similar model was fitted using pH as the response variable of interest. DOS has no significant effect on pH value. Similarly, the three-way interaction of MS × Tr × SC term was not significant. Therefore, a simpler model with only two-way interactions between MS × Tr, MS × SC, Tr × SC terms was considered. The two-way interaction between MS and SC was not significant. ANCOVA model of the response variable, TA as a function of DOS and the three categorical covariates, together with their all possible interactions, were fitted to the model. DOS has a highly significant (p ≤ 0.001) effect on TA. The three-way interaction was not significant. Moreover, the two-way interaction MS × Tr, MS × SC, Tr × SC terms were found to be not significant. Therefore, a model without any interaction term is selected as the final model (Egbewale, Lewis, & Sim, Citation2014; Huitema, Citation2011).
A similar analysis was made for the response variable TSSTA ratio. None of the interaction terms were found significant. The results for the response variables (TA, TSS:TA ratio, firmness and hue angel) are presented in . The output indicates that the fitted values of firmness () and TSS:TA ratio () are respectively given by
Table 4. Parameter estimates of the analysis of covariance models for different response variables.
Tabla 4. Estimaciones de los parámetros de análisis de los modelos de covarianza para distintas variables respuesta.
where SC2 is evaporative cooler condition, MS2 and MS3 are pink and red MSs, DOS is days of storage (days), Tr2 is anolyte water dipping, Tr3 is hot water dipping and Tr4 is chlorinated water dipping.
Each of the categorical covariates is binary variable which have a value either 0 or 1. In each case, the first category of each of the categorical covariates was used as reference category and it did not appear in the fitted model. That means for treatment level 1 (Tr2 = 0, Tr3 = 0, Tr4 = 0), first MS (MS2 = 0, MS3 = 0) and first SC (SC = 0), then the value TA will be
Most of the coefficients are negative for TA while most of them are positive for TSS:TA ratio (). TA was negatively related to anolyte and chlorinated water and all MSs. Moreover, as the DOS increases, the value of TA decreases. On the other hand, TSS:TA ratio is positively related to both treatment and MSs. It appears that SC2 has a positive contribution towards TA but a negative contribution towards TSS:TA ratio. There is a positive relationship between TSS:TA ratio and DOS (). DOS is negatively related to TA, firmness and hue angel. Firmness decreases with the DOS (). The level of firmness is highest for the MS1 and SC1.
Figure 1. The typical level of firmness as the function of days of storage (DOS) (n = 5).
Figura 1. Nivel típico de firmeza en función de los días de almacenamiento (DOS) (n = 5).
3.9. Model validation
The validity of the fitted models was checked using graphical methods (Harrell, Citation2015). For all models considered, it appears that the assumptions needed for fitting the models are not violated. For instance, the plot of residuals versus fitted values, MS and SC presented in (a–c) for the model that considers firmness as the response variable. As can be seen from , the assumption of constant variance is not violated and implies the fitted model is valid. The residual population is distributed around 0–x axis, which is usually the sign of the fact that the model assumptions are met. Moreover, the residuals are homogeneously distributed with respect of the covariates in the model. The normal probability plot of residuals was also used to check the assumption of normality. The assumption normality is plausible. For other models, also none of the graphs indicates any violation of the underlying assumptions.
Figure 2. (a) Residuals plotted versus fitted values, (b) residuals plotted versus maturity stage and (c) residuals plotted versus storage condition.
Figura 2. (a) Residuales graficados contra valores ajustados; (b) Residuales graficados contra etapa de madurez; y (c) Residuales graficados contra condición de almacenamiento.
3.10. Fractional and polynomial model
In the application of ANCOVA model, it was found that there is no significant effect of storage period on TSS content of tomatoes and pH values. Even when DOS has a significant (p ≤ 0.05) effect, the value of multiple ranges from 0.4 to 0.69. These suggest that the relationship between DOS and the tomato quality attributes may be not linear and this implies that it could be curvilinear. Based on this analysis, fractional polynomial model analysis was performed.
The fractional and polynomial models were used to investigate the non-linear relationship. Accordingly, TSS and pH were not found to have a significant (p > 0.05) relationship with DOS. This proves that the result obtained using ANCOVA model which can explain that both pH and TSS were not changed through the storage period. The other quality measures (TA, hue angle, firmness and TSS:TA ration) appear to have a curvilinear relationship with DOS (Equations 6–8). The results of fractional and polynomial models for these quality measures are given below.
The plots of the fitted fractional polynomial models for the response variables of the individual tomato quality indices (TA, hue angle and firmness) are presented in . The findings of this analysis showed that the relationship between the quality measures and DOS is not strictly linear. The relationship is rather curvilinear. The non-linearity relationship might be due to the combination effects of the MS, Tr and SC. The TA model showed a slow decline throughout the storage period, which indicates that the acidity level is reducing during DOS and the model fit with the R2 value of 0.998 ().
Figure 3. Factorial polynomial models predicted and experimental data fitted for the non-linearly related tomato quality indices with respect to days of storage (DOS): TA versus DOS (a), hue angle versus DOS (b) and firmness versus DOS (c).
Figura 3. Modelos polinomiales factoriales pronosticados y datos experimentales ajustados para los índices de calidad del tomate relacionados de manera no lineal con respecto a DOS: TA vs DOS (a), ángulo de tono vs. DOS (b) y firmeza vs. DOS (c).
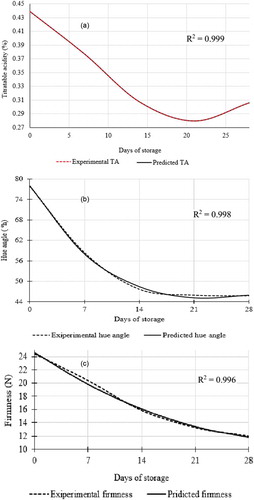
The fractional polynomial model for the hue angle with fit R2 value of 0.999 (). The plot showed a steep decline during the first week and slow decrease thereafter indicates that the hue angle level has decreased during DOS. The result is similar to the findings of by Khairi, Falah, Suyantohadi, Takahashi and Nishina (Citation2015) that has shown a decrease in the hue angle during storage period. The result might be caused by breakdown of the tomato fruit cell wall and the lycopene development was intensified during storage (Khairi et al., Citation2015). The result can help to study the tomato colour kinetics affected by storage period.
The polynomial model was fitted for the firmness of tomato samples with the goodness of fit R2 value of 0.996 (). The plot showed a steep decline during the storage period. A decrease in the firmness during storage period, which caused by breakdown of the tomato fruit cell structure (Schouten et al., Citation2007). Oliveira, Corrêa, Botelho and Oliveira (Citation2015) reported that the firmness of tomato fruit can vary from 34.68 to 21.24 N, while the result from this paper shows which was between 45 and 10 N during storage time. The decrease of tomato firmness during storage period was reported by several researchers (Oliveira et al., Citation2015; Schouten et al., Citation2014, Citation2007). The result of this paper can help to study the structural hardness of tomato fruit during the storage period.
Overall, the fractional polynomial models predicted well the changes in TA and hue angle (colour of tomatoes), while polynomial model was found to be the best equation that described well the firmness of tomatoes during the storage period (). The tomato quality data calculated using the fractional polynomial models and the corresponding experimental tomato quality values are presented in . This study, therefore, demonstrated that the developed models (Equations 6 and 8) can be used to predict the changes in the selected tomato quality attributes during storage period by destructive approach () or by non-destructive approach (). In general, the TA of tomatoes was found to be the best tomato quality change indicator during storage under evaporative cooling and ambient storage environments, which was followed by the tomato hue angle and firmness.
Table 5. The predicted and experimental data of the fractional polynomial model for the non-linear responsive variables of tomato sample.
Tabla 5. Datos pronosticados y experimentales del modelo polinomial fraccional para las variables respuesta no lineales de la muestra de tomate.
4. Conclusions and recommendations
The purpose of this study was to investigate and model the effects of MS, pre-storage treatments and cold storage treatments on tomato quality during the storage period. Different modelling and model screening steps were applied. The multivariate (PCs) analysis was one of the methods employed. The multivariate statistical analysis applied in order to consider the simultaneous observation and analysis of more than one outcome variable. Interaction effect indicates that the relative importance of the independent variables on the fruit quality during the storage period. Accordingly, the MS (i.e. mature green, pink and red), SC (i.e. evaporative cooler store and ambient environment) and Tr (disinfection treatments) (i.e. control treatment, anolyte water dipping, hot water dipping and chlorinated water dipping) were the most important factors that affected the tomato quality during storage period inside EC and ambient conditions. The combinations of MS, SC and Tr treatments had positive significant (p < 0.05) influence on the changes in the quality of sample tomato fruit during the storage period. In conclusion, integrating postharvest treatments such as chlorinated water, anolyte water dipping, evaporative cooling SC and harvesting at green or pink MS are recommended to maintain the quality of tomatoes during storage and thereby to extend their shelf-life. Among the fractional and polynomial models developed, the models for TA were found to be the best fit to the experimental quality data. The model developed using hue angle and firmness experimental data also predicted the quality of tomatoes during storage periods well. The models are recommended for use by tomato postharvest handlers to predict changes in these quality attributes during storage of tomatoes subjected to pre-storage disinfection treatments and stored under EC and ambient storage.
Acknowledgements
We would like to warmly acknowledge the Federal Ministry of Education of Ethiopia, National Research Foundation (NRF – TWAS); Tomato Producer Organization (TPO); Postharvest Innovation Program (PHI) for prevision of financial support; ZZ2 Tomato Farm for the prevision of the required sample tomatoes and the host institute, University of Kwa-Zulu Natal.
Disclosure statement
No potential conflict of interest was reported by the authors.
Additional information
Funding
References
- Abbott, J. A. (1999). Quality measurement of fruits and vegetables. Postharvest Biology and Technology, 15(3), 207–225. doi:10.1016/S0925-5214(98)00086-6
- Abdi, H., & Williams, L. J. (2010). Principal component analysis. Wiley Interdisciplinary Reviews: Computational Statistics, 2(4), 433–459. doi:10.1002/wics.v2:4
- Alimi, B. A., Melesse, S. F., & Workneh, T. S. (2016). Multifactorial analysis of the effects of pre and postharvest treatments on the quality of stored tomato. CyTA-Journal of Food, 14(2), 206–212. doi:10.1080/19476337.2015.1082151
- Alimi, B. A., Shittu, T. A., & Sanni, L. O. (2014). Effect of hydrocolloids and egg content on sensory quality of coated fried yam chips. Journal of Culinary Science & Technology, 12(2), 168–180. doi:10.1080/15428052.2014.880097
- Alonso-Gutierrez, J., Kim, E. M., Batth, T. S., Cho, N., Hu, Q., Chan, L. J. G., … Lee, T. S. (2015). Principal component analysis of proteomics (PCAP) as a tool to direct metabolic engineering. Metabolic Engineering, 28, 123–133. doi:10.1016/j.ymben.2014.11.011
- Ambler, G., & Royston, P. (2001). Fractional polynomial model selection procedures: Investigation of Type I error rate. Journal of Statistical Computation and Simulation, 69(1), 89–108. doi:10.1080/00949650108812083
- AOAC. (1995). Official Methods of Analysis: Association of Official Analytical Chemists. In Standard compendium of laboratory methods for analyzing foods and related substances; AOAC, Gaithersburg, MD. Virginia, USA: Author.
- Batu, A. (2004). Determination of acceptable firmness and colour values of tomatoes. Journal of Food Engineering, 61(3), 471–475. doi:10.1016/S0260-8774(03)00141-9
- Binder, H., Sauerbrei, W., & Royston, P. (2013). Comparison between splines and fractional polynomials for multivariable model building with continuous covariates: A simulation study with continuous response. Statistics in Medicine, 32(13), 2262–2277. doi:10.1002/sim.v32.13
- David, C. C., & Jacobs, D. J. (2014). Principal component analysis: A method for determining the essential dynamics of proteins. In R. L. Dennis (Ed.), Protein dynamics: Methods and protocols (pp. 193–226). Totowa, NJ: Humana Press.
- Egbewale, B. E., Lewis, M., & Sim, J. (2014). Bias, precision and statistical power of analysis of covariance in the analysis of randomized trials with baseline imbalance: A simulation study. BMC Medical Research Methodology, 14(1), 49. doi:10.1186/1471-2288-14-49
- García-García, I., Taboada-Rodríguez, A., López-Gomez, A., & Marín-Iniesta, F. (2013). Active packaging of cardboard to extend the shelf life of tomatoes. Food and Bioprocess Technology, 6(3), 754–761. doi:10.1007/s11947-011-0759-4
- Gharezi, M., Joshi, N., & Sadeghian, E. (2012). Effect of post harvest treatment on stored cherry tomatoes. Journal Nutritional Food Sciences, 2(8). doi:10.4172/2155-9600.1000157
- Harrell, F. E. (2015). Regression modeling strategies: With applications to linear models, logistic and ordinal regression, and survival analysis. Switzerland: Springer publishing international,.
- Huitema, B. (2011). The analysis of covariance and alternatives: Statistical methods for experiments, quasi-experiments, and single-case studies (Vol. 608). Hoboken, NJ: John Wiley & Sons.
- Iezzoni, A. F., & Pritts, M. P. (1991). Applications of principal component analysis to horticultural research. HortScience, 26(4), 334–338.
- Itoh, K. (2003). Combined effects of hot water treatment (HWT) and modified atmosphere packaging (MAP) on quality of tomatoes. Packaging Technology and Science, 16(4), 171–178. doi:10.1002/pts.626
- Jolliffe, I. T., & Cadima, J. (2016). Principal component analysis: A review and recent developments. Philosophical Transactions of the Royal Society A, 374(2065), 20150202. doi:10.1098/rsta.2015.0202
- Kader, A. A. (1986). Effects of postharvest handling procedures on tomato quality. Paper presented at the Acta Hortic., Belgium, Leuven, 190: 209–222.
- Khairi, A. N., Falah, M. A. F., Suyantohadi, A., Takahashi, N., & Nishina, H. (2015). Effect of storage temperatures on color of tomato fruit (Solanum Lycopersicum Mill.) Cultivated under moderate water stress treatment. Agriculture and Agricultural Science Procedia, 3, 178–183. doi:10.1016/j.aaspro.2015.01.035
- Long, J., & Ryoo, J. (2010). Using fractional polynomials to model non‐linear trends in longitudinal data. British Journal of Mathematical and Statistical Psychology, 63(1), 177–203. doi:10.1348/000711009X431509
- López, C. A. F., & Gómez, P. A. (2004). Comparison of color indexes for tomato ripening. Horticultura Brasileira, 22(3), 534–537. doi:10.1590/S0102-05362004000300006
- Martens, H., & Martens, M. (2001). Multivariate analysis of quality an introduction. Chichester, UK: John Wiley & Sons.
- Melesse, S. F., & Zewotir, T. (2017). Variation in growth potential between hybrid clones of Eucalyptus trees in eastern South Africa. Journal of Forestry Research, 28(6), 1157–1167.
- Moneruzzaman, K. M., Hossain, A. B. M. S., Sani, W., & Saifuddin, M. (2008). Effect of stages of maturity and ripening conditions on the biochemical characteristics of tomato. American Journal of Biochemistry and Biotechnology, 4(4), 329–335. doi:10.3844/ajbbsp.2008.329.335
- Oliveira, G. H. H., Corrêa, P. C., Botelho, F. M., & Oliveira, A. P. L. R. (2015). Mechanical properties of tomatoes subjected to an induced compression during storage. Journal of Texture Studies, 46(4), 293–301. doi:10.1111/jtxs.12129
- Pinheiro, J., Alegria, C., Abreu, M., Gonçalves, E. M., & Silva, C. L. M. (2013). Kinetics of changes in the physical quality parameters of fresh tomato fruits (Solanum lycopersicum, cv. ‘Zinac’) during storage. Journal of Food Engineering, 114(3), 338–345. doi:10.1016/j.jfoodeng.2012.08.024
- Pinheiro, J. C., Alegria, C. S. M., Abreu, M. M. M. N., Gonçalves, E. M., & Silva, C. L. M. (2016). Evaluation of alternative preservation treatments (Water heat treatment, ultrasounds, thermosonication and UV-C radiation) to improve safety and quality of whole tomato. Food and Bioprocess Technology, 9(6), 924–935. doi:10.1007/s11947-016-1679-0
- Rencher, A. C. (2003). Methods of multivariate analysis (2nd ed.). USA: John Wiley & Sons.
- Richardson, J. T. E. (2011). Eta squared and partial eta squared as measures of effect size in educational research. Educational Research Review, 6(2), 135–147. doi:10.1016/j.edurev.2010.12.001
- Royston, P., & Altman, D. G. (1994). Regression using fractional polynomials of continuous covariates: Parsimonious parametric modelling. Applied Statistics, 43, 429–467. doi:10.2307/2986270
- Royston, P., Ambler, G., & Sauerbrei, W. (1999). The use of fractional polynomials to model continuous risk variables in epidemiology. International Journal of Epidemiology, 28(5), 964–974. doi:10.1093/ije/28.5.964
- Royston, P., & Sauerbrei, W. (2003). Stability of multivariable fractional polynomial models with selection of variables and transformations: A bootstrap investigation. Statistics in Medicine, 22(4), 639–659. doi:10.1002/(ISSN)1097-0258
- Schouten, R. E., Farneti, B., Tijskens, L. M. M., Alarcón, A. A., & Woltering, E. J. (2014). Quantifying lycopene synthesis and chlorophyll breakdown in tomato fruit using remittance VIS spectroscopy. Postharvest Biology and Technology, 96, 53–63. doi:10.1016/j.postharvbio.2014.05.007
- Schouten, R. E., Huijben, T. P. M., Tijskens, L. M. M., & van Kooten, O. (2007). Modelling quality attributes of truss tomatoes: Linking colour and firmness maturity. Postharvest Biology and Technology, 45(3), 298–306. doi:10.1016/j.postharvbio.2007.03.011
- Shittu, T. A., Sanni, L. O., Awonorin, S. O., Maziya-Dixon, B., & Dixon, A. (2007). Use of multivariate techniques in studying the flour making properties of some CMD resistant cassava clones. Food Chemistry, 101(4), 1606–1615. doi:10.1016/j.foodchem.2006.04.017
- Shlens, J. (2014). A tutorial on principal component analysis. Cornel University Library. Retrieved on April 2017
- Sobratee, N., & Workneh, T. S. (2015). Evaluation of chemical, biochemical and microbiological quality in tomato using multivariate analysis. International Journal of Food Engineering, 11(2), 173–184.
- Var, I. (1998). Multivariate data analysis. Vectors, 8(2), 125–136.
- Workneh, T. S., Osthoff, G., Pretorius, J., & Hugo, C. (2003). Comparison of anolyte and chlorinated water as a disinfecting dipping treatment for stored carrots. Journal of Food Quality, 26(6), 463–474. doi:10.1111/jfq.2003.26.issue-6
- Workneh, T. S., Osthoff, G., & Steyn, M. (2012). Effects of preharvest treatment, disinfections, packaging and storage environment on quality of tomato. Journal of Food Science and Technology, 49(6), 685–694. doi:10.1007/s13197-011-0391-3
- Workneh, T. S., Osthoff, G., & Steyn, M. S. (2011). Influence of preharvest and postharvest treatments on stored tomato quality. African Journal of Agricultural Research, 6(12), 2725–2736.