
ABSTRACT
The thermogravimetry (TGA) and derivative thermogravimetry (DTG) methods have been used to measure the free water in low-moisture foods. In this study, the 2nd derivative thermogravimetry (2nd DTG) method distinguished the free and bound water based on the speed of moisture evaporation, which could be used for both low-moisture and high-moisture foods. First, the key factors related to moisture evaporation were optimized. Isothermal temperature of 30 ~ 50°C, dynamic temperature of 0.033 ~ 0.133°C/min, and flow rate of nitrogen of 20 ~ 40 mL/min were the optimal parameters for the 2nd DTG method. Under these conditions, the repeatability and reproducibility of the 2nd DTG method were enhanced, its applicability was expanded to high-moisture foods, and the accuracy was ± 4.0% of the nuclear magnetic resonance results. Hence, the 2nd DTG method is better suited for the measurement of free water in foods.
RESUMEN
Los métodos de termogravimetría y termogravimetría derivada han sido utilizados para medir el agua libre en alimentos con poca humedad. En el presente estudio, mediante el uso del método de termogravimetría en segunda derivada se pudo distinguir el agua libre del agua ligada midiendo la velocidad de evaporación de la humedad; dicho método puede utilizarse tanto en el caso de alimentos con baja humedad como con alta humedad. Como primer paso se optimizaron los factores vinculados a la evaporación de humedad. Los parámetros óptimos para la aplicación de la técnica de termogravimetría de segunda derivada son: temperatura isotermal de 30~50°C, temperatura dinámica de 0.033~0.133°C/min y tasa de flujo de nitrógeno de 20~40 mL/min. Bajo estas condiciones se potenciaron la repetibilidad y la reproducibilidad del método de termogravimetría de segunda derivada, lo que extendió su aplicabilidad a alimentos con alta humedad. Además, la precisión obtenida fue ± 4.0% de los resultados obtenidos en la resonancia magnética nuclear. En consecuencia, la técnica de termogravimetría de segunda derivada resulta más adecuada para medir el agua libre en alimentos.
1. Introduction
Water is investigated widely due to its impact on ultimate food quality (De Angelis Curtis et al., Citation2000; Pearce, Rosenvold, Andersen, & Hopkins, Citation2011; Wang & Liapis, Citation2012). Most studies categorize water as either bound water or free water (Haranczyk, Grandjean, & Olech, Citation2003; Hatakeyama, Tanaka, Kishi, & Hatakeyama, Citation2011; Le Botlan, Rugraff, Martin, & Colonna, Citation1998; Nakamura, Hatakeyama, & Hatakeyama, Citation1981; Roozendaal, Abu-Hardan, & Frazier, Citation2012). Bound water has low mobility due to interactions with free water, proteins, sugars, salts etc., whereas the free water has high mobility (Finch & Schneider, Citation1975; Wang & Liapis, Citation2012).Thermogravimetry (TGA) has been used to measure the free water content of cheese (De Angelis Curtis et al., Citation2000; García, Bartolomé, & Alvarez, Citation1993; Le Dean, Mariette, Lucas, & Marin, Citation2001; McMahon, Fife, & Oberg, Citation1999), wheat bran, soy bread (Roozendaal et al., Citation2012), and dough (Fessas & Schiraldi, Citation2001). TGA distinguishes water fractions based on that free water is easier to evaporate than bound water (Fessas & Schiraldi, Citation2001). Hence, for the TGA method, it is key to determine the time point at which all free water has evaporated. Two methods have been used for this purpose. (1) The TGA method: the TGA profile usually presents a significant turning during the thermal program. The intersection point of the tangents before and after the significant turning is designated as the time point of interest (Fessas & Schiraldi, Citation2001; Saldo, Sendra, & Guamis, Citation2002). Additionally, the TGA profile was further deconvoluted as the free water peak and bound water peak for a better result. (2) The derivative thermogravimetry (DTG) method: the DTG profile usually presents a turning when the evaporation of the free water is finished. The intersection point of the tangents before and after the turning denotes the time point of interest (Fessas & Schiraldi, Citation2001; Lodi & Vodovotz, Citation2008). Interestingly, both methods measure the free water based on the calculation of the intersection point. As a result, the measurement is highly influenced by subjective factors. Even a tiny movement of the point of tangency on the TGA or DTG profile would lead to a significant migration of the intersection point. Moreover, high-moisture foods mainly consist of free water. When analyzing the water content of these foods, the evaporation of the free water dominates the TGA profile, thereby covering the evaporation of the bound water. The point of tangency after the turning is difficult to locate. Hence, the current TGA and DTG methods are not capable of accurately measuring the water content of high-moisture foods.
In this paper, the 2nd derivative thermogravimetry (2nd DTG) method was established to enhance the repeatability and reproducibility of water measurements, as well as to expand the applicability in foods. Firstly, the key parameters that relate to moisture evaporation were optimized. Subsequently, the optimal parameters were used to measure the free water ratio of some common foods. Finally, the repeatability, reproducibility, accuracy, applicability, and calculation of the 2nd DTG method were compared to those of the TGA and DTG methods.
2. Experimental
2.1. Materials and sampling
The carrot, green pepper, cabbage, purple sweet potato, and abalone mushrooms were purchased from a local vegetable market. The other foods were purchased from a local supermarket. The sausage was ‘King of King Sausage’ (Shuanghui Group, produced in December 17 2014). The ham was ‘Shineway Ham’ (Shuanghui Group, produced in November 14 2014). The dried beef was ‘Laosichuan Spiced Dried Beef’ (Chongqing Golden Star Co. Ltd., produced November 10 2014). The dried meat floss was ‘Pork floss – Original Flavor’ (Beingmate Children Food Co. Ltd., Hanghzou, China, produced in November 10 2014). The marshmallow was ‘Oishi Marshmallow – Strawberry Flavor’ (Oishi Food Co. Ltd., Shanghai, China, produced November 8 2014).
In order to ensure the uniformity of the sample, only the flesh of the carrot, green pepper, purple sweet potato, the flat leaf of the cabbage, and the stem of the abalone mushroom were sampled for the measurements. The sausage, ham, beef, meat floss, and marshmallow were randomly sampling.
2.2. TGA analysis
The sample was cut into thin, slim, and uniform strip (15 ~ 30 mg), which was then quickly placed into a ceramic crucible. The crucible was immediately transferred to a preheated test plate, and heated by a dynamic/isothermal program (TGA/DSC 1, Mettler Toledo, Schwarzenbach, Switzerland). The results were recorded and calculated by Stare Software V9.30.
The effect of the isothermal temperature, dynamic temperature, and flow rate of nitrogen on the free water ratio of the sausage was evaluated. Specifically, an isothermal temperature of 20, 30, 40, and 50°C was applied to the sample for 200 min with a flow rate of nitrogen of 20 mL/min; a dynamic temperature of 0.033, 0.067, 0.100, and 0.133°C/min was applied to the sample from 20°C for 200 min with a flow rate of nitrogen of 20 mL/min; a flow rate of nitrogen of 10, 20, 30, and 40 mL/min was applied to the sample at an isothermal temperature of 30°C, for 200 min.
2.3. Nuclear magnetic resonance (NMR) analysis
The relaxivity of the sample was measured by low-field NMR (NMI-20 Analyst Analyzing & Imaging system, Shanghai Niumag Corp., China), following a recent method (Han, Zhang, Fei, Xu, & Zhou, Citation2008). Specifically, 1.0 g of sample was placed into a 15 mm glass tube and inserted in the NMR probe. The transverse relaxation time (T2) and the percentage of the water fraction were measured by the Carr–Purcell–Meiboom–Gill pulse sequence. This sequence consists of a 90° pulse, followed by a train of 180° pulses to refocus the NMR signal, with a pulse spacing of 50 μs. The parameters were as follows: SF = 18.398 MHz, P90 = 8 μs, P180 = 15 μs, TD = 249,502, SW = 100 KHz, TW = 500 ms, RG1 = 20, RG2 = 3, NS = 8, NECH = 5000, and TE = 0.5 ms. The curves are the average of eight scans. The relaxation curves were further analyzed for the free water ratio.
2.4. Calculation of the free water ratio
A sausage sample of 20 ~ 30 mg was isothermally heated at 40°C, for 200 min, with a flow rate of nitrogen of 20 mL/min. The moisture content of the sausage was measured by heating the sample at 105°C until its weight reached a plateau. The moisture content was the percentage of the difference between the original mass and the constant mass. The free water ratio was the percentage of the free water content in the total moisture content.
When using the TGA method, the free water content was the weight loss before the intersection point in the TGA profile. For the DTG method, the free water content was the weight loss before the intersection point in the DTG profile. For the 2nd DTG method, the free water content was the weight loss before the inflexion point in the generated profile.
Using the NMR method, three peaks were observed in the NMR profile, which were designated as T21, T22, and T23, respectively. T21 refers to the transverse relaxation time of bound water; T22 and T23 refer to the transverse relaxation time of free water (Shao & Li, Citation2009). The areas between the baseline and T21, T22, and T23 were nominated as AT21, AT22, and AT23, respectively. AT21 and the sum of AT22 and AT23 represent the content of bound water and free water, respectively. Consequently, the free water ratio was the percentage of the sum of AT22 and AT23 in the sum of AT21, AT22 and AT23 (Han et al., Citation2008; Shao & Li, Citation2009).
2.5. Repeatability, reproducibility, accuracy, and applicability of the 2nd DTG method
To determine the repeatability of each method, six different strips of the same sausage were evaluated at an interval of 1 h, by the same thermal program.
The reproducibility of each method was evaluated by assessing six different strips of the same sausage on different days, by the same thermal program.
The applicability of each method was evaluated by measuring the free water ratio of some common foods, such as tap water, carrots, green peppers, cabbages, abalone mushrooms, sweet potatoes, sausages, ham, dried beef, marshmallows, and dried meat floss.
The accuracy of the method was validated by the results of the NMR. Each sample was cut into two portions for the TGA and NMR methods, respectively. The deviation rate between the TGA, DTG, or 2nd DTG results and the NMR result was used to express the accuracy of each method.
The thermal program of the repeatability, reproducibility, accuracy, and applicability experiments was as follows: the thin, slim, and uniform sausage samples of 20 ~ 30 mg were isothermally heated at 40°C, for 200 min, with a flow rate of nitrogen of 20 mL/min.
2.6. Statistical analysis
The experiment was repeated for three times. The results were expressed as the average ± standard deviation (SD, n ≥ 3). The relative SD (RSD) was the ratio of the SD to the mean. Analysis of variance was used to compare mean differences of the results. If the differences in mean existed, multiple comparisons were performed using Duncan’s Multiple Range Test. All analysis was conducted using SPSS for Window Version 19.
3. Results and discussion
3.1. Secondary DTG method
The 2nd DTG method distinguished the water fractions based on the speed of moisture evaporation. In order to enlarge the tiny variation in the evaporation speed, the 2nd DTG method had to accord with two premises. (1) Moisture evaporation accounted for the whole weight loss of the sample. (2) The micro-path of moisture evaporation was not blocked. Under these premises, the ideal TGA, DTG, and 2nd DTG profiles are listed in , respectively. Specifically, the ideal TGA, DTG, and 2nd DTG profiles were a turning line, a stepped line, and a jumping line, respectively. The weight loss before the turning point, stepped point, and jumping point represents the free water content.
Figure 1. Ideal TGA profiles of the TGA method (a), DTG method (b) 2nd DTG method (c); Typical TGA profiles of the TGA method (d), DTG method (e) 2nd DTG method (f), and NMR method (g).
Figura 1. Perfiles de TGA ideales para el método TGA (a), método DTG (b) método de TG de segunda derivada (c); perfiles de TGA típicos del método TGA (d), método DTG (e) método TG de segunda derivada (f) y método NMR (g).
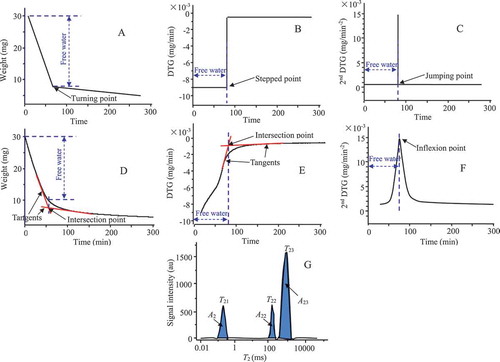
The typical TGA profile and the corresponding DTG and 2nd DTG profiles were different from their ideal counterpart. The TGA profile presented a smooth turning. The intersection point was assigned to the turning point, which was located by the tangents before and after the turning. Consequently, the weight loss before the intersection point represented the free water content of the sample (). The DTG profile showed only a half-step due to a decrease in evaporation speed of the free water. Specifically, the DTG was the 1st derivative, with every 50 points of the TGA profile as intervals. The intersection point was assigned to the stepped point, which was located by the tangents before and after the turning. The weight loss before the intersection point represented the free water content (). The 2nd DTG profile presented a significant peak, which was the 2nd derivative with intervals of 50 points of the TGA profile. The inflexion point of the peak was assigned to the jumping point, which represented the end of the free water evaporation, as well as the onset of the bound water evaporation. The weight loss before the inflexion point represented the free water content in the 2nd DTG profile (). Hence, for the 2nd DTG method, it was easy to locate the time point of interest.
Remarkably, each typical profile was different to their ideal counterpart. This may be because it was difficult for the actual food to accord with the two premises. (1) Moisture evaporation had a very low chance of reflecting the whole weight loss. During a thermal program, the volatilization of the volatile compounds, oxidation of the ingredients, and decomposition of compounds all lead to variations in weight (Hemvichian & Ishida, Citation2002; Hirata, Kashiwagi, & Brown, Citation1985). (2) The speed of moisture evaporation was not only controlled by the interactions of moisture with proteins, sugars, and salts, but also by the cell wall, protein matrix, and gel network. Each of these factors blocks moisture evaporation and lower its mobility (Andres, Bilbao, & Fito, Citation2004; Machida, Nakahara, Yoshikawa, Shibasaki, & Fukuda, Citation1998; Meidner, Citation1975). To follow the two premises, a low drying temperature and nitrogen circulation were used to reduce the weight variations from volatilization, oxidation, and decomposition. Meanwhile, slim, thin, uniform, and well nitrogen-circulated samples were used, to enhance the mobility of the moisture.
3.2. Effects of the dynamic/isothermal temperature and flow rate of nitrogen on free water ratio
The 2nd DTG profile was the key to define the boundary between free water and bound water. Consequently, any factors that affect the 2nd DTG profile would affect the free water ratio. The thermal program and flow rate of nitrogen were selected as key factors of the 2nd DTG method.
The effect of the isothermal temperature on the TGA profile, 2nd DTG profile and free water ratio of the sausage is showed . The TGA profile decreased smoothly, and held constantly. The weight loss speed of the sausage was enhanced when the isothermal temperature was increased, as the higher temperature accelerated the evaporation speed of the moisture. The 2nd DTG profiles presented a significant peak during the isothermal program. The significant peak presented early when the isothermal temperature was enhanced due to the higher evaporation speed. Remarkably, the free water ratios determined at 30, 40, and 50°C were statistically similar, while that determined at 20°C was significant lower than those at the other temperatures. The total moisture content of the sausage was 54.8 ± 1.7%. The total weight loss of the sausage was 44.6% when being heated at 20°C, and 52.1–53.2% at 30 ~ 50°C. This phenomenon proves that part of the moisture was not evaporated from the sausage when being isothermally heated at 20°C. Consequently, an isothermal temperature of 30 ~ 50°C guaranteed the repeatability of the 2nd DTG method. In contrast to our results, free water is released over the temperature of 30°C or 90 ~ 110°C, while bound water is released over the temperature range 110 ~ 200°C (De Angelis Curtis et al., Citation2000; Saldo et al., Citation2002). Our results proved that almost all the water in the sausage was released when being isothermally heated at 30 ~ 50°C. Another proof was that the total moisture content of most foods is usually measured by heating at 105°C, rather than at 110 ~ 200°C. Moreover, foods are usually a complex of water, proteins, starch and lipids. Heating at 90 ~ 110°C or higher temperatures would lead to a series reaction rather than the evaporation of moisture. Furthermore, the free water ratio was not temperature dependent at an isothermal temperature of 30 ~ 50°C. Hence, an isothermal temperature of 30 ~ 50°C helped fulfill the two premises of the 2nd DTG method.
Figure 2. Effect of the isothermal temperature on the TGA (a), 2nd DTG (b), and free water ratio (c) of the sausage with a flow rate of nitrogen of 20 mL/min for 200 min; effect of the dynamic temperature on the TGA (d), 2nd DTG (e), and free water ratio (f) of the sausage from 20°C for 200 min with a flow rate of nitrogen of 20 mL/min; effect of the gas speed on the TGA (g), 2nd DTG (h), and free water ratio (i) of the sausage with an isothermal temperature of 30°C for 200 min.
Figura 2. Efecto de la temperatura isotermal en la TGA (a), TG de segunda derivada (b) y la ratio de agua libre (c) de la salchicha con una tasa de flujo de nitrógeno de 20 mL/min durante 200 min; efecto de la temperatura dinámica de la TGA (d), de la TG de segunda derivada (e) y la ratio de agua libre (f) de la salchicha a 20°C durante 200 min, con una tasa de flujo de nitrógeno de 20 mL/min; efecto de la velocidad del gas en la TGA (g), TG de segunda derivada (h) y ratio de agua libre (i) en la salchicha con una temperatura isotermal de 30°C durante 200 min.
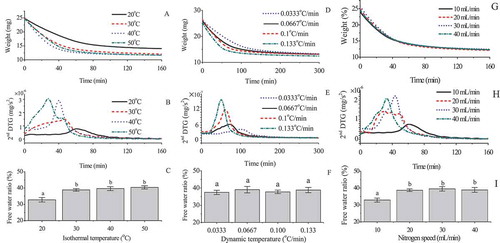
The effects of the dynamic temperature on the TGA, 2nd DTG and free water ratio of the sausage are shown in . The evaporation speed of moisture increased with the increase in dynamic temperature. Meanwhile, the inflexion point of the 2nd DTG profile presented early when the dynamic temperature was enhanced. This phenomenon proves that the free water evaporated easily when the temperature was increased. The free water ratio was not affected by the dynamic temperature from 0.033°C/min to 0.133°C/min. Remarkably, a dynamic temperature of 5°C/min can help distinguish between the free water and bound water of dough and cheese (De Angelis Curtis et al., Citation2000; Saldo et al., Citation2002), while a temperature of 1°C/min cannot (García et al., Citation1993). Our results prove that the coordination of the dynamic temperature and proper temperature range was the key to distinguish between moisture fractions.
Nitrogen is applied to lower the surrounding humidity, as well as to reduce the occurrence of chemical reactions (Jackson & Rager, Citation2001). However, excessive nitrogen could lead to abnormal evaporation. Consequently, the effect of the flow rate of nitrogen on the TGA, 2nd DTG and free water ratio of the sausage was evaluated (). The free water ratios dried at 20, 30 and 40 mL/min were statistically similar, while that dried at 10 mL/min was significant lower than those dried at the other flow rates. Therefore, a flow rate of nitrogen of 20 ~ 40 mL/min was better suited to the 2nd DTG method.
3.3. Comparison of the 2nd DTG method with the TGA and DTG methods
The repeatability, reproducibility, accuracy, applicability, and calculation of the 2nd DTG method were compared with those of the TGA and DTG methods (). Specifically, the sausage was used to evaluate the repeatability, reproducibility, and accuracy of each method. The RSD of the repeatability and reproducibility of the 2nd DTG method was 0.936% and 1.43%, respectively, which was significantly lower than the values obtained for the TGA and DTG methods.
Table 1. Comparison of the 2nd DTG method with the TGA and NMR methods.
Tabla 1. Comparación del método de TG de segunda derivada con los métodos TGA y NMR.
NMR measures the free water ratio based on the transverse relaxation time of molecular moisture. The transverse relaxation time of bound water is usually significantly lower than that of free water (Haranczyk et al., Citation2003; Le Botlan et al., Citation1998). Consequently, moisture that presented a lower transverse relaxation time was defined as bound water, and the remaining moisture was the free water. The boundary between bound water and free water was clear and easy to determine. Hence, the accuracy of each method was measured with the NMR results as the standard. The deviation rate of the 2nd DTG method was ± 4.0% when the free water ratio of the sample was either 15–50% or 15–75%, while the deviation rate of the TGA and DTG methods was ± 18% and ± 14%, respectively, when the free water ratio was 15–50%. The difference between the TGA, DTG, and 2nd DTG results and the NMR result mainly resulted from the different measurement mechanisms. The TGA, DTG, and 2nd DTG methods distinguish between free water and bound water by the speed of the moisture evaporation, while the NMR method distinguishes by the transverse relaxation time. Moreover, the speed of moisture evaporation was continuous. Consequently, the definition of the boundary was the key factor affecting the free water ratio. The difference between the TGA and DTG results and the 2nd DTG results resulted from the different definition of the boundary. The 2nd DTG method defined the inflexion point as the boundary between bound water and free water, which was clear and easy to determine. Hence, the accuracy of the 2nd DTG method was significant enhanced.
The applicability of each method was evaluated by measuring the free water ratio of some common foods (), which were selected based on moisture content. The tap water, green pepper, cabbage, carrot, abalone mushrooms and sweet potato were classified as high-moisture foods (Karel & Heidelbaugh, Citation1973), while the sausage, ham, dried beef, marshmallow and dried meat floss were classified as low-moisture foods. The 2nd DTG method was successful in measuring the water content of all samples. The RSD of the 2nd DTG method was < 5.0%, whereas that of the TGA and DTG methods was 2.15–10.2% and 2.11–8.66%, respectively. The RSD of the TGA and DTG methods was only lower than 5% when the moisture content of the samples was lower than 48.9%. These results prove that the 2nd DTG method could be used in both low-moisture and high-moisture foods.
Table 2. Applicability comparison of the 2nd DTG method with the TGA and DTG methods.
Tabla 2. Comparación de la aplicabilidad del método de TG de segunda derivada con los métodos TGA y DTG.
Obviously, the calculation of the 2nd DTG method was easier than that of the TGA and DTG methods, which could contribute to the higher repeatability, reproducibility, and accuracy of the 2nd DTG method.
4. Conclusions
The 2nd DTG method can distinguish between free water and bound water based on the speed of moisture evaporation. Isothermal temperature of 30 ~ 50°C, dynamic temperature of 0.033 ~ 0.133°C/min, and flow rate of nitrogen of 20 ~ 40 mL/min were optimal parameters for the 2nd DTG method. The repeatability and reproducibility of the 2nd DTG method were enhanced and the applicability was expanded to high-moisture foods. The accuracy of the 2nd DTG method was ± 4.0% of the NMR results. Hence, the 2nd DTG method is a better alternative to measure the free water ratio in foods.
Acknowledgments
The authors are grateful to financial support of China Agricultural Research System (CARS-24 & CARS-25), Beijing Natural Science Foundation (6172013) and Beijing Key Laboratory of Fruits and Vegetable Storage and Processing (Z141105004414037).
Disclosure statement
No potential conflict of interest was reported by the authors.
Additional information
Funding
References
- Andres, A., Bilbao, C., & Fito, P. (2004). Drying kinetics of apple cylinders under combined hot air–Microwave dehydration. Journal of Food Engineering, 63, 71–78. doi:10.1016/S0260-8774(03)00284-X
- De Angelis Curtis, S., Curini, R., Delfini, M., Brosio, E., D’Ascenzo, F., & Bocca, B. (2000). Amino acid profile in the ripening of Grana Padano cheese: A NMR study. Food Chemistry, 71, 495–502. doi:10.1016/S0308-8146(00)00192-8
- Fessas, D., & Schiraldi, A. (2001). Water properties in wheat flour dough I: Classical thermogravimetry approach. Food Chemistry, 72, 237–244. doi:10.1016/S0308-8146(00)00220-X
- Finch, E. D., & Schneider, A. S. (1975). Mobility of water bound to biological membranes: A proton NMR relaxation study. Biochimica Et Biophysica Acta (BBA) - Biomembranes, 406, 146–154. doi:10.1016/0005-2736(75)90049-8
- García, R. M., Bartolomé, M. A., & Alvarez, A. E. (1993). Thermogravimetry (TG) applied to the analysis of Cabrales cheese. Thermochimica Acta, 215, 281–289. doi:10.1016/0040-6031(93)80103-H
- Han, M., Zhang, Y., Fei, Y., Xu, X., & Zhou, G. (2008). Effect of microbial transglutaminase on NMR relaxometry and microstructure of pork myofibrillar protein gel. European Food Research and Technology, 228, 665–670. doi:10.1007/s00217-008-0976-x
- Haranczyk, H., Grandjean, J., & Olech, M. (2003). Freezing of water bound in lichen thallus as observed by 1H-NMR. I. Freezing of loosely bound water in Cladonia mitis at different hydration levels. Colloids and Surfaces B: Biointerfaces, 28, 239–249. doi:10.1016/S0927-7765(02)00148-0
- Hatakeyama, T., Tanaka, M., Kishi, A., & Hatakeyama, H. (2011). Comparison of measurement techniques for the identification of bound water restrained by polymers. Thermochimica Acta, 532, 159–163. doi:10.1016/j.tca.2011.01.027
- Hemvichian, K., & Ishida, H. (2002). Thermal decomposition processes in aromatic amine-based polybenzoxazines investigated by TGA and GC-MS. Polymer, 43, 4391–4402. doi:10.1016/S0032-3861(02)00281-1
- Hirata, T., Kashiwagi, T., & Brown, J. E. (1985). Thermal and oxidative degradation of poly (methyl methacrylate): Weight loss. Macromolecules, 18, 1410–1418. doi:10.1021/ma00149a010
- Jackson, R. S., & Rager, A. (2001). The use of reduced pressure to expand the capabilities of TGA-FTIR. Thermochimica Acta, 367–368, 415–424. doi:10.1016/S0040-6031(00)00694-8
- Karel, M., & Heidelbaugh, N. D. (1973). Recent research and development in the field of low‐moisture and intermediate‐moisture foods. Critical Reviews in Food Science & Nutrition, 3, 329–373.
- Le Botlan, D., Rugraff, Y., Martin, C., & Colonna, P. (1998). Quantitative determination of bound water in wheat starch by time domain NMR spectroscopy. Carbohydrate Research, 308, 29–36. doi:10.1016/S0008-6215(98)00068-8
- Le Dean, A., Mariette, F., Lucas, T., & Marin, M. (2001). Assessment of the state of water in reconstituted milk protein dispersions by nuclear magnetic resonance (NMR) and differential scanning calorimetry (DSC). Lwt, 34, 299–305. doi:10.1006/fstl.2001.0765
- Lodi, A., & Vodovotz, Y. (2008). Physical properties and water state changes during storage in soy bread with and without almond. Food Chemistry, 110, 554–561. doi:10.1016/j.foodchem.2008.02.032
- Machida, S., Nakahara, H., Yoshikawa, I., Shibasaki, Y., & Fukuda, K. (1998). Study on microstructures of mixed monolayers of poly (octadecylacrylate) and octadecanol in relation to the retardation of water evaporation. Thin Solid Films, 327, 109–112. doi:10.1016/S0040-6090(98)00604-X
- McMahon, D. J., Fife, R. L., & Oberg, C. J. (1999). Water partitioning in Mozzarella cheese and its relationship to cheese meltability. Journal of Dairy Science, 82, 1361–1369. doi:10.3168/jds.S0022-0302(99)75361-0
- Meidner, H. (1975). Water supply, evaporation, and vapour diffusion in leaves. Journal of Experimental Botany, 26, 666–672. doi:10.1093/jxb/26.5.666
- Nakamura, K., Hatakeyama, T., & Hatakeyama, H. (1981). Studies on bound water of cellulose by differential scanning calorimetry. Textile Research Journal, 51, 607–613. doi:10.1177/004051758105100909
- Pearce, K. L., Rosenvold, K., Andersen, H. J., & Hopkins, D. L. (2011). Water distribution and mobility in meat during the conversion of muscle to meat and ageing and the impacts on fresh meat quality attributes: A review. Meat Science, 89, 111–124. doi:10.1016/j.meatsci.2011.04.007
- Roozendaal, H., Abu-Hardan, M., & Frazier, R. A. (2012). Thermogravimetric analysis of water release from wheat flour and wheat bran suspensions. Journal of Food Engineering, 111, 606–611. doi:10.1016/j.jfoodeng.2012.03.009
- Saldo, J., Sendra, E., & Guamis, B. (2002). Changes in water binding in high-pressure treated cheese, measured by TGA (thermogravimetrical analysis). Innovative Food Science and Emerging Technologies, 3, 203–207. doi:10.1016/S1466-8564(02)00047-4
- Shao, X., & Li, Y. (2009). Effects of blanching on water distribution and water status in sweet corn investigated by using MRI and NMR. Transactions of the Chinese Society of Agricultural Engineering, 25, 302–306.
- Wang, J. C., & Liapis, A. I. (2012). Water-water and water-macromolecule interactions in food dehydration and the effects of the pore structures of food on the energetics of the interactions. Journal of Food Engineering, 110, 514–524. doi:10.1016/j.jfoodeng.2012.01.008