
 ?Mathematical formulae have been encoded as MathML and are displayed in this HTML version using MathJax in order to improve their display. Uncheck the box to turn MathJax off. This feature requires Javascript. Click on a formula to zoom.
ABSTRACT
High fructose (HF) ingestion is a common risk factor for the development of nonalcoholic fatty liver disease (NAFLD), which has become a serious health problem. The underlying mechanism of HF-induced NAFLD needs to be further understood and an effective prevention needs to be established urgently. Gas chromatography-mass spectrometer-based metabonomic method was employed to characterize the serum metabolic profile of HF-induced NAFLD in mice. β-Hydroxybutyric acid, elaidic acid and oleic acid that contributed to energy and lipid metabolism were confirmed as potential biomarkers for HF-induced NAFLD. With these changed metabolic pathways as possible drug targets, different administrations revealed that co-administration of stachyose and tea polyphenols was a more effective method than treatment of stachyose or tea polyphenols alone for preventing HF-induced negative changes of metabolic pathways in mice. These findings suggest that β-hydroxybutyric acid, elaidic acid and oleic acid are potential biomarkers in HF-induced NAFLD, and co-administration is a novel preventive strategy.
RESUMEN
La ingesta elevada de fructosa (HF) constituye un factor de riesgo común en el desarrollo de esteatohepatitis no alcohólica (NAFLD), padecimiento que se ha convertido en un problema de salud serio. El mecanismo subyacente de la NAFLD inducida por HF debe ser mejor comprendido, al tiempo que urge establecer mecanismos de prevención que resulten efectivos. En este sentido, para caracterizar el perfil metabólico del suero de ratones con NAFLD inducida por HF se utilizó el método metabolómico basado en GC-MS. Ello permitió constatar que los ácidos betahidroxibutírico, elaídico y oleico, que contribuyen al metabolismo energético y lipídico, son biomarcadores potenciales para la NAFLD inducida por el HF. A partir de la identificación de estas vías metabólicas alteradas como posibles dianas de los medicamentos, la administración diferenciada de sustancias (combinadas o por separado) reveló que, para prevenir los cambios negativos inducidos por la HF en las vías metabólicas de ratones, la coadministración de estaquiosa y polifenoles de té resultó ser un método más efectivo que el tratamiento con estaquiosa o con polifenoles de té por separado. Estos hallazgos sugieren que los ácidos betahidroxibutírico, elaídico y oleico son biomarcadores potenciales para la NAFLD inducida por HF y que la coadministración constituye una estrategia preventiva innovadora.
1. Introduction
Nonalcoholic fatty liver disease (NAFLD) comprises a wide spectrum of liver diseases that are developed in the absence of significant alcohol consumption or other known causes of steatosis (Spruss & Bergheim, Citation2009). According to the natural course and pathological features, NAFLD consists of four stages: simple steatosis, nonalcoholic steatohepatitis (NASH), fibrosis, and cirrhosis (Chen et al., Citation2017). NASH is the key pathophysiological phase during NAFLD progress, which is complicated with lobular inflammation and fibrosis (Chen et al., Citation2017; Wree, Broderick, Canbay, Hoffman, & Feldstein, Citation2013). It has a much higher risk to develop into cirrhosis and hepatocarcinoma than simple hepatic steatosis (Gregory, Mariana, & Anna, Citation2013). Epidemiology investigations have shown that the consumption of high fructose (HF) corn syrup, which contains 55–90% of fructose, is associated with the occurrence of NAFLD (Nomura & Yamanouchi, Citation2012; Tappy & Lȇ, Citation2010). Our pervious studies also revealed that the mice fed by 30% fructose water for continuous 8 weeks resulted in NAFLD, which was characterized by dyslipidemia, ectopic lipid deposition, insulin resistance, obesity, and liver injury (Li, Huang, Gao, & Yang, Citation2016; Ren, Zhao, Nie, Yang, & Yang, Citation2014). However, the pathological mechanism of HF diet-induced NAFLD is still poorly understood.
Metabolomics, an integral part of the systems biology, is rapidly advancing with the aims of detecting many metabolites with low molecular weight in single cell, bio-fluids, and tissue extracts (Tan et al., Citation2011). Therefore, the application of metabolomics method may contribute to the further understanding of the pathological mechanism of NAFLD. Although some studies have investigated the potential biomarkers of HF-fed rats using a 1H-NMR-based metabolomics approach (Yang et al., Citation2014, Citation2015), these studies neglected a fact that HF-induced liver damage was closely associated with lipid metabolism (Bocarsly, Powell, Avena, & Hoebel, Citation2010). Thus, a typical method that is used to determine the “lipidomic” fraction of the metabolome should be applied to detect the metabolic profiles of HF-induced hepatic injury, such as gas chromatography-mass spectrometer (GC-MS) (Wu et al., Citation2011).
In the present work, a NAFLD model was established by feeding the mice with 30% fructose water in accordance to the previously reported modeling method (Li et al., Citation2016; Ren et al., Citation2014). The metabolites in the serum of the NAFLD model mice were investigated by GC-MS-based metabolomics profiling methods. Moreover, a novel dietary preventive strategy by combining stachyose with tea polyphenols was developed and its mitigatory effects on the metabolic disorders in HF-fed mice were also evaluated.
2. Materials and methods
2.1. Materials and chemicals
Food grade fructose was purchased from Senbo Biology Co., Ltd. (Xi’an, China). The stachyose extract was obtained from soybean residues, and the resulting extract consisted of stachyose (80%), moisture (8%), protein (5%), fat (1%) and ash (6%). The tea polyphenols (purity > 70%) were purchased from the Yongqi Biology Co., Ltd, which were extracted from dry tea leaves of commercial green tea. The composition of the tea polyphenols is epigallocatechin gallate (52.24%), epicatechin gallate (11.74%), epigallocatechin (4.05%), epicatechin (3.11%) and caddeic acid (0.70%), respectively. Methoxyamine hydrochloride, trimethylchlorosilane (TMCS), N,O-bis (trimethylsilyl) trifluoroacetamide and ribitol were purchased from Adamas Reagent, Ltd. (Shanghai, China). Acetonitrile, methanol, heptane and acetone were purchased from Kemiou Chemical Reagent Co., Ltd. (Tianjin, China). β-Hydroxybutyric acid was from Tokyo Chemical Industry (Shanghai, China). Oleic acid and elaidic acid were the products of Aladdin Industrial Inc. (Shanghai, China).
2.2. Animal experiment and sample collection
The animal experiment was designed according to our previous work (Li et al., Citation2016). Forty male Kunming mice weighting 18–22 g were purchased from the Experimental Animal Center of the Fourth Military Medical University, China (Li et al., Citation2016). The mice were maintained in a room with an alternation of 12 h/12 h light/dark cycle at 22°C ± 2°C, and they were allowed free access to top water and standard rodent chow. All procedures in this experiment were approved by the Committee on Care and Use of Laboratory Animals of the Fourth Military Medical University (SYXK-007-2007), and the experimental procedure was carried out according to the Guideline of Experimental Animal Administration published by the State Committee of Science and Technology of People’s Republic of China.
After 7-day adaptation to the laboratory environment, the mice were randomly divided into five groups, and each group included eight mice. Normal group (N): the mice received top water and were administered intragastrically (ig) with saline (0.4 mL) once daily. Model group (M): the mice received 30% fructose water and were administered orally saline (0.4 mL, ig) once daily. Stachyose-treated group (S): the mice received 30% fructose water and were administered orally with stachyose at 400 mg/kg·bw (0.4 mL, ig) once daily. Tea polyphenol-treated group (TP): the mice received 30% fructose water and were ig administered with tea polyphenol at 400 mg/kg·bw (0.4 mL, ig) once daily. In the stachyose and tea polyphenol combined-treated group (STP), the mice received 30% fructose water and were administered orally with 400 mg/kg·bw stachyose and 400 mg/kg·bw tea polyphenol (0.4 mL, ig) once daily. During the experimental period (continuous 56 days), all mice were allowed free access to food and top water or HF water. After the last administration, all the mice were anesthetized with isoflurane after 12 h of fast and then sacrificed. Blood samples were collected and the serum samples were separated by centrifugation at 1500g for 15 min.
2.3. GC-MS fingerprinting analysis of serum
Serum fingerprinting of the mice was determined according to a previously reported method with slight modification (Tan et al., Citation2011). Aliquot of the tested serum (75 μL) was transferred into a tube and spiked with the internal standard (5 μL of 1.0 mg/mL of ribitol), followed by the addition of 400 μL ice-cold extracting solution (methanol:acetonitrile:acetone = 1:1:1). After vigorous shaking for 30 s and ultrasonic processing for 10 min at 4°C, the mixture was centrifuged at 3000g for 15 min to precipitate the protein. The supernatant (300 μL) was vacuum dried at 45°C. Methoxyamine pyridine (75 μL, 15 mg/mL) was added to each tube and vortex-mixed for 5 min, and then methoxymation was carried out at 70°C for 1 h, followed by derivatization of MSTFA (75 μL) with 1% TMCS as catalyst at room temperature for 1 h. n-Heptane (1.0 mL) was added to dilute the solution and 1 μL of supernatant was then used for GC-MS analysis.
The GC oven temperature was initially held at 70°C for 4 min and increased to 110°C at a rate of 4°C/min, and then raised to 180°C at a rate of 5°C/min. After maintaining at 180°C for 3 min, the temperature was elevated to 185°C at a rate of 1°C/min and then increased to 220°C at a rate of 4°C/min and held 2 min, and finally increased to 310°C at a rate of 8°C/min and held for 8 min. The m/z range was set to 60–600 with electron impact ionization (70 eV), and the temperature of the transfer interface and the ion source was set to 260°C and 200°C, respectively.
To validate the stability of GC-MS and analyze serum metabolic profiles, the quality control (QC) sample was prepared by pooling equal volume of serum from each sample (Zeng et al., Citation2014). QC samples were also determined as real samples and then was randomly inserted amongst the real sample queue to be analyzed eight times accordingly (Tan et al., Citation2011).
2.4. Data processing
Original data obtained from GC-MS in .qgd format were converted to .CDF format files. Retention time (RT) correction of peaks was done with the program MetaboNexus (Huang, Toh, Benke, Tan, & Ong, Citation2014). MetaboNexus parameters were default settings except for the peaks missing value set at more than 80% (Tan et al., Citation2013). Before multivariate statistical analysis, the data matrix obtained from MetaboNexus was properly reduced by a simple untargeted filtration strategy of ion peaks due to the multiple fragment ion with the same RT. Briefly, the most abundant fragment ion (the time bin is 0.01 min) was remained and the other ions were excluded (Tan et al., Citation2011). The simplified data were normalized using the summation of response of all metabolites in one sample and then calculated the ratios of the intensities of mass ions to that of the silylation derivative of ribitol (IS) fragment ion (m/z 216.9). In addition, the ion peaks generated by the IS were also removed from the data matrix before further processing. Principal component analysis (PCA), and partial least-squares discriminant analysis (PLS-DA) were carried out using the SIMCA-P software (version 11.5, Umetrics, Sweden) to visually display the correlation between the metabolic information. Hemi (version 1.0 α, http://hemi.biocuckoo.org/down.php) was also used for further visualization and hierarchical clustering analyses (HCA).
2.5. Statistical analysis
Statistical significance for the results of serum metabolite markers was determined by one-way analysis of variance followed by least-significant difference test (SPSS 20, IBM), and p < 0.05 was considered statically significant. Multi Experiment Viewer software was used for nonparametric test (http://www.tm4.org/). Additionally, the z-score value was calculated according to the following equation (Sreekumar et al., Citation2009):
where Xi is the level of a random metabolite in serum, is average value of the serum level of normal diet-fed mice, and SDcontrol is standard deviation of the metabolite level in the serum of normal diet-fed mice.
3. Results
3.1. Metabolic profiling of GC-MS
In order to validate the robustness of sample preparation and the stability of instrument analysis that were described in Section 2.3, the QC samples were analyzed by GC-MS. As shown in ), all the QC samples were within two times of the SD in score plots. In addition, the assay for distributions of %RSD for QC samples revealed that 95.23% of sum of responses had a %RSD of <30% ()). These results indicated that the established method could be used to identify the varied metabolite profiles of test samples from different individuals (Tan et al., Citation2011).
Figure 1. Analysis of GC-MS metabolomic platform for the global profiling of serum metabolites. Score plots of PCA for QC samples (A) and the distribution of %RSD for metabolites’ areas in QC samples (n = 5, B). The percentage of compound numbers within corresponding %RSD range is represented by each column and the accumulative percentage of responses was revealed by line. The typical total ions current chromatograms of serum (C). N: normal group; M: high-fructose model group; S: stachyose-treated group; TP: tea polyphenol-treated group; STP: stachyose-tea polyphenol commixture group.
Figura 1.Análisis de la plataforma metabolómica GC-MS para el perfil global de metabolitos de suero. Diagrama de datos de PCA para muestras de QC (A) y distribución de %RSD para las áreas de metabolitos en muestras de QC (N = 5, B). El porcentaje de números compuestos dentro del rango %RSD correspondiente queda representado por cada columna y el porcentaje acumulado de respuestas queda indicado por renglón. El total típico de iones en los cromatogramas actuales de suero (C). N: grupo normal, M. grupo modelo de alta fructosa, S: grupo tratado con estaquiosa, TP: grupo tratado con polifenoles de té, STP: grupo con una mezcla de estaquiosa y polifenoles de té.
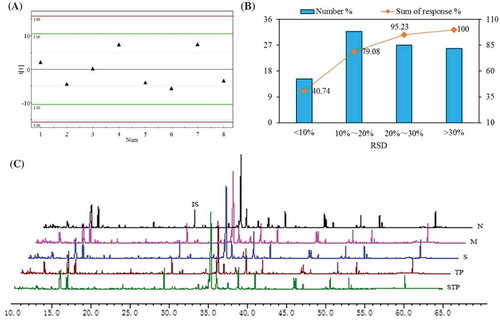
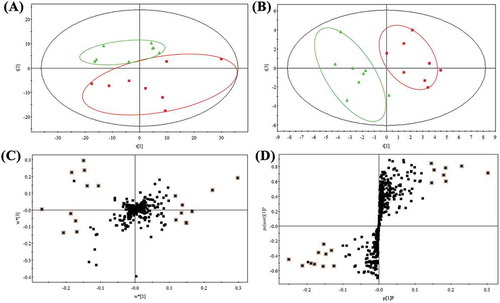
Serum metabolites of the tested mice were analyzed by GC-MS, and the typical total ion chromatography (TIC) of serum extracts are shown in ). After the peak identification and refining based on the 80% rule, we obtained 2220 spectral features from the real samples analyzed by GC-MS, and the mass ions were aligned by MetaboNexus software. The preprocessed GC-MS metabolite profiling data were further simplified and 430 ion peaks were obtained. Firstly, unsupervised PCA was applied to explore correlations between normal and HF-fed groups, and a tendency in the score plot to separate the two classes was revealed (R2X = 0.65 and Q2 = 0.37) in ). It suggested that the serum metabolites of normal and HF diet-fed mice had difference at integral level. However, PCA analysis cannot generally provide detail information about data classification (Pasikanti, Ho, & Chan, Citation2008). To further search for ion peaks that can discriminate normal group from model group, PLS-DA, the most commonly used method for biomarkers screening, was applied in this study. As shown in ), PLS-DA analysis (R2X = 0.784, R2Y = 0.922, and Q2 = 0.829) more perfectly classified distinguished both normal and HF-fed mice in contrast to PCA analysis. Moreover, the iterations analysis (R2 = 0.563; Q2 = −0.358) showed that there was no fitting phenomenon, indicating that the PLS-DA model was applicable for screening of biomarker candidates.
Figure 2. PCA score plot (A), PLS-DA score plot (B), loading plot (C) and S-plot (D) derived from serum GC-MS spectra concerning normal (▲) and high-fructose groups (■).
Figura 2. Diagrama de datos de PCA (A), diagrama de datos de PLS-DA (B), diagrama de carga (C) y diagrama S (D) derivados de los espectros GC-MS de suero, tratándose de grupos normales (▲) y de alta fructosa (■).
3.2. Defining of metabolic biomarker candidates
PLS-DA loadings plot ()) and S-plot ()) were generated using Par scaling to obtain a list of potential biomarker candidates of HF-induced hepatic injury in the mice. After a cross-contrast, 18 variables with nonzero coefficients were first selected as the candidates of biomarkers. The candidate markers were also cross-selected by examining the volcano plot and considering a fold change threshold of 1.5 and p-value less than 0.05 (Cheema et al., Citation2014). Herein, five markers were obtained by analysis of volcano plot ()). In addition, the distribution of biomarker candidates across all specimens was presented in the z-score plots ()). Among the 18 biomarker candidates, 7 metabolites showed significant change by z-score analysis and nonparametric test. Taken together, the total of four marker candidates ()) were cross-selected based on the preliminary screening results of multivariate and univariate analysis. However, there were multiple variables from the same metabolites, and therefore, merging of variables from the identical metabolites was performed (Tan et al., Citation2011). Finally, three metabolites were collected and considered as the potential biomarkers for HF-induced liver damage.
Figure 3. Volcano plot of serum extracts comparing normal and high fructose diets-fed mice in the same order (A). The red dots represent selected putative markers with a p-value <0.05 and fold-change cutoff of > or <2. Z-score plots for the comparison between normal (yellow) and model (green) candidate metabolites from the results of multivariate statistical analysis (B). Each point represents one metabolite in one sample. A total of seven metabolites were cross-selected based on the preliminary screening result of univariate Wilcoxon Mann–Whitney test and z-score value, which were plotted with * in z-score plot. *p < 0.05, **p < 0.01 (n = 8).
Figura 3. Diagrama de volcán de extractos de suero que comparan ratones alimentados normalmente con ratones alimentados con dietas altas en fructosa, en el mismo orden (A). Los puntos rojos representan marcadores putativos seleccionados con un valor-p < 0.05 y un tope de cambio en el incremento de veces [fold-change cutoff] de > o < 2. Diagramas de datos Z para la comparación entre metabolitos candidatos normales (amarillos) y modelos (verdes), a partir de los resultados del análisis estadístico multivariado (B). Cada punto representa un metabolito en una muestra. Se seleccionó un total de 7 metabolitos de manera cruzada, a partir del resultado preliminar de la prueba univariante Wilcoxon Mann-Whitney y el valor de datos Z, diagramados con *en el diagrama de datos Z. *p < 0.05, **p < 0.01 (n = 8).
![Figure 3. Volcano plot of serum extracts comparing normal and high fructose diets-fed mice in the same order (A). The red dots represent selected putative markers with a p-value <0.05 and fold-change cutoff of > or <2. Z-score plots for the comparison between normal (yellow) and model (green) candidate metabolites from the results of multivariate statistical analysis (B). Each point represents one metabolite in one sample. A total of seven metabolites were cross-selected based on the preliminary screening result of univariate Wilcoxon Mann–Whitney test and z-score value, which were plotted with * in z-score plot. *p < 0.05, **p < 0.01 (n = 8).Figura 3. Diagrama de volcán de extractos de suero que comparan ratones alimentados normalmente con ratones alimentados con dietas altas en fructosa, en el mismo orden (A). Los puntos rojos representan marcadores putativos seleccionados con un valor-p < 0.05 y un tope de cambio en el incremento de veces [fold-change cutoff] de > o < 2. Diagramas de datos Z para la comparación entre metabolitos candidatos normales (amarillos) y modelos (verdes), a partir de los resultados del análisis estadístico multivariado (B). Cada punto representa un metabolito en una muestra. Se seleccionó un total de 7 metabolitos de manera cruzada, a partir del resultado preliminar de la prueba univariante Wilcoxon Mann-Whitney y el valor de datos Z, diagramados con *en el diagrama de datos Z. *p < 0.05, **p < 0.01 (n = 8).](/cms/asset/f7a910cd-5889-4eab-b06a-ab9e373c2235/tcyt_a_1420101_f0003_c.jpg)
3.3. Validation and evaluation of metabolic biomarkers
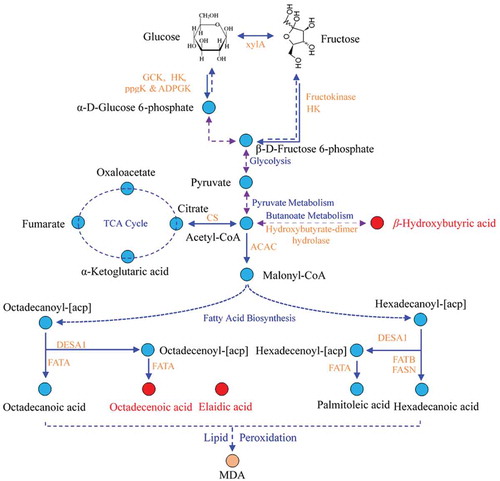
The three candidate markers were identified by searching the NIST 11.0 database and comparing with the peaks of commercial standards. As shown in , the product ion spectra (MS) of β-hydroxybutyric acid, elaidic acid and oleic acid in serum samples were in accordance with the commercial standards, suggesting that β-hydroxybutyric acid, elaidic acid and oleic acid were the potential biomarkers of HF-induced liver damage in mice. Furthermore, metabolic pathways including these compounds were also studied according to the Kyoto Encyclopedia of Genes and Genomes database (Tsutsui et al., Citation2010). The analyzed results showed that butanoate metabolism and fatty acid biosynthesis metabolism were disturbed by long-term consumption of fructose in mice ().
Figure 4. The MS spectra of silicane derivatives for β-hydroxybutyrate, oleic acid and elaidic acid in standard compounds (A, B and C, respectively) and serum samples (a, b and c, respectively).
Figura 4. Espectros MS de derivados de silicona para ácido betahidroxibutírico, ácido oleico y ácido elaídico en compuestos estándar (A, B y C, respectivamente) y muestras de suero (a, b y c, respectivamente).
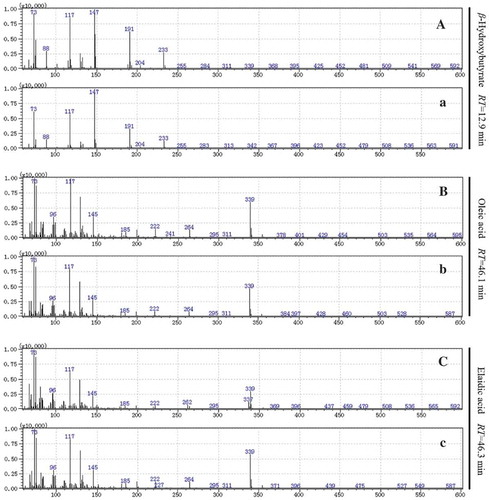
Figure 5. Schematic overview of the proposed metabolomics pathway of high fructose diet-treated mice based on serum metabolites analysis by GC-MS. Metabolites in red and blue represent an increase and not detected, respectively. The blue and orange words are pathway’s and enzymatic names, respectively.
Figura 5. Panorama esquemático de la vía metabolómica propuesta para ratones alimentados con una dieta alta en fructosa, basado en el análisis GC-MS de los metabolitos del suero. Los metabolitos en rojo y azul representan un incremento, y no detectado, respectivamente. Las palabras escritas en azul y naranja representan las vías y los nombres enzimáticos, respectivamente.
3.4. Stachyose in combination with tea polyphenols regulated biomarkers
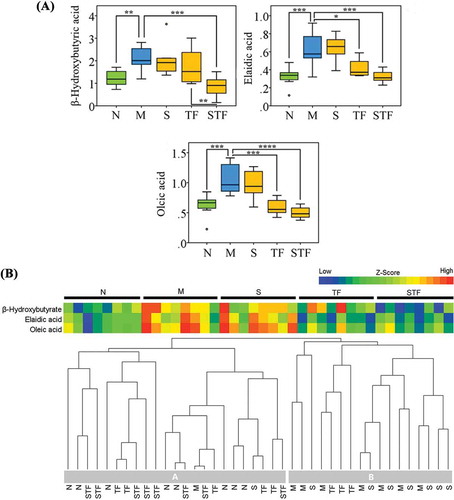
According to ), three potential biomarkers including β-hydroxybutyric acid (p < 0.01), elaidic acid (p < 0.001) and oleic acid (p < 0.001) were significantly increased by HF diet in mouse serum. However, these changes of biomarkers were inhibited by administration of stachyose or tea polyphenols alone or in combination. In addition, the levels of biomarkers were significantly reversed in the mice fed with stachyose + tea polyphenols, when compared to the mice in HF-treated model group. Moreover, co-administration of stachyose and tea polyphenols also more effectively inhibited (p < 0.05) these changes of biomarkers than the treatment of stachyose or tea polyphenols alone. Heat maps at integral level ()) clearly showed that administrations of stachyose or tea polyphenols or in combination differently restored HF-induced metabolic disorders. Additionally, the result of HCA intuitively revealed that all the treated mice were clustered into two groups, and stachyose + tea polyphenols-treated mice were obviously correlated with normal mice. These results indicated that treatment of stachyose together with tea polyphenols was more effective to attenuate the HF-induced metabolic syndrome when compared to treatment of stachyose or tea polyphenols alone.
Figure 6. Box plots of three typical differential metabolites in the serum of mice, which were plotted with * in box plots *p<0.05, **p<0.01, ***p<0.001, ****p<0.0001 (n=8) (A). Hierarchical clustering analysis and heat map of the z-score for identified metabolites in different diet s-administrated mice (B). N: normal group ; M: high-fructose model group ; S: stachyose-treated group ; TP: tea polyphenol-treated group ; STP: stachyose-tea polyphenol commixture group.
Figura 6. Análisis de clúster jerárquico y de mapa de calor del diagrama de los puntos z para metabolitos identificados en ratones alimentados con dietas diferentes (A). Diagrama de recuadros de tres distintos metabolitos típicos en el suero de ratones (B). N: grupo normal, M: grupo modelo de alta fructosa, S: grupo tratado con estaquiosa, TP: grupo tratado con polifenoles de té, STP: grupo tratado con estaquiosa y polifenoles de té.
4. Discussion
HF-induced liver injury is a typical metabolic syndrome, which is characterized by small molecules metabolites disorders (Bettaieb et al., Citation2014; Graziano et al., Citation2015). Routine biochemical analysis revealed that the combination of stachyose and tea polyphenol could effectively prevent HF-induced liver injury, but the mechanism of metabolic regulation is still not clear (Li et al., Citation2016). Therefore, to reveal the biomarkers of liver injury induced by HF diet is the key to prevent liver injury. Previous studies based on 1H NMR were performed to analyze potential biomarkers for insulin resistance induced by HF ingestion, and the identified potential biomarkers are mainly related to amino acid metabolism, energy and gut microbiota metabolism (Yang et al., Citation2014, Citation2015). However, these researches neglected the fact that HF-induced liver damage was closely associated with lipid metabolism (Bocarsly, Powell, Avena, & Hoebel, Citation2010). Therefore, a method that is adept in determining the “lipidomic” fraction should be selected to analyze serum metabolomic profile.
In this work, 30% fructose water was used to induce NAFLD in mice, and the model was identified as NASH by biochemistry and histological analysis (Li et al., Citation2016). The validated GC-MS metabonomics analysis was used to determine the serum metabolic fingerprinting. After a series of multivariate and univariate analysis, β-hydroxybutyric acid, elaidic acid and oleic acid are considered as potential biomarkers for HF-induced liver damage in mice ().
Among the three biomarkers, β-hydroxybutyric acid was regarded as an intermediate product of energy metabolism and the diabetes diagnosis biomarker, its metabolic level had a significant increase due to peripheral lipolysis induced by insulin resistance (Blaikie et al., Citation2014; Bresciani, Pietra, Corradin, Giunti, & Fracassi, Citation2014). Our data also showed that HF diet caused a significant increase in serum β-hydroxybutyric acid level. A large number of studies have shown that long-term intake of HF can not only induce the occurrence of hepatic injury but also lead to severe insulin resistance (Bettaieb et al., Citation2014; Ren et al., Citation2014). Accordingly, the current metabolomics study based on the level of β-hydroxybutyrate acid confirmed once again that the long-term intake of HF led to insulin resistance. However, tea polyphenols, such as epicatechin and so on, can effectively improve fructose-induced insulin resistance by regulating redox signals and endoplasmic reticulum stress (Bettaieb et al., Citation2014). In this study, it has been found that tea polyphenols can effectively reduce the level of serum markers of β-hydroxybutyrate acid. Moreover, stachyose combined with tea polyphenols is more effective to reduce the serum β-hydroxybutyrate acid levels as compared to administration of stachyose or tea polyphenols alone. We suppose that this may be related to the fact that stachyose promotes the absorption of tea polyphenols in mice (Li et al., Citation2016; Li, Lu, Huang, Han, & Yang, Citation2016).
In addition, HF can also increase the sterol regulatory element binding protein-1c and increase the synthesis and accumulation of hepatic fatty acids and triglycerides (Spruss & Bergheim, Citation2009). Castro et al. found that long-term intake of HF significantly increased oleic acid levels in the liver and adipose tissue (de Castro, Cardoso, Calder, Jordão, & Vannucchi, Citation2015b; de Castro et al., Citation2015a). Our study revealed a significant increase in serum elaidic acid levels in mice after 8 weeks of drinking with HF water. However, EGCG, the main component of tea polyphenols, can downregulate sterol regulatory element binding protein-1c to regulate fat synthesis by inhibiting Akt and activating AMPKa (Liu, Chan, Wang, Wei, & Chang, Citation2015). Therefore, we speculated that stachyose could effectively improve fructose-induced lipid metabolism disorder by increasing the absorption of tea polyphenols. This study validated that the administration of stachyose in combination with tea polyphenols effectively maintained the serum elaidic acid level in normal HF-fed mice.
We also found that long-term intake of HF significantly improved the levels of serum oleic acid that may exacerbate obesity, dyslipidemia, oxidative stress and inflammation in HF-fed mice (Hung et al., Citation2016). It is well known that trans-fatty acids are mainly produced by hydrogenation of vegetable oils, whereas HF-induced changes in the level of oleic acid in mice may be due to an increase in intestinal permeability, which may be related to the long-term intake of fructose. (Spruss & Bergheim, Citation2009), thus boosting food trans-fatty acids into the blood circulation. However, stachyose has strong intestinal flora regulation and laxative functions (Li, Lu, & Yang, Citation2013). This may prevent fructose-induced increase in the intestinal permeability from increasing, but this effect is very weak in terms of the metabolic level of oleic acid (). It is noteworthy that food is not the only source of trans-fatty acids, and oxidative stress and free radical action in the body can lead to the formation of endogenous trans-fatty acids (Hung et al., Citation2016). There is no doubt that tea polyphenols are effective in inhibiting the increase of trans-fatty acids in HF-fed mice. It may be due to the strong free radical scavenging and antioxidant activity of tea polyphenols (Bettaieb et al., Citation2014; Hung et al., Citation2016). More interestingly, the administration of stachyose together with tea polyphenols could more effectively inhibit the increase of serum anti-oleic acid levels in HF-fed mice than stachyose alone or tea polyphenols alone. It may be related to stachyose-induced increase on the bioavailability of tea polyphenols in mice. These results indicate that butyric acid and fatty acid metabolic pathways are new potential targets for the prevention or adjuvant treatment of HF-induced liver injury, while simultaneous intake of stachyose and tea polyphenols is a novel administration model for the prevention of liver injury.
In conclusion, a metabolomic study of the biochemical profiles of HF-induced NAFLD was performed using GC-MS and multivariate analysis, showing complex variations in endogenous metabolites. β-Hydroxybutyric acid, elaidic acid and oleic acid were confirmed as potential biomarkers for HF-induced NAFLD, indicating that energy and lipid metabolism was perturbed by fructose diet in mice. Additionally, the metabonomic analysis revealed that co-administration of stachyose and tea polyphenols was a promising method for preventing against fructose-induced lipotoxicity.
Acknowledgments
This study was supported by grants from the National Natural Science Foundation of China (31671823), and the Development Program for Innovative Research Team of Shaanxi Normal University, China (GK201501006), as well as Science and Technology Innovation as a Whole Plan Projects of Shaanxi Province, China (2015KTCQ02-01).
Disclosure statement
No potential conflict of interest was reported by the authors.
Additional information
Funding
References
- Bettaieb, A., Vazquez Prieto, M. A., Rodriguez Lanzi, C., Miatello, R. M., Haj, F. G., Fraga, C. G., & Oteiza, P. I. (2014). (-)-Epocatechin mitigates high-fructose-associated insulin resistance by modulating redox signaling and endoplasmic reticulum stress. Free Radical Biology and Medicine, 72, 247–256. doi:10.1016/j.freeradbiomed.2014.04.011
- Blaikie, T. P. J., Edge, J. A., Hancock, G., Lunn, D., Megson, C., Peverall, R., … Taylor, D. (2014). Comparison of breath gases, including acetone, with blood glucose and blood ketones in children and adolescents with type 1 diabetes. Journal of Breath Research, 8, 046010. doi:10.1088/1752-7155/8/4/046010
- Bocarsly, M. E., Powell, E. S., Avena, N. M., & Hoebel, B. G. (2010). High-fructose corn syrup causes characteristics of obesity in rats: Increased body weight, body fat and triglyceride levels. Pharmacology, Biochemistry and Behavior, 97, 101–106. doi:10.1016/j.pbb.2010.02.012
- Bresciani, F., Pietra, M., Corradin, S., Giunti, M., & Fracassi, F. (2014). Accuracy of capillary blood 3-β-hydroxybutyrate determination for the detection and treatment of canine diabetic ketoacidosis. Journal of Veterinary Science, 15, 309–316. doi:10.4142/jvs.2014.15.2.309
- Cheema, A. K., Pathak, R., Zandkarimi, F., Kaur, P., Alkhalil, L., Singh, R., … Hauer-Jensen, M. (2014). Liver metabolomics reveals increased oxidative stress and fibrogenic potential in gfrp transgenic mice in response to lionizing radiation. Journal of Proteome Research, 13, 3065–3074. doi:10.1021/pr500278t
- Chen, L. L., Zhao, X. L., Liang, G. J., Sun, J. R., Lin, Z. F., Hu, R. M., … Li, Y. M. (2017). Recombinant SFRP5 protein significantly alleviated intrahepatic inflammation of nonalcoholic steatohepatitis. Nutrition & Metabolism, 14, 1–8. doi:10.1186/s12986-017-0208-0
- de Castro, G. S., Cardoso, J. F., Calder, P. C., Jordão, A. A., & Vannucchi, H. (2015b). Fish oil decreases hepatic lipogenic genes in rats fasted and refed on a high fructose diet. Nutrients, 7(3), 1644–1656. doi:10.3390/nu7031644
- de Castro, G. S., Demini, R., Simões-Ambrosio, L. M., Calder, P. C., Jordão, A. A., & Vannucchi, H. (2015a). Dietary docosahexaenoic acid and eicosapentaenoic acid influence liver triacylglycerol and insulin resistance in rats fed a high-fructose die. Marine Drugs, 13(4), 1864–1881. doi:10.3390/md13041864
- Graziano, F., Grassi, M., Sacco, S., Concas, M. P., Vaccargiu, S., Pirastu, M., & Biino, G. (2015). Probing the factor structure of metabolic syndrome in Sardinian genetic isolates. Nutrition, Metabolism & Cardiovascular Diseases, 25, 548–555. doi:10.1016/j.numecd.2015.02.004
- Gregory, A. M., Mariana, V. M., & Anna, M. D. (2013). NAFLD, NASH and liver cancer. Nature Reviews Gastroenterology & Hepatology, 10, 656–665. doi:10.1038/nrgastro.2013.183
- Huang, S. M., Toh, W., Benke, P. I., Tan, C. S., & Ong, C. N. (2014). MetaboNexus: An interactive platform for integrated metabolomics analysis. Metabolomics, 10, 1084–1093. doi:10.1007/s11306-014-0648-8
- Hung, W. L., Hwang, L. S., Shahidi, F., Pan, M. H., Wang, Y., & Ho, C. T. (2016). Endogenous formation of trans fatty acids: Health implications and potential dietary interventio. Journal of Functional Foods, 25, 14–24. doi:10.1016/j.jff.2016.05.006
- Li, T., Lu, X. S., & Yang, X. B. (2013). Stachyose-enriched α-galacto-oligosaccharides regulate gut microbiota and relieve constipation in mice. Journal of Agricultural and Food Chemistry, 61(48), 11825–11831. doi:10.1021/jf404160e
- Li, W. F., Huang, D., Gao, A. N., & Yang, X. B. (2016). Stachyose increases absorption and hepatoprotective effect of tea polyphenols in high fructose-fed mice. Molecular Nutrition & Food Research, 60, 502–510. doi:10.1002/mnfr.201500547
- Li, W. F., Lu, Y. L., Huang, D., Han, X., & Yang, X. B. (2016). Effects of stachyose on absorption and transportation of tea catechins in mice: Possible role of Phase II metabolic enzymes and efflux transporters inhibition by Stachyose. Food & Nutrition Research, 60, 1–10. doi:10.3402/fnr.v60.32783
- Liu, H. W., Chan, Y. C., Wang, M. F., Wei, C. C., & Chang, S. J. (2015). Dietary (-)-epigallocatechin-3-gallate supplementation counteracts aging-associated skeletal muscle insulin resistance and fatty liver in senescence-accelerated mouse. Journal of Agricultural and Food Chemistry, 63(38), 8407–8417. doi:10.1021/acs.jafc.5b0250
- Nomura, K., & Yamanouchi, T. (2012). The role of fructose-enriched diets in mechanisms of nonalcoholic fatty liver disease. Journal of Nutritional Biochemistry, 23, 203–208. doi:10.1016/j.jnutbio.2011.09.006
- Pasikanti, K. K., Ho, P. C., & Chan, E. C. Y. (2008). Development and validation of a gas chromatography/mass spectrometry metabonomic platform for the global profiling of urinary metabolites. Rapid Communications in Mass Spectrometry, 22, 2984–2992. doi:10.1002/rcm.3699
- Ren, D. Y., Zhao, Y., Nie, Y., Yang, N. N., & Yang, X. B. (2014). Hypoglycemic and hepatoprotective effects of polysaccharides from Artemisia sphaerocephala Krasch seeds. International Journal of Biological Macromolecules, 69, 296–306. doi:10.1016/j.ijbiomac.2014.05.064
- Spruss, A., & Bergheim, I. (2009). Dietary fructose and intestinal barrier: Potential risk factor in the pathogenesis of nonalcoholic fatty liver disease. Journal of Nutritional Biochemistry, 20, 657–662. doi:10.1016/j.jnutbio.2009.05.006
- Sreekumar, A., Poisso, L. M., Rajendiran, T. M., Khan, A. P., Cao, Q., Yu, J. D., … Chinnaiyan, A. M. (2009). Metabolomic profiles delineate potential role for sarcosine in prostate cancer progression. Nature, 457, 910–914. doi:10.1038/nature07762
- Tan, B. B., Qiu, Y. P., Zou, X., Chen, T. L., Xie, G. X., Cheng, Y., … Jia, W. (2013). Metabonomics identifies serum metabolite markers of colorectal cancer. Journal of Proteome Research, 12, 3000–3009. doi:10.1021/pr400337b
- Tan, G. G., Lou, Z. Y., Liao, W. T., Zhu, Z. Y., Dong, X., Zhang, W., … Chai, Y. F. (2011). Potential biomarkers in mouse myocardium of doxorubicin-induced cardiomyopathy: A metabonomic method and its application. PLoS One, 6, e27683. doi:10.1371/journal.pone.0027683
- Tappy, L., & Lȇ, K.-A. (2010). Metabolic effects of fructose and the worldwide increase in obesity. Physiological Reviews, 90, 23–46. doi:10.1152/physrev.00019.2009
- Tsutsui, H., Maeda, T., Toyo’oka, T., Min, J. Z., Inagaki, S., Higashi, T., & Kagawa, Y. (2010). Practical analytical approach for the identification of biomarker candidates in prediabetic state based upon metabonomic study by ultraperformance liquid chromatography coupled to electrospray lionization time-of-flight mass spectrometry. Journal of Proteome Research, 9, 3912–3922. doi:10.1021/pr100121k
- Wree, A., Broderick, L., Canbay, A., Hoffman, H. M., & Feldstein, A. E. (2013). From NAFLD to NASH to cirrhosis-new insights into disease mechanisms. Nature Reviews Gastroenterology & Hepatology, 10, 627–636. doi:10.1038/nrgastro.2013.149
- Wu, X. L., Tong, Y. D., Shankar, K., Baumgardner, J. N., Kang, J., Badeaux, J., … Ronis, M. J. J. (2011). Lipid fatty acid profile analyses in liver and serum in rats with nonalcoholic steatohepatitis using improved gas chromatography-mass spectrometry methodology. Journal of Agricultural and Food Chemistry, 59, 747–757. doi:10.1021/jf1038426
- Yang, Y. X., Wang, L. L., Wang, S. M., Huang, R. B., Zheng, L. Y., Liang, S. W., … Xu, J. F. (2014). An integrated metabonomic approach to studying metabolic profiles in rat models with insulin resistance induced by high fructose. Molecular BioSystems, 10, 1803–1811. doi:10.1039/C3MB70618D
- Yang, Y. X., Zheng, L. Y., Wang, L. L., Wang, S. M., Wang, Y. L., & Han, Z. H. (2015). Effects of high fructose and salt feeding on systematic metabonome probed via 1H NMR spectroscopy. Magnetic Resonance in Chemistry, 53, 295–303. doi:10.1002/mrc.4198
- Zeng, J., Yin, P. Y., Tan, Y. X., Do, L. W., Hu, C. X., Huang, Q., … Xu, G. G. (2014). Metabolomics study of hepatocellular carcinoma: Discovery and validation of serum potential biomarkers by using capillary electrophoresis-mass spectrometry. Journal of Proteome Research, 13, 3420–3431. doi:10.1021/pr500390y