
 ?Mathematical formulae have been encoded as MathML and are displayed in this HTML version using MathJax in order to improve their display. Uncheck the box to turn MathJax off. This feature requires Javascript. Click on a formula to zoom.
ABSTRACT
The viscosity of Chinese rice wine gradually increases with the maturing process, resulting in a better taste due to longer contact with the tongue. Herein, the structure of water–ethanol was detected by hydrogen nuclear magnetic resonance (1H-NMR) and viscosity measurement to define the strength of hydrogen bonding. Through single-factor experiments, it can be seen that most of the flavors have a promoting effect on alcohol–water hydrogen bonding, with the exception of aldehydes. And the factors influencing hydrogen bonding in decreasing order were determined by Plackett–Burman (PB) test. The relationship between hydrogen bonding strength and flavor in Chinese rice wine with 18% (v/v) alcohol concentration was investigated through multiple regression analysis, with an adjusted R2 of 0.925. The results of study provide important insight for the quality control and molecular mechanism of viscosity increasing during Chinese rice wine aging.
RESUMEN
La viscosidad del vino de arroz chino aumenta gradualmente durante su añejamiento, haciendo que su sabor sea más agradable debido a su contacto más prolongado con la lengua. El presente estudio detectó la estructura de agua-etanol empleando la resonancia magnética nuclear de hidrógeno (1H-NMR) y la medición de la viscosidad para definir la fuerza de adhesión del hidrógeno. A través de experimentos de factor único se comprobó que la mayoría de los sabores promueve la adhesión del hidrógeno al alcohol-agua, excepción hecha de los aldehídos. La prueba Plackett-Burman (PB) determinó los factores que, en orden decreciente, inciden en la adhesión del hidrógeno. Utilizando un análisis de regresión múltiple, se investigó la relación existente entre la fuerza de adhesión del hidrógeno y el sabor del vino de arroz chino mediante la concentración de alcohol 18% v/v, con una R2 ajustada de 0.925. Los resultados del estudio proporcionan importantes conocimientos para el control de calidad y el mecanismo molecular que provoca la creciente viscosidad del vino de arroz chino durante su añejamiento.
1. Introduction
Chinese rice wine is a water and ethanol solution with a distinct flavor and taste. A traditional Chinese fermented alcoholic beverage, this wine is one of the most popular alcoholic beverages in China with an annual consumption of millions of liters (Chen & Xu, Citation2010; Yu, Ying, Fu, & Lu, Citation2006). Water (H2O) and ethanol (EtOH) account for approximately 95% of Chinese rice wine(Sato & Buchner, Citation2004). In water–ethanol solutions, hydrogen bonding occurs with water–water, water–ethanol, and ethanol–ethanol molecules. Because many free ethanol molecules are found in the solution, newly brewed Chinese rice wine has a relatively poor taste. In the manufacturing process, Chinese rice wine is usually matured in pottery jars for at least one year. After the maturation, the organoleptical stimulation of ethanol is reduced. Due to the strong polarity of water and ethanol, the change of the hydrogen bonding structure of water–ethanol molecules has been thought to reduce the irritating taste caused by the free ethanol (Mo, Fan, & Xu, Citation2009). However, few researchers have scientifically demonstrated the relationship between the water–ethanol structure and the viscosity. Viscosity increasing suggested the mellowing of the wine taste. Several studies investigated the interaction between the water and ethanol molecules and the hydrogen bonding structure in aged alcohol beverages (Burikov, Dolenko, Patsaeva, Starokurov, & Yuzhakov, Citation2010).
In the field of solution chemistry, the study of water–alcohol solutions is one of the most attractive subjects. However, the study of the hydrogen bonding between water and ethanol in wines has not been pursued as much as in solution chemistry. Franks and Ives (Citation1966) reviewed the physicochemical and thermodynamic properties of the alcohol–water mixtures. Coccia, Indovina, Podo, and Viti (Citation1975) analyzed the hydrogen nuclear magnetic resonance (1H-NMR) signals in ethanol–water mixtures throughout an entire range of concentrations. Nishi et al. (Citation1988) examined the molecular association in ethanol–water mixtures using mass spectrometric analysis. Hydrogen bonding under high temperature and pressure in methanol and methanol/water mixtures was studied by Dougan et al. (Citation2004). Schwerdtfeger, Köhler, Potte, and Kaatze (Citation2001) examined the dielectric relaxation of hydrogen bonded liquids in mixtures of monohydric alcohols with n-alkanes. Sato and Buchner (Citation2003) discussed the cooperative dynamics of the H-bond system in 2-propanol and water mixtures. The molecular structure of a concentrated alcohol-water mixture was reported by Dixit, Crain, Poon, Finney, and Soper (Citation2002). In some alcohol–water mixtures, the existence of clathrate structures was reported by Murthy (Citation1999). Dimitroulis, Kainourgiakis, Raptis, and Samios (Citation2015) studied the diffusion of water in simulated water and n-alcohol systems. Moreover, the hydrogen bond network is characterized by rather stable topology. Campen and Kubicki (Citation2010) calculated ethanol (OH) frequencies and interaction energy on hydrogen bonding for the H2O–H2O, CH3OH–H2O, and H2O–CH3OH dimers.
In previous studies, most scholars exclusively used water hydroxyl proton peaks to determine hydrogen bonding strength using high-resolution 1H-NMR spectroscopy (Mizuno et al., Citation2000). Most salts, acids, and phenols contained in Japanese shochu had been studied (Nose, Masasjo, & Ueda, Citation2004). However, 1H-NMR only offered abstract results confirming the degree of hydrogen bonding in beverages (Nose et al., Citation2005). In this work, we investigated the 1H-NMR spectra of water and ethanol hydroxyl proton peaks in addition to measuring viscosity in model solutions. Chinese rice wine is composed of nutrients like sugars, alcoholic, aldehydes, as well as acids and salts (Mo et al., Citation2010). The effects of flavor constitutions on hydrogen bonding were analyzed by the chemical shift of two OH peaks in 1H-NMR and by measuring viscosity. The relationship between the hydrogen bonding of water–ethanol in Chinese rice wine and flavor constitutions has been examined.
2. Materials and methods
2.1. Materials
Water was deionized and distilled twice under the presence of potassium permanganate (KMnO4) and sodium hydroxide (NaOH). Regents including 99.7% ethanol, sugars, acids, alcohols, aldehydes, esters, and alcohols were of analytical reagent (AR) grade. All reagents were purchased from Sinopharm Chemical Reagent Beijing Co., Ltd. The ubbelodhe viscometer and other glass columns were purchased from Hefei Meifeng Chemical Instrument Co., Ltd. The constant temperature water baths were produced by Shanghai Pingxuan Scientific Instruments Co., Ltd. The superconducting nuclear magnetic resonance (NMR) spectral instrument was produced by Agilent from the United States. The Chinese rice wine sample was provided by Anhui Gu Nan Feng Industrial Co., Ltd.
2.2. 1H-NMR spectroscopy
1H-NMR spectra were measured with a JEOL EX-400 spectrometer operating at 400 MHz at 20°C. The deuterated reagent was CO(CD3)2, containing 0.03% (volume fraction) tetramethylsilane (TMS) external reference, produced by CIL, U.S. The TMS solution was sealed at the center of a 5 mm capillary tube.
2.3. Viscosity
The viscosity was measured by ubbelodhe viscometer (Agoston, Ötsch, & Jakoby, Citation2005; Thompson, Kaiser, & Jorgenson, Citation2006). Capillary diameter was 0.6–0.7 mm. The test temperature was 30°C. The temperature of the sample was maintained constant within ±0.05°C by a circulating and thermostatic cistern and the measurement error within 30 s.
2.4. Chinese rice wine sample
Chinese rice wine production process requires three times filtration, so finished product is a clear and transparent liquid. For further experiments, the samples of Chinese rice wine were treated with 3000 r/min for 30 min.
2.5. Effect of flavor chemicals in Chinese rice wine on hydrogen bonding in alcohol water
The aroma of aged Chinese rice wine Qu is one of the most important factors that influences the flavor of Chinese rice wine (Mo, Fan, & Xu, Citation2012). It was shown that the concentrations of most flavor chemicals increased progressively from the first day to the fourth day of fermentation, and then decreased gradually (Mo et al., Citation2010).
Most of the flavor components in Chinese rice wine contain polar groups. So we design an experimental scheme to investigate the effect of flavor chemicals on hydrogen bonding. Blending of 18% (v/v) ethanol aqueous solution with glucose concentration of 1 × 10⁻⁵, 1 × 10⁻⁴, 1 × 10⁻³, 1 × 10⁻², 1 × 10⁻¹, and 1 mol/L, we determine hydrogen bonding strength. The X axis is log value of concentration. Y axis is hydrogen bonding strength (Δδ, η). The research method for other flavor chemicals is the same as glucose.
2.6. Statistical analysis
All data were an average of three experiments. Nuclear magnetic data were processed using MestreNova software (Funasaki, Nomura, Ishikawa, & Neya, Citation2001), and chemical formulas were plotted using Chemdraw software.
The multivariate linear stepwise regression analysis can comprehensively analyze the explanation degree of each factor on the dependent variable, that is, the ability of each flavor compounds to interpret the hydrogen bonding of Chinese rice wine. Therefore, by using this method, the quantitative relationship between the various factors and the alcohol–water hydrogen bonding strength in Chinese rice wine can be obtained.
3. Results and discussion
3.1. Determination of hydrogen bonding strength index
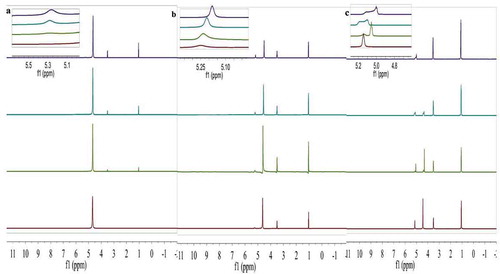
1H-NMR measures the relative number of protons and determines the type of association. More importantly, 1H-NMR details the association of intermolecular hydrogen bonding (Oliveira & Vasconcellos, Citation2006). 1H-NMR chemical shifts reflect the average properties or conditions of the hydrogen bonding structure of the three types of hydrogen bonding interactions in ethanol-water (EtOH-H2O) solutions: water–ethanol, water–water, and ethanol–ethanol (Matsugami et al., Citation2016; Nishi et al., Citation1988). The various ethanol mole concentrations (χe = 0.0–1.0) in water and ethanol mixtures were studied using 1H-NMR spectra. The results are shown in . shows the 1H-NMR spectra of non-ethanol, 5%, 18%, 30%, 40%, 50%, 60%, 70%, 80%, and 90% (v/v) and pure ethanol solutions without H+ or OH- impurity (Gereben & Pusztai, Citation2015). Over the ethanol mole fraction range χe, the water hydroxyl proton and the alcoholic hydroxyl proton were independently separated and were easy to distinguish. In the pure aqueous solution, only the water hydroxyl proton peak was observed; the hydroxyl proton chemical shift of water was 4.685. In the pure ethanol solution, the hydroxyl proton chemical shift of ethanol was 4.994. According to the national standard of Chinese rice wine, the wine alcohol content is about 18% (v/v). In this work, 18% ethanol concentration (v/v) in the ethanol–water mixtures was considered to be the model of Chinese rice wine. At this concentration, two proton peaks were observed in both alcohol and water. The 1H-NMR spectra showed water and ethanol hydroxyl proton peaks.
Table 1. 1H chemical shift of ethanol (EtOH) and water hydroxyl proton vs. EtOH concentration.
Tabla 1. Desplazamiento químico 1H de etanol (EtOH) y el protón de hidroxilo de agua versus la concentración de EtOH.
Figure 1. (a) The hydrogen nuclear magnetic resonance (1H-NMR) spectra at 0%, 5%, 10%, and 18% ethanol concentration (v/v) in ethanol–water solutions. (b) The 1H-NMR spectra at 30%, 40%, 50%, and 60% ethanol concentration (v/v) in ethanol–water solutions. (c) The 1H-NMR spectra at 70%, 80%, 90%, and 100% ethanol concentration (v/v) in ethanol–water solutions.
Figura 1. (a) Espectro de la resonancia magnética nuclear de hidrógeno (1H-NMR) a 0%, 5%, 10% y 18% de concentración de etanol (v/v) en soluciones de etanol-agua. (b) Espectro 1H-NMR a 30%, 40%, 50% y 60% de concentración de etanol (v/v) en soluciones de etanol-agua. (c) Espectro 1H-NMR a 70%, 80%, 90% y 100% de concentración de etanol (v/v) en soluciones de etanol-agua.
) shows the changes in the –CH3 and –CH2 chemical shifts of EtOH-H2O solutions with increasing ethanol concentration. As shown by ), the proton formants of methyl and methylene were largely unaffected by ethanol concentration. Therefore, the methyl and methylene peaks were used as the internal reference peaks.
Figure 2. (a) 1H chemical shift of –CH3 and –CH2 in EtOH–water solutions vs. the mole fraction of ethanol (EtOH). (b) 1H chemical shift of the OH proton of EtOH and water in EtOH–water solution vs. the mole fraction of EtOH. (c) Ethanol mole fraction dependence of chemical shifts ,
. (d) Viscosity measurement in EtOH–water solutions vs. the mole fraction of EtOH.
Figura 2. (a) Desplazamiento químico 1H de -CH3 y -CH2 en soluciones EtOH-agua versus la fracción molar de etanol (EtOH). (b) Desplazamiento químico 1H del protón OH de EtOH y agua en una solución EtOH-agua versus la fracción molar de EtOH. (c) Dependencia de la fracción molar de etanol en los desplazamientos químicos ,
. (d) Medición de la viscosidad en soluciones EtOH-agua versus la fracción molar de EtOH.
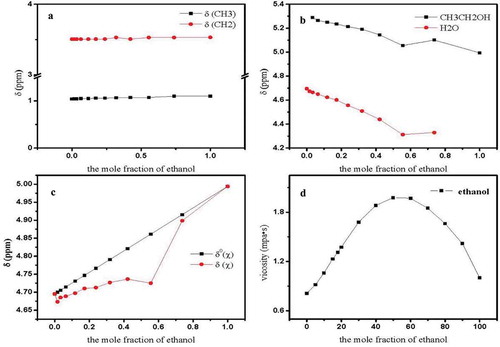
Within 0 < χe < 1.000, ethanol was dissolved in water ()). The chemical shifts were much higher for ethanol hydroxyl protons in liquid than in pure ethanol (δOH = 4.994; χe = 1). The water molecule’s proton chemical shift of system was much smaller than that of pure water (δHOH = 4.685; χe = 0). This could be explained by the associated hydrogen bond affecting the ethanol-aqueous solution system. As the proton external environment changes, its chemical shift changes; the original alcohol–ethanol and water–water structure were destroyed. The microscopic association presents a new state at different ethanol mole concentrations. This conclusion was consistent with that of who studied the ethanol–water system by analyzing Raman and infrared (IR) spectroscopy (Nauta & Miller, Citation2000).
Dixit et al. (Citation2002) argued that the thermodynamic change after mixing ethanol and water was due to incomplete mixing of hydrogen bonds between molecules within the system. Hence, to determine the hydrogen bonding strength, we read two proton peaks in different ethanol concentrations of ethanol–water solution. δ(χ) is the solution of ethanol and water hydroxyl proton weighted average chemical shift:
where δe(χ), δw(χ) are the proton chemical shifts of water and ethanol in the mixtures at molar fraction x of ethanol, respectively.
We assumed that an ideal solutions means that no association exists in the mixed system. δ°(χ) was considered as the ideal mixing of pure water and pure ethanol hydroxyl proton weighted average chemical shift:
where δw(1), δe(0) are the hydroxyl proton chemical shift of pure water and pure ethanol, respectively. Equation (3) explains the difference between the ethanol–water solution and the ideal mixture:
The greater the Δδ, the greater the mixed state of ethanol and water molecules from the ideal mix, indicating a stronger intermolecular H-bond association.
) shows the specificity of the change in the molar fraction of δ°(χ), δ(χ) with various concentrations of ethanol. When the ethanol concentration x was 0.550, Δδ reached a maximum, which was consistent with the viscosity measurement ()). The reason for this observation may be the stable structure of the hydrogen bond formed at this time between ethanol and water molecules. The molar ratio of ethanol to water in the ethanol–water solution was close to 1:2, causing the formation of a stable cyclic trimer association structure, under strong hydrogen bonding (Nauta & Miller, Citation2000).
3.2. Effects of flavor constitutes on the hydrogen bonding of model Chinese rice wine
Chinese rice wine is a complex colloidal solution containing many substances, such as sugars, acids, alcohols, aldehydes, esters that affect the taste, as well as water and ethanol (Cao, Xie, Wu, & Lu, Citation2010; Shen, Ying, Li, Zheng, & Hu, Citation2011). Different flavors can affect the chemical shift due to their different concentrations in Chinese rice wine. The factors affecting hydrogen bonding should be integrated into Chinese rice wine. Sugars, acids, alcohols, and esters are prone to forming hydrogen bonding because of their strong polar groups.
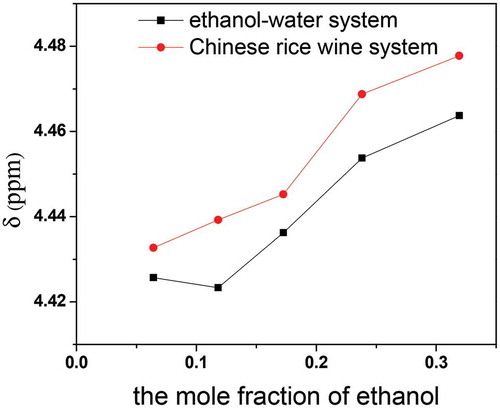
The proton exchange between water and ethanol molecules is promoted by the combined effect of the flavor substances. So, the two peaks coalesced to a single peak in the 1H-NMR spectrum. The δ value of the merged proton peak in the alcoholic simulation system was smaller than in the Chinese rice wine system with the same alcohol concentration, with a deviation between 0.006 and 0.015 ppm. This indicates that flavor constitutes dissolved in Chinese rice wine strengthened the alcohol–water hydrogen bond association, as shown in .
Figure 3. Comparison of the 1H chemical shift of different systems: the ethanol and water system and the Chinese rice wine system.
Figura 3. Comparación del desplazamiento químico 1H de distintos sistemas: sistema de etanol y agua, y sistema de vino de arroz chino.
3.3. Effects of sugars and acids
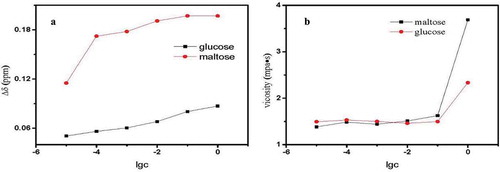
For the first time, changes were displayed in the two OH proton signals in the 1H-NMR spectra and the viscosity value with increasing sugar concentration (). Maltose is a disaccharide, and glucose is a monosaccharide. A maltose molecule consists of two molecules of glucose. As shown in , the Δδ value and viscosity of maltose are greater than glucose at the same concentration. We assumed that the dimer has a greater effect on hydrogen bonds than the monomer. From the data in , the Δδ value based on a hydroxyl group (-OH) was defined as 0.011–0.018. The viscosity of maltose and glucose reached a maximum at 1 mol/dm3, and maltose had a higher viscosity.
Figure 4. (a) Change in Δδ in the Chinese rice wine model containing glucose or maltose. (b) Effects of glucose or maltose on the viscosity of the Chinese wine.
Figura 4. (a) Cambio en Δδ en el modelo de vino de arroz chino con contenido de glucosa o maltosa. (b) Efectos de la glucosa o maltosa en la viscosidad del vino chino.
The effects of citric acid were examined at the same low concentrations on the OH proton chemical shifts in both the Chinese rice wine model and the Chinese rice wine (). At 1 × 10⁻³ mol/dm3, citric acid caused a low-field chemical shift in the Chinese rice wine model ()). Notably, in the 18% (v/v) EtOH-H2O solution without solutes, both the OH peaks of water and ethanol were distinct, as mentioned above. Even with 1 × 10⁻⁴ mol/L citric acid, the two peaks were still observed separately ()). However, the two OH peaks of ethanol and water in 1 × 10⁻¹ mol/dm3 citric acid was not shown in ); The ethanol peak was located at a much lower field of δ = 5.11). The chemical shift of the water proton peak might represent the hydrogen bond strength in this system. So, the δ value of water proton peak increased with increasing citric acid concentration ()).
Figure 5. (a), (b), and (c) The 1H-NMR spectra at different citric acid concentration in ethanol–water solutions.
Figura 5. (a), (b) y (c) Espectro 1H-NMR con distintas concentraciones de ácido cítrico en soluciones de etanol-agua.
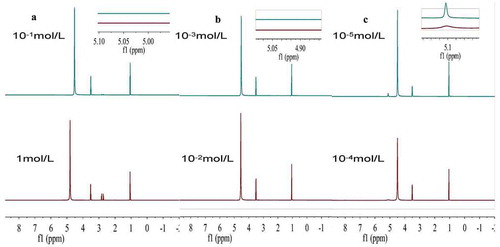
In 18% (v/v) EtOH-H2O solutions with 1.0 × 10⁻¹ mol/dm3 citric acid, the peaks of water and ethanol merged into a single peak, indicating that the proton exchange reaction between water and ethanol molecules was promoted by the dissolved citric acid (Nose & Hojo, Citation2006). The hydrogen bond lifetime is extremely short, measured in picoseconds. The unification of the two peaks indicates that the proton exchange had accelerated. As citric acid concentration increased, additional low-field chemical shift changes were simultaneously observed. The results were consistent with those of Mizuno, Miyashita, and Shindo (Citation1995). They examined the rate constants of the exchange reactions of the ethanol-water mixtures with 1H-NMR spectra, showing that the specific rate of exchange between water and ethanol was proportional to the concentration of the added acid or base.
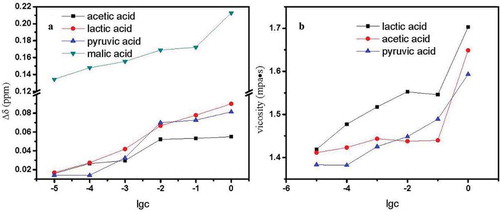
The promotion of proton exchange between water and ethanol molecules accompanied by the strengthened hydrogen bonding was observed for other acids in the Chinese rice wine model. The effects of malic acid, pyruvic acid, acetic acid, and lactic acid in Chinese rice wine were also investigated (). All acids examined caused Δδ and viscosity to increase with increasing ethanol concentration. The effects of an acid on hydrogen bonding may be divided into two aspects: the undissociated acid molecule (HA) and H+ from the acid. We concluded that acids caused the tight association between H2O and EtOH molecules. From the Δδ graph, the effect of acids on hydrogen bond association may be related to the numbers of –OH, –COOH, and –C = O groups. The acids investigated were arranged based on hydrogen bonding: malic acid, lactic acid, pyruvic acid, and acetic acid. Lactic acid has one carboxyl group (–COOH) and one hydroxyl group (–OH), and malic acid has two carboxyl groups. The value of the Δδ based on a carboxyl group was estimated to be 0.123 from comparing the value of Δδ caused by 1.0 mol/dm3 malic acid with lactic acid.
Figure 6. (a) Change in Δδ value in model Chinese rice wine containing acetic acid, lactic acid, pyruvic acid, or malic acid. (b) Effects of lactic acid, acetic acid, or pyruvic acid on the viscosity of the model Chinese wine.
Figura 6. (a) Cambios en el valor Δδ en el modelo de vino de arroz chino con contenido de ácido acético, ácido láctico, ácido pirúvico o ácido málico. (b) Efectos del ácido láctico, ácido acético o ácido pirúvico en la viscosidad del modelo de vino chino.
In the Chinese rice wine model, sugars and acids strengthen the ethanol-water structure according two detection indicators. Merged proton peaks suggested stronger hydrogen bonding than the single peak of water and ethanol in 1H-NMR.
3.4. Effects of alcohols and esters
The alcohols have an oxygen atom with strong electronegativity (Lilly, Lambrechts, & Pretorius, Citation2000; Moreira, Mendes, Hogg, & Vasconcelos, Citation2005) which caused a more stable association structure among alcoholic and water molecules ().
Figure 7. A model for the intimate association among water and ethanol molecules with the assistance of stronger hydrogen-bonding donors (alcohols).
Figura 7. Modelo para la asociación íntima entre moléculas de agua y etanol con la asistencia de donantes más fuertes para la adhesión de hidrógeno (alcoholes).
Three situations have resulted in the hydrogen bond association changing: (1) The alcoholic hydroxyl group forms an intermolecular hydrogen bond with the oxygen atom at position 1. (2) An alcohol is directly used to form a stable 12-membered ring hydrogen bond association structure. The number of 12-membered rings containing alcohol determines the strength of the hydrogen bond association in the system. (3) The number of 12-membered rings in the ethanol–water structure determines the intensity of the hydrogen bond association in the system.
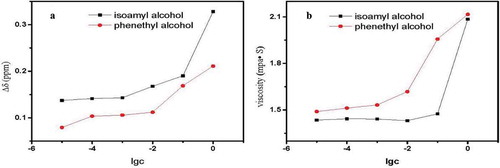
At the same alcohol concentration, the dependent Δδ value of phenylethyl alcohol was less than that of the isoamyl alcohol (). The reason for this may be that the benzene ring, as a side chain group of the alcohol, has a larger spatial structure than the long carbon chain, which is not conducive to creating associations with the original alcohol group water molecules (Lalanne, Andanson, Tassaing, Danten, & Besnard, Citation2004). Hence, a more stable association structure is formed. From the linearity between viscosity value and alcohol concentration, we determined that the dependent viscosity value of phenylethyl alcohol is greater than that of isoamyl alcohol, perhaps because the relatively strong hydrophobic interaction of the benzene ring caused the viscosity of the system to increase (Nose & Hojo, Citation2006; Nose et al., Citation2005).
Figure 8. (a) Change in Δδ value in the Chinese rice wine model containing isoamyl alcohol or phenethyalcohol. (b) Effects of isoamyl alcohol or phenethyalcohol on the viscosity of the Chinese wine model.
Figura 8. (a) Cambio en el valor Δδ en el modelo de vino de arroz chino con contenido de alcohol isoamílico o alcohol fenetílico. (b) Efecto del alcohol isoamílico o el alcohol fenetílico en la viscosidad del modelo de vino chino.
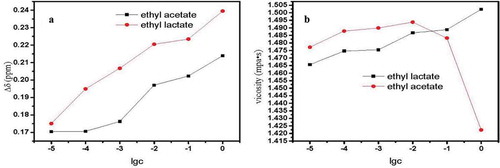
As ethyl acetate and ethyl lactate concentration increased, the Δδ value increased, accompanied by enhanced hydrogen bond association (). Additionally, the Δδ value of ethyl lactate was greater than that of ethyl acetate. Hydrolysis equilibrium was attained in the system with added esters. Ethyl lactate and ethyl acetate were separated from lactic acid and ethanol, acetic acid and ethanol, respectively. The effect of lactic acid was stronger than that of acetic acid on hydrogen bond association, aligning with the findings of previous research. The effect of ethyl acetate on the viscosity of the Chinese rice wine model first increased and then decreased with increasing ester concentration in the Chinese rice wine model. When the concentration of ethyl acetate reached 1 × 10⁻² mol/L, the viscosity of the system reached its maximum. When the concentration of ethyl acetate was more than 1 × 10⁻² mol/L, the interaction between the molecules of ethyl acetate was enhanced (Withers, John, Gwenn, John, & Alistair, Citation1994). The contribution of ethyl acetate to the system was greater than to hydrogen bonding. Therefore the viscosity of the system started to decrease due to the high viscosity of ethyl acetate.
Figure 9. (a) Change in Δδ value in the Chinese rice wine model containing ethyl acetate or ethyl lactate. (b) Effects of ethyl acetate or ethyl lactate on the viscosity of the Chinese wine model.
Figura 9. (a) Cambio en el valor Δδ en el modelo de vino de arroz chino con contenido de acetato de etilo o lactato de etilo. (b) Efectos de acetato de etilo o lactato de etilo en la viscosidad del modelo de vino chino.
3.5. Effects of aldehydes
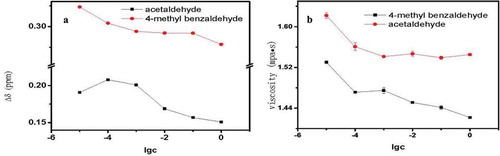
The effects of aldehydes were also investigated (). Surprisingly, we noticed that Δδ and the viscosity value decreased with increasing aldehyde concentration in the model Chinese rice wine. The carbonyl (aldehyde) group was selective for the intermolecular association of either ethanol or water. Therefore, the structure of the water and ethanol association was weakened by the presence of small amounts of aldehydes. Benzaldehyde has a benzene ring that is a larger structure than a straight chain, so affecting the association between ethanol and water was more difficult for benzaldehyde. Thus the Δδ value of benzaldehyde was greater than that of acetaldehyde at the same concentration.
Figure 10. (a) Change in Δδ value in model Chinese rice wine containing benzaldehyde or acetaldehyde. (b) Effects of benzaldehyde or acetaldehyde on the viscosity of model Chinese wine.
Figura 10. (a) Cambio en el valor Δδ en el modelo de vino de arroz chino con contenido de benzaldehído o acetaldehído. (b) Efectos de benzaldehído o acetaldehído en la viscosidad del modelo de vino chino.
4. Flavor constitutes on hydrogen bonding by applied multiple regression analysis
4.1. Multiple regression analysis (MRA)
We also analyzed the relationship between the hydrogen bonding that was affected by flavor chemicals or the chemical group. However, the primary and secondary sequences of flavor chemicals that affected the hydrogen bonding were unknown. The Plackett–Burman experiment design (Ma, Wang, Tang, & Yang, Citation2016) involves a two-part partial factor design method. Based on the principle of non-fully balanced block, the factors can be estimated using the fewest number of tests. The most important factors are selected from many factors. For our study, we used the single factor, and the Plackett–Burman experiment was performed in combination with the content range for the Chinese rice wine. The test design and response values are shown in . We observed that the unification of the two peaks was due to the combined influence of flavor matters, just like was observed for citric acid. So the chemical shift of the merged peak was considered a response value. The results are shown in . The credibility of the first two factors was about 80%.
Table 2. Experimental design and response value of Plackett–Burman for flavor constitutes.
Tabla 2. Diseño experimental y valor de respuesta de la prueba Plackett-Burman para los componentes de sabor.
Table 3. Factors, levels, and major response-effect analysis of Plackett–Burman experiments for flavor constituents.
Tabla 3. Factores, niveles y análisis del principal efecto-respuesta de experimentos Plackett-Burman para los componentes de sabor.
The multiple nonlinear regression analysis method is based on a set of data to find the relationship between the possible factors. The statistical methods applied to the expression of variables result in the best nonlinear mathematical expression. When applied multiple nonlinear regression analysis, setting the dependent variable and selecting the significant factor as independent variables are necessary. Multivariate nonlinear regression analysis was performed using alcohol content, citric acid content and malic acid content as independent variables and the chemical shift of hydrogen bonding as the dependent variable.
Multivariate nonlinear regression analysis is a holistic analysis of the degree of influence of each explanatory variable that we used to explain the relationship between comprehensive hydrogen bonding of Chinese rice wine and ingredients. Therefore, the multi-nonlinear stepwise regression method was applied. A mathematical model was selected to explain the quantitative relationship between hydrogen bonding and factors. The coefficient R2 was 0.925. The variance analysis of the equation yielded an F-value of 370.599 and a p-value of 0.000. The equation is extremely significant. Then it is possible that the developed model can predict the age of Chinese rice wine. Because there is a strong correlation between the strength of hydrogen bonding and Vintage wine. And the overall hydrogen bonding strength of Chinese rice wine can be calculated from this developed model, then the wine age can be inferred.
The regression model can be stated as:
In the formula: [J] is alcohol content, [N] is citric acid content, [P] is malic acid content.
4.2. Validated experiment
Ten different typical Chinese rice wines were purchased from the market as a group of new samples. Then we measured the alcohol content, critical acid content, and malic acid content in these new samples and put these data to the equation model that has been built. The hydrogen bonding strength of Chinese rice wine should been calculated. The results are shown in .
Table 4. Verification of the multiple regression model.
Tabla 4. Verificación del modelo de regresión múltiple.
The error range was between –0.02% and 0.18%, proving this developed model fitted the strength of hydrogen bonding in Chinese rice wine.
5. Conclusions
This study of hydrogen bonding in Chinese rice wine to control mouthfeel is a promising strategy. The index of hydrogen bonding strength was Δδ and η. Most of flavors, such as sugars and acids, caused the association between water and ethanol molecules, whereas aldehydes did not. This is also consistent with the results of fluorescence spectroscopy and it identifies more flavors than it determines the order of influence (Qiao, Zhang, & Wang, Citation2013). The value of the Δδ based on a carboxyl (-COOH) group was estimated to be 0.123, and that of a hydroxyl (-OH) group was about 0.011–0.018. The two peaks of water and ethanol combined into single peak when adding citric acid. Citric acid promoted proton exchange between water and ethanol. A more stable association among alcoholic and water molecules was built when alcohols were present. Through PB text, the influencing factors from strong to weak on the strength of the hydrogen bonding were citric acid, malic acid, maltose, benzaldehyde, ethyllactate, isoamyl alcohol, 2-phenylethyl, and ethyl acetate. The regression equation can fit the hydrogen bonding strength of Chinese rice wine. Validation experiment results show that determined regression equation can fit the hydrogen bonding strength in Chinese rice wine (R2 = 0.925).
Disclosure statement
No potential conflict of interest was reported by the authors.
Additional information
Funding
References
- Agoston, A., Ötsch, C., & Jakoby, B. (2005). Viscosity sensors for engine oil condition monitoring of China (Grant Nos. 31371844; 31071556) and Science and Technology Department, 121 (2),327–332.
- Burikov, S., Dolenko, T., Patsaeva, S., Starokurov, Y., & Yuzhakov, V. (2010). Raman and IR spectroscopy research on hydrogen bonding in water-ethanol systems. Molecular Physics, 108(18), 2427–2436.
- Campen, R. K., & Kubicki, J. D. (2010). Interaction energy and the shift in OH stretch frequency on hydrogen bonding for the H2O→H2O, CH3OH→H2O and H2O→CH3OH dimers. Journal of Computational Chemistry, 31(5), 963–972.
- Cao, Y., Xie, G., Wu, C., & Lu, J. (2010). A study on characteristic flavor compounds in traditional Chinese rice wine. Journal of the Institute of Brewing, 116(2), 182–189.
- Chen, S., & Xu, Y. (2010). The influence of yeast strains on the volatile flavour compounds of Chinese rice wine. Journal of the Institute of Brewing, 116(2), 190–196.
- Coccia, A., Indovina, P. L., Podo, F., & Viti, V. (1975). PMR studies on the structures of water-ethyl alcohol mixtures. Chemical Physics, 7(1), 30–40.
- Dimitroulis, C., Kainourgiakis, E., Raptis, V., & Samios, J. (2015). Molecular dynamics study of the local structure and diffusivity of partially miscible water/n-alcohols binary mixtures. Journal of Molecular Liquids, 205, 46–53.
- Dixit, S., Crain, J., Poon, W. C. K., Finney, J. L., & Soper, A. K. (2002). Molecular segregation observed in a concentrated alcohol–Water solution. Nature, 416, 829–832.
- Dougan, L., Bates, S. P., Hargreaves, R., Fox, J. P., Crain, J., Finney, J. L., … Soper, A. K. (2004). Methanol-water solutions: A bi-percolating liquid mixture. The Journal of Chemical Physics, 121(13), 6456–6462.
- Franks, F. T., & Ives, D. (1966). The structural properties of alcohol–Water mixtures quarterly reviews. Chemical Society, 20(1), 1–44.
- Funasaki, N., Nomura, M., Ishikawa, S., & Neya, S. (2001). NMR chemical shift references for binding constant determination in aqueous solutions. The Journal of Physical Chemistry B, 105, 7361–7365.
- Gereben, O., & Pusztai, L. (2015). Investigation of the structure of ethanol-water mixtures by molecular dynamics simulation I: Analyses concerning the hydrogen-bonded pairs. The Journal of Physical Chemistry B, 119(7), 3070–3084.
- Lalanne, P., Andanson, J. M., Tassaing, T., Danten, Y., & Besnard, M. (2004). Hydrogen bonding in supercritical ethanol assessed by infrared and Raman. The Journal of Physical Chemistry A, 108, 3902–3909.
- Lilly, M., Lambrechts, M. G., & Pretorius, I. S. (2000). Effect of increased yeast alcohol acetyltransferase activity on flavor profiles of wine and distillates. Applied and Environmental Microbiology, 66(2), 744–753.
- Ma, L., Wang, L., Tang, J., & Yang, Z. (2016). Optimization of arsenic extraction in rice samples by Plackett–Burman design and response surface methodology. Food Chemistry, 204, 283–288.
- Matsugami, M., Yamamoto, R., Kumai, T., Tanaka, M., Umecky, T., & Takamuku, T. (2016). Hydrogen bonding in ethanol–Water and trifluoroethanol–Water mixtures studied by NMR and molecular dynamics simulation. Journal of Molecular Liquids, 217, 3–11.
- Mizuno, K., Kimura, Y., Morichika, H., Nishimura, Y., Shimadab, S., Maeda, S., … Ochi, T. (2000). Hydrophobic hydration of tert-butyl alcohol probed by NMR and IR. Journal of Molecular Liquids, 85, 139–152.
- Mizuno, K., Miyashita, Y., & Shindo, Y. (1995). NMR and FT-IR studies of hydrogen bonds in ethanol-water mixtures. The Journal of Physical Chemistry, 99, 3225–3228.
- Mo, X., Fan, W., & Xu, Y. (2009). Changes in volatile compounds of Chinese rice wine wheat Qu during fermentation and storage. Journal of the Institute of Brewing, 115(4), 300–307.
- Mo, X., Fan, W., & Xu, Y. (2012). Changes in volatile compounds of Chinese rice wine wheat qu during fermentation and storage. Journal of the Institute of Brewing, 115(4), 300–307.
- Mo, X., Xu, Y., & Fan, W. (2010). Characterization of aroma compounds in Chinese rice wine Qu by solvent-assisted flavor evaporation and headspace solid-phase microextraction. Journal of Agricultural and Food Chemistry, 58(4), 2462–2469.
- Moreira, N., Mendes, F., Hogg, T., & Vasconcelos, I. (2005). Alcohols, esters and heavy sulphur compounds production by pure and mixed cultures of apiculate wine yeasts. International Journal of Food Microbiology, 103, 285–294.
- Murthy, S. (1999). Detailed study of ice clathrate relaxation: Evidence for the existence of clathrate structures in some water-alcohol mixtures. The Journal of Physical Chemistry A, 103(40), 7927–7937.
- Nauta, K., & Miller, R. E. (2000). Formation of cyclic water hexamer in liquid helium: the smallest piece of Ice. Science, 287(5451), 293–295.
- Nishi, N., Koga, K., Ohshima, C., Yamamoto, K., Nagashima, U., & Nagami, K. (1988). Molecular association in ethanol-water mixtures studied by mass spectrometric analysis of clusters generated through adiabatic expansion of liquid jets. Journal of the American Chemical Society, 110(16), 5246–5255.
- Nose, A., Hamasaki, T., Hojo, M., Kato, R., Uehara, K., & Ueda, T. (2005). Hydrogen bonding in alcoholic beverages (distilled spirits) and water− ethanol mixtures. Journal of Agricultural and Food Chemistry, 53, 7074–7081.
- Nose, A., & Hojo, M. (2006). Hydrogen bonding of water-ethanol in alcoholic beverages. Journal of Bioscience and Bioengineering, 102(4), 269–280.
- Nose, A., Masasjo, H., & Ueda, T. (2004). Effects of salts, acids, and phenols on the hydrogen-bonding structure of water−ethanol mixtures. The Journal of Physical Chemistry B, 108, 798–804.
- Oliveira, B. G., & Vasconcellos, M. L. A. (2006). Hydrogen bonds in alcohols: Watercomplexes: A theoretical study about new intramolecular interactions via CHELPG and AIM calculations. Journal of Molecular Structure: THEOCHEM, 774, 83–88.
- Qiao, H., Zhang, S., & Wang, W. (2013). Fluorescence spectroscopic and viscosity studies of hydrogen bonding in Chinese Fenjiu. Journal of Bioscience & Bioengineering, 115(4), 405–411.
- Sato, T., & Buchner, R. (2003). The cooperative dynamics of the H-bond system in 2-propanol/water mixtures: Steric hindrance effects of nonpolar head group. The Journal of Chemical Physics, 119, 10789–10800.
- Sato, T., & Buchner, R. (2004). Dielectric relaxation processes in ethanolwater mixtures. The Journal of Physical Chemistry A, 108, 5007–5015.
- Schwerdtfeger, S., Köhler, F., Potte, R., & Kaatze, U. (2001). Dielectric relaxation of hydrogen bonded liquids Mixtures of monohydric alcohols with n-alkanes. The Journal of Chemical Physics, 115, 4186–4194.
- Shen, F., Ying, Y., Li, B., Zheng, Y., & Hu, J. (2011). Prediction of sugars and acids in Chinese rice wine by mid-infrared spectroscopy. Food Research International, 44, 1521–1527.
- Thompson, J. W., Kaiser, T. J., & Jorgenson, J. W. (2006). Viscosity measurements of methanolof methanolrice wine by mid-infrared spectroscopy. ohy to 3500bar using a novel capillary time-of-flight viscometer. Journal of Chromatography A, 113(4), 201–209.
- Withers, S. J., John, R. P., Gwenn, L., John, M. C., & Alistair, P. (1994). Factors affecting pungency of malt distillates. Journal of Sensory Studies, 10, 273–283.
- Yu, H., Ying, Y., Fu, X., & Lu, H. (2006). Quality determination of Chinese rice wine based on Fourier transform near infrared spectroscopy. Journal of near Infrared Spectroscopy, 14(1), 37–44.