
 ?Mathematical formulae have been encoded as MathML and are displayed in this HTML version using MathJax in order to improve their display. Uncheck the box to turn MathJax off. This feature requires Javascript. Click on a formula to zoom.
ABSTRACT
Sesame bran (SB) is a by-product of the food industry. The objective of the present study was to characterize SB for its content of bioactive compounds (individual phenolic and lignan compounds, fiber, minerals, and calcium bioaccessibility), antioxidant capacity and proximate analysis. SB presented high levels of insoluble fiber, free calcium (~1400 mg/kg), protein (~90 g/kg), and free ferulic acid (~1950 mg/kg). Likewise, sesamol was identified as one of the major lignans (~550 mg/kg) in SB, which has been regarded as a promising antimutagenic antioxidant compound. Results indicate that SB can be considered an adequate source of bioactive compounds and used in the formulation of low calorie and high fiber foods.
RESUMEN
El salvado de ajonjolí (SA) es un sub-producto de la industria de alimentos. El objetivo del presente trabajo fue caracterizar al SA en su contenido de compuestos bioactivos (compuestos fenólicos y lignanos individuales, fibra, vitamina C, minerales y la bioaccesibilidad del calcio), la capacidad antioxidante y análisis proximal. El SA presentó altos niveles fibra insoluble, calcio libre (~1400 mg/kg), proteína (~90 g/kg) y ácido ferúlico libre (~1950 mg/kg). Así mismo, se identificó a sesamol como uno de los lignanos principales (~550 mg/kg), el cual se ha señalado como un prometedor compuesto antioxidante antimutagénico. Los resultados sugieren que SA puede considerarse una fuente adecuada de compuestos bioactivos y utilizarse en la formulación de alimentos bajos en calorías y altos en fibra.
1. Introduction
The food manufacturing and processing sectors alone, contribute approximately 5 megatons of food waste per year (Parfitt, Barthel, & Macnaughton, Citation2010). In United States, for example, approximately 3.4 million tons of grain by-products are produced only from the brewing industry (Gupta, Abu‐Ghannam, & Gallaghar, Citation2010). Grain processing by-products have high nutritional and nutraceutical value (Ravindran & Jaiswal, Citation2016) and the food-manufacturing sector is starting to reuse them (Sharif, Butt, Anjum, & Khan, Citation2014). Cereal and oilseed by-products, like bran, contain high dietary fiber concentration, which has been used by food industry to fortify their products and decrease calories consumption leading to diets with higher nutraceutical properties (Elleuch et al., Citation2011; Kumar & Krishna, Citation2015).
Sesame bran (SB) is a by-product commonly discarded or utilized as animal food (Elleuch, Besbes, Roiseux, Blecker, & Attia, Citation2007). SB contains almost 680 g per kg of dietary fiber with health effects, such as preventing constipations, colon-rectal diseases, diabetes and obesity (Elleuch et al., Citation2011; Jung, Heo, & Wang, Citation2008). SB also contains phenolic compounds which possess antioxidant, antimutagenic and antimicrobial activities (Jacobo-Velázquez & Cisneros-Zevallos, Citation2009). Other nutraceutical compounds present in SB are lignans (Kang, Naito, Sakai, Uchida, & Osawa, Citation1999) and several minerals, like potassium (4.6–5.3 g/kg), phosphorus (1.7–2.3 g/kg) magnesium (0.018–0.052 g/kg), and calcium in high concentration (9.6–12.8 g/kg) (Alyemeni, Basahy, & Sher, Citation2011; Zouari, Besbes, Ellouze-Chaabouni, & Ghribi-Aydi, Citation2016)
However, research is needed to determine a complete nutraceutical profile of SB, in order to promote its utilization as a nutraceutical ingredient. Therefore, the objective of the present study was to evaluate the concentration of free and bond phenolics, lignans, antioxidant capacity (ORAC value), dietary fiber, minerals (calcium, magnesium, iron, and zinc), calcium bioaccessibility and proximate analysis in SB.
2. Materials and methods
2.1. Sesame bran samples and chemicals
SB samples were obtained from DIPASA Internacional de México S.A. de C.V. (Cortazar, Guanajuato, MX). Sodium phosphate monobasic, sodium phosphate dibasic, sodium hydroxide (NaOH), sodium bicarbonate (NaHCO3), hexane, hydrochloric acid (HCl), ethanol (HPLC grade), ethyl acetate, and phosphoric acid were purchased from Desarrollo de Especialidades Químicas S.A. de C.V. (San Nicolás de los Garza, Nuevo León, MX). The other chemicals were obtained from Sigma-Aldrich Co. (St. Louis, MO, USA).
2.2. Extraction of free and bound phenolic compounds
Free phenolic compounds in SB were extracted using the method described by Gutiérrez-Uribe, Rojas-García, García-Lara, and Serna-Saldívar (Citation2010). Briefly, SB (1 g) was mixed (10 min) with 80% ethanol (10 mL) in a shaker (50 rpm). Then, the mixture was centrifuged (2500 rpm, 10 min, 4°C, SL16R, Thermo Scientific, GER) to recover the supernatant. The extracts were concentrated to dryness (35°C) using a vacuum evaporator (EZ-2.3, Genevac Ltd., Ipswich, UK). Finally, the extract was resuspended in 50% methanol (2 mL). The resuspended extract (further referred as free phenolic extract) was used for the quantification of free phenolic compounds.
Bound phenolic compounds in SB were extracted using the method described by Adom and Liu (Citation2002). After extraction of free phenolics, the pellet was resuspended in NaOH (10 mL, 2 M, room temperature) and nitrogen was flushed to displace oxygen excess in the tube. Samples were hydrolyzed in a shaking water bath (60 rpm, 30 min, 95°C), followed by shaking (50 rpm, 60 min, room temperature). Then, the hydrolysate was neutralized with HCl (2 mL, 6 N). To remove lipids, hexane (10 mL) was added and discarded. The final solution was extracted three times with ethyl acetate (10 mL) and then was evaporated to dryness (35°C) using a vacuum evaporator (EZ-2.3, Genevac Ltd., Ipswich, UK). Finally, the extract was resuspended in 50% methanol (2 mL). The resuspended extract (further referred as bound phenolic extract) was used for the quantification of total and individual bound phenolic compounds.
2.3. Quantification of total and individual free and bound phenolic compounds
Total phenolic content was determined by adding the phenolic concentrations of free and bound phenolic extracts. Total phenolic concentrations were determined by the Folin-Ciocalteu colorimetric method adapted to 96-well microplate format described by Sánchez-Rangel, Benavides, Heredia, Cisneros-Zevallos, and Jacobo-Velázquez (Citation2013). The concentration of total phenolics was expressed as mg of Gallic acid equivalents (GAE) per kg of SB dry weight (DW).
The identification and quantification of individual phenolics in the free and bound phenolic extracts was performed by high-performance liquid chromatography (HPLC) coupled with a diode array detection (DAD; 1260 Infinity, Agilent Technologies, Santa Clara, CA, USA) using a 4.6 mm × 250 mm, 5 µm C18 reverse phase column (Luna, Phenomenex, Torrance, CA, USA). The mobile phases consisted of water (phase A) and methanol:water (60:40, v:v, phase B) adjusted to pH 2.4 with ortophosphoric acid. The gradient solvent system was 0/100, 3/70, 8/50, 35/30, 40/20, 45/0, 50/0, 60/100 (min/% phase A) at a flow rate of 0.8 mL/min. The injection volume was 10 μL.
The identification of individual phenolic compounds was based on their DAD spectrum and retention time as compared with previous report (Becerra-Moreno, Benavides, Cisneros-Zevallos, & Jacobo-Velázquez, Citation2012) and authentic standards. Chromatograms were recorded at 280 and 320 nm. For the quantification of phenolic acids standard curves of ferulic acid, p-coumaric acid, protocatechuic acid, and Gallic acid were prepared at a range of 5–75 mg/L. Results were expressed as mg of each individual phenolic compounds per kg of SB DW.
2.4. Extraction, identification, and quantification of lignans
Lignan compounds were extracted using the method described by Chang, Yen, Huang, and Duh (Citation2002) with some modifications. SB (4 g) was mixed with methanol (40 mL) on a shaker (250 rpm, 12 h, room temperature). The mixture was then centrifuged (10,000 rpm, 15 min, 4°C, SL16R, Thermo Scientific, GER) and the supernatant were stored at 4°C. The residue was re-extracted once again under the same conditions. The combined extracts were concentrated to 5 mL (35°C) using a vacuum evaporator (EZ-2.3, Genevac Ltd., Ipswich, IN).
Lignans were identified and quantified by HPLC-DAD (1260 Infinity, Agilent Technologies, Santa Clara, CA, USA) using a 4.6 mm × 250 mm, 5 μm C18 reverse phase column (Luna, Phenomenex, Torrance, CAUSE). The mobile phases consisted of water (phase A) and methanol (phase B). The gradient solvent system was a linear increase of 10%–90% of methanol from 0 to 70 min with a post-time of 5 min at a flow rate of 0.8 mL min−1. The injection volume was 10 μL.
The identification of individual lignan compounds was based on their DAD spectrum (Budowski, O’connor, & Field, Citation1951; Sukumar, Arimboor, & Arumughan, Citation2008) and retention time (Bhatnagar, Hemavathy, & Krishna, Citation2015; Chang et al., Citation2002) as compared with previous reports and authentic standards. Chromatograms were recorded at 230 nm. For the quantification of lignan compounds, standard curve of sesamin was prepared at a range of 20–2000 mg/L. The results were expressed as mg of sesamin equivalents per kg of SB DW.
2.5. Determination of total antioxidant capacity (ORAC value)
The antioxidant capacity of the free and bound phenolic extracts was determined with the oxygen radical absorbance capacity (ORAC) assay. The ORAC value was obtained using the procedure described by Huang, Ou, Hampsch-Woodill, Flanagan, and Prior (Citation2002) for hydrophilic ORAC. Results were expressed as µmol of trolox equivalents (TE) per kg of SB DW.
2.6. Proximate, mineral and dietary fiber analyses
Proximate, minerals and dietary fiber analyses were performed using the following methods: total carbohydrates (by difference), ash (dry ashing method), total fat (Soxhlet method), protein (Kjendalhl method), moisture (AACC 44–15.02), calcium (AOAC 945.04), iron (AOAC 945.04), zinc (AOAC 999.11), total dietary fiber (AOAC 985.29), soluble dietary fiber (AOAC 993.49), and insoluble dietary fiber (AOAC 991.42).
2.7. Determination of calcium bioaccessibility
The determination of calcium bioaccessibility was performed following the dialysis and solubility methods. Pepsin solution was obtained by dissolving pepsin (1.6 g) in 10 mL of HCl (0.1 M). The solution of pancreatin and bile salts was prepared by dissolving pancreatin (0.4 g) and bile salt (2.5 g) in 100 mL of NaHCO3 (0.1 M). The dialysis membranes were rinsed several times with deionized-distilled water before use.
The dialysis method was performed as previously described by Cámara, Amaro, Barberá, and Clemente (Citation2005) with slight modifications. Samples of SB (40 and 20 g) were homogenized with deionized-distilled water (210 and 180 g), and the pH was adjusted to 2.0 with HCl (6 N). To carry out pepsin–HCl digestion, pepsin solution (7.5 g/kg of sample) was added. The mixture was then incubated (2 h, 37°C) in a shaker. A dialysis tubing cellulose membrane (molecular mass cut-off value 10–12,000 Da) containing water (25 mL) and an amount of NaHCO3 equivalent to the titratable acidity was placed in the flasks, together with aliquots (30 g) of the pepsin digest. Incubation continued for 45 min, then pancreatic bile salt mixture (7.5 mL) was added and incubation continued up to 2 h. After incubation, the solution inside dialysis tubes was recovered and weighed.
The solubility method was performed as previously described by Sahuquillo, Barberá, and Farré (Citation2003) with slight modifications. Pepsin-HCl digestion was carried out as mentioned in the dialysis method. Prior to the intestinal digestion step, the pH of the gastric digest was raised to 5.0 by addition of NaHCO3 (1 M). Then, pancreatin–bile salt mixture (18.8 mL) was added to the gastric digest (100 g) and incubation was continued up to 2 h. To stop intestinal digestion, the sample was maintained for 10 min in an ice bath. The pH was adjusted to 7.2 by addition of NaOH (0.5 M). Aliquots (20 g) of digested sample were transferred to centrifuge tubes and centrifuged (3,500 g, 1 h, 4°C, SL16R, Thermo Scientific, GER). Then, the supernatant (soluble fraction) was collected. Bioaccessibility (%) was calculated as follows:
Where:
A: calcium content of the bioaccessible fraction (mg calcium/g SB)
C: soluble calcium content (mg calcium/g SB)
B and D: total calcium content of the sample (mg calcium/g SB).
2.8. Data analysis
Values reported for the phytochemical characterization of SB represent the mean of three repetitions ± the standard error of the mean.
3. Results and discussion
3.1. Content of fiber, minerals, proximate analysis and calcium bioaccessibility of sesame bran
The content of total, insoluble and soluble fiber, minerals and proximate analysis of SB is shown in . The values obtained for total, insoluble and soluble fiber are similar to those previously reported in SB (Elleuch et al., Citation2007; Nandi & Ghosh, Citation2015). Soluble dietary fiber content in SB (91 g/kg) was higher as compared to the main cereal bran sources (rice bran 22 g/kg, corn bran 26 g/kg and wheat bran 34 g/kg) and similar to oat bran (91 g/kg) (Dikeman, Murphy, & Fahey, Citation2006). Regarding insoluble fiber, the content (298 g/kg) was lower as compared to corn (706 g/kg) and wheat bran (463 g/kg), similar to rice bran (262 g/kg) and higher than oat bran (104 g/kg) (Dikeman et al., Citation2006).
Table 1. Content of fiber, minerals and proximate analysis of sesame bran.
Tabla 1. Contenido de fibra, minerales y análisis proximal de salvado de ajonjolí.
Cereal grains are one of the main fiber sources in human diet. However, oilseeds, like sesame, has recently gained attention since its bran fraction has similar content of this nutraceutical as demonstrate in the present study and in a previous report (Elleuch et al., Citation2007). Other fiber characteristics studied in SB fraction (i.e. water-holding capacity, oil-holding capacity, emulsifying capacity, and antioxidant activity) indicates that SB could be used as an innovative food ingredient for the design of new nutraceutical-added food products with improved physicochemical and sensory characteristics (Nandi & Ghosh, Citation2015). However, the amount of SB that can be added is finite because it may cause undesirable changes to flavor, color and texture of foods (Elleuch et al., Citation2014).
The values obtained for minerals, except calcium, are in the range of those previously reported in SB (Elleuch et al., Citation2007). Calcium was the predominant mineral followed by magnesium. Calcium value (16,370 mg/kg) in SB is high compared to other commonly consumed brans, including wheat, (760 mg/kg), oat (580 mg/kg), corn (420 mg/kg), and rye bran (240 mg/kg) (Kamal-Eldin et al., Citation2009; USDA, Citation2017). Regarding magnesium content (4300 mg/kg), this is high compared to rye (3800 mg/kg), oat (2350 mg/kg), and corn bran (700 mg/kg) and similar to wheat bran (6100 mg/kg) (Kamal-Eldin et al., Citation2009; USDA, Citation2017).
Calcium concentration in SB was comparable to the content present in the low-fat cheese (15,250 mg/kg FW), one of the most important calcium sources in human diets (USDA, Citation2017). However, calcium in low-fat cheese and other dairy products is found free for absorption in higher concentration as compared with cereal and oilseed brans, which contain antinutritional factors (i.e. oxalic acid) that binds minerals.
Since SB contains around 5% oxalic acid, which chelates calcium (Chang et al., Citation2002), analysis of bioaccessibility was performed. The solubility and the dialysis methods to evaluate calcium bioaccessibility showed values of 8.6 and 6.5%, respectively, indicating ~1407 and 1064 mg/kg of free calcium, respectively. Both values remain higher compared even to calcium content in wheat, oat, corn and rye bran (Kamal-Eldin et al., Citation2009; USDA, Citation2017). Since dairy products are the major dietary sources of free calcium, factors like lactose intolerance, and low-fat diets leads to the identification of alternative free calcium sources. Thus, SB is an alternative vegetable source of free calcium.
Values for moisture, total carbohydrates, ash, and total fat, were similar to those previously reported for SB (Elleuch et al., Citation2007). Regarding protein content (940 g/kg), this was lower than the protein present in oat (173.0 g/kg), wheat (1550 g/kg), and rice bran (133 g/kg), but comparable to corn bran (83.6 g/kg) (USDA, Citation2017).
3.2. Total phenolics and antioxidant capacity (ORAC) of sesame bran
Total phenolic compounds and antioxidant capacity of SB are shown in . The values obtained for total phenolic compounds were lower than those previously reported for SB (9290; 5980; 2600 mg GAE/kg) (Elleuch et al., Citation2011, Citation2007). This difference could be attributed to changes in polyphenol extraction techniques, the sesame cultivar sources of the hull used in the study and the operational steps applied to each sesame hull. Total phenolic content in SB was similar as compared to other commonly consumed brans like wheat (500–2630 mg GAE/kg) (Zhou & Yu, Citation2004) and rye bran (130 mg GAE/100 g) (Kahkonen et al., Citation1999) and higher compared to oat bran (40 mg GAE/100 g) (Kahkonen et al., Citation1999)
Table 2. Total phenolic compounds and antioxidant capacity (ORAC value) of sesame bran.
Tabla 2. Compuestos fenólicos totales y capacidad antioxidante (valor ORAC) de salvado de ajonjolí.
Regarding total antioxidant capacity, the values previously reported for SB were obtained by the DPPH method (Chang et al., Citation2002; Nandi & Ghosh, Citation2015). Thus, the values obtained in those studies are not comparable with antioxidant activity value (120,750 µmol TE/kg) obtained herein. ORAC value in SB was relatively high compared to oat bran (90,200 µmol TE/kg) but relatively lower compared to wheat (293,100 µmol TE/kg) and rye bran (244,400 µmol TE/kg) (Hosseinian & Mazza, Citation2009). A possible explanation for the lower antioxidant activity regardless similar concentrations of total phenolics could be due to differences in the phenolic profiles found in different materials (Jacobo-Velázquez & Cisneros-Zevallos, Citation2009). Likewise, other antioxidant compounds, such as lignans and terpenoids, have already been shown to be present in alcoholic extracts of sesame coat, which also posses antioxidant and antimutagenic capacities (Chang et al., Citation2002; Lazarou, Grougnet, & Papadopoulos, Citation2007).
To our knowledge, this is the first report separating total phenolic and ORAC value in their free and bound forms in SB. There is only one previous report, but in sesame seed without specifying if the seed was complete or dehulled (Zhou, Lin, Abbasi, & Zheng, Citation2016). Thus, results obtained herein are not comparable. Literature indicates that most phenolic compounds associated with grains, oilseeds, fruits and vegetables, are primarily found in the outer layers (bran and peel fraction, respectively) and bound to hemicelluloses in the cell wall (Adom & Liu, Citation2002; Dueñas, Hernández, & Estrella, Citation2002; Elleuch et al., Citation2007; Kahkonen et al., Citation1999; Shahidi & Liyana-Pathirana, Citation2005).
However, phenolics in their bound form can be converted into their free form due to industrial processing such as heating, alkaline or acid treatment, roasting, stirring, grinding, and extrusion (De La Parra, Serna-Saldivar, & Liu, Citation2007; Elleuch et al., Citation2011; Gutiérrez-Uribe et al., Citation2010). All this explained by the destruction of the coherence of the cell walls and further phenolic liberation (Bertin, Rouau, & Thibault, Citation1988). Most phenolics were present in their free form, which can be explained by all the industrial operational steps (soaking, heating, milling, and drying) applied to the seed.
3.3. Individual phenolic compounds in SB
A typical HPLC-DAD phenolic chromatogram (shown at 320 nm) obtained from SB phenolic extract is shown in . The chemical structure of phenolics identified are shown in . The identifications and quantifications of individual phenolic compounds present in SB are reported in .
Table 3. Identification and quantification of phenolic (free, bound, and lignans) compounds in sesame bran.
Tabla 3. Identificación y cuantificación de compuestos fenólicos (libres, ligados y lignanos) en salvado de ajonjolí.
Figure 1. Typical HPLC-UV chromatogram (shown at 320 nm) of phenolic compounds from sesame bran. Identification of the chromatographic peaks was performed as indicated in . Extraction procedures and chromatographic conditions for the analyses of free and bound phenolics (chromatogram A, compounds 1–5) are different than the procedures and chromatographic conditions applied for the identification of lignans (chromatogram B, compounds 6–8). Peak assignments: (1) Gallic acid, (2) protocatechuic acid, (3) ferulic acid derivative, (4) p-coumaric acid, (5) ferulic acid, (6) sesamol, (7) sesamin and (8) sesamolin.
Figura 1. Cromatograma HPLC-UV típico (mostrado a 320 nm) de compuestos fenólicos presentes en salvado de ajonjolí. La identificación de los compuestos fenólicos se realizó como se indica en la . Los procedimientos de extracción y análisis cromatográfico de compuestos fenólicos libres y ligados (cromatograma A, compuestos 1–5) son diferentes que los empleados para la extracción y análisis de lignanos (cromatograma B, compuestos 6–8). Asignación de picos: (1) ácido gálico, (2) ácido protocatecúico, (3) derivado de ácido ferúlico, (4) ácido p-cumárico, (5) ferulic acid, (6) sesamol, (7) sesamin, (8) sesamolin.
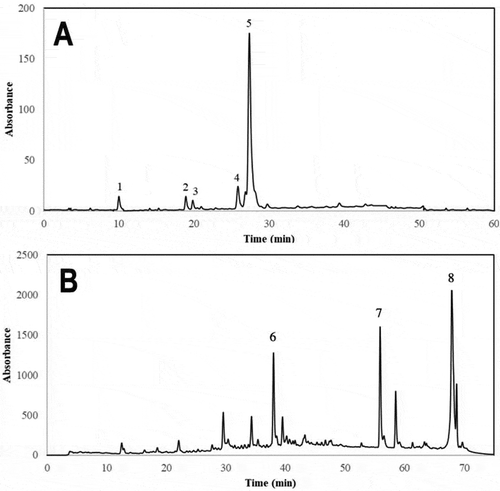
Figure 2. Chemical structure of phenolic compounds identified in sesame bran. Gallic acid (1), protocatechuic acid (2), ferulic acid derivative (3), p-coumaric acid (4), ferulic acid (5), sesamol (6), sesamin (7) and sesamolin (8). The numbering corresponds to the peak number assigned in .
Figura 2. Estructura química de los compuestos fenólicos identificados en salvado de ajonjolí. Ácido gálico (1), ácido protocatecúico (2), derivado de ácido ferúlico (3), ácido p-cumárico (4), ácido ferúlico (5), sesamol (6), sesamina (7), sesamolina (8). El número corresponde a número de pico asignado en la .
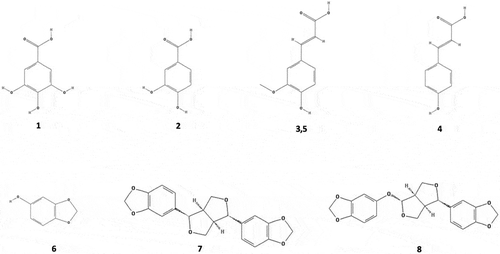
All phenolics identified, except for ferulic acid derivative, have been previously reported in several oilseed flours and meals (Schmidt & Pokorný, Citation2005). In addition, they have been reported in whole sesame seed (Hassan, Citation2012).
The phenolic that showed the highest concentration in both, bound and free form was the ferulic acid (). This phenolic acid is generally concentrated in the outer layer of cereal grains in its bound form (Ndolo & Beta, Citation2014). Among the grain brans, maize bran contains ferulic acid at the highest level, followed by wheat bran. These two are the main bran sources of ferulic acid in the human diet (Boz, Citation2015). SB showed lower amounts of bound ferulic acid (887.5 mg/kg) as compared with those present in wheat (1598 mg/kg) and rye bran (1212 mg/kg) and higher levels than those present in oat bran (405 mg/kg) (Hosseinian & Mazza, Citation2009).
Free ferulic acid represent the 53% of the total free phenolic compounds while bound ferulic acid represent only the 24% of the total bound phenolic compounds (). These results are different than those previously reported in literature, which reported higher bound than free ferulic acid in cereals (Adom & Liu, Citation2002) and higher levels of bound phenolic forms in oilseeds (Schmidt, Pokorný, Vajdák, Sekretár, & Gordon, Citation2003; Shahidi & Naczk, Citation2004), indicating the important contribution of unit operations applied to SB for phenolic liberation from the destabilized cell wall. Free phenolic forms are well known to be better absorbed and bioavailable (D’Archivio, Filesi, Varì, Scazzocchio, & Masella, Citation2010).
Results presented herein suggests that SB could be exploited as a natural source for the extraction and purification of ferulic acid for its further commercialization in the dietary supplement and food industries. However, optimization of critical parameters for isolation is essential for its high yield due to its covalent ligation to other elements such as carbohydrates (Kumar & Pruthi, Citation2014).
3.4. Individual lignan compounds in sesame bran
The typical HPLC-DAD lignan chromatogram (shown at 230 nm) obtained from SB is shown in . The identifications and quantifications of individual lignan compounds present in SB are reported in and included sesamol, sesamin, and sesamolin. The chemical structure of lignans identified are shown in . Although the main lignans present in SB were identified in the present study, additional peaks were detected and requires further identification work with other analytical techniques such as mass spectrometry (). These compounds may be derivatives of lignans that are produced during oilseed processing (Yoshida, Shigezaki, Takagi, & Kajimoto, Citation1995).
The lignan compound that showed the highest concentration was sesamolin. These results are consistent with previous reports on the identification of the main lignan compounds present in SB (Chang et al., Citation2002; Elleuch et al., Citation2007). In the present investigation, sesamol was found, probably due to the conversion of sesamolin to sesamol during roasting process of the coat as previously reported (Mohamed & Awatif, Citation1998; Yoshida et al., Citation1995; Yoshida & Takagi, Citation1997). Since sesamin and sesamolin make no contribution to the antioxidant activity of alcoholic extracts (Chang et al., Citation2002), the presence of sesamol is very relevant. High antioxidant activities of this lignan compound have been reported protecting cell membrane against lipid peroxidation and preventing LDL oxidation (Dar & Arumugam, Citation2013). Thus, promising antimutagenic properties of alcoholic extract of the sesame coat have been reported (Lazarou et al., Citation2007).
4. Conclusions
One of the new approaches to sustainability focuses on eliminating food waste. Thus, the food industry generated a variety of strategies to address this issue. One approach could be eliminating waste from processes by reintegrating by-products in new formulations. The most significant contribution of this work is to propose a waste material as a new ingredient for food formulations. SB evaluated in the present study contained higher levels of calcium and similar levels of dietary fiber and antioxidant compounds as compared with other bran sources such as wheat, rye, maize, and oat bran. Although calcium present in SB was mostly bind, the content of free calcium was higher than values previous reported for other bran sources. Furthermore, the content of free phenolics was higher than expected, indicating that processing conditions are crucial for obtaining the final phytochemical profiles of cereal and oilseed brans. Results presented herein suggests that SB could be exploited as a food ingredient and as a source of bioactive compounds. Thus, SB has potential applications in the food and dietary supplement industries.
Acknowledgments
We would like to thank DIPASA Internacional de México S.A. de C.V. for providing SB samples evaluated.
Disclosure statement
No potential conflict of interest was reported by the authors.
Additional information
Funding
References
- Adom, K. K., & Liu, R. H. (2002). Antioxidant activity of grains. Journal of Agricultural and Food Chemistry, 50(21), 6182–6187.
- Alyemeni, M. N., Basahy, A. Y., & Sher, H. (2011). Physico-chemical analysis and mineral composition of some sesame seeds (Sesamum indicum L.) grown in the Gizan area of Saudi Arabia. Journal of Medicinal Plants Research, 5(2), 270–274.
- Becerra-Moreno, A., Benavides, J. A., Cisneros-Zevallos, L., & Jacobo-Velázquez, D. A. (2012). Plants as biofactories: Glyphosate-induced production of shikimic acid and phenolic antioxidants in wounded carrot tissue. Journal of Agricultural and Food Chemistry, 60(45), 11378–11386.
- Bertin, C., Rouau, X., & Thibault, J. F. (1988). Structure and properties of sugar beet fibres. Journal of the Science of Food and Agriculture, 44, 15–29.
- Bhatnagar, A. S., Hemavathy, J., & Krishna, A. G. (2015). Development of a rapid method for determination of lignans content in sesame oil. Journal of Food Science and Technology, 52(1), 521–527.
- Boz, H. (2015). Ferulic acid in cereals: A review. Czech Journal of Food Science, 33(1), 1–7.
- Budowski, P., O’connor, R. T., & Field, E. T. (1951). Sesame oil. VI. Determination of sesamin. Journal of the American Oil Chemists’ Society, 28(2), 51–54.
- Cámara, F., Amaro, M., Barberá, R., & Clemente, G. (2005). Bioaccessibility of minerals in school meals: Comparison between dialysis and solubility methods. Food Chemistry, 92(3), 481–489.
- Chang, L. W., Yen, W. J., Huang, S. C., & Duh, P. D. (2002). Antioxidant activity of sesame coat. Food Chemistry, 78(3), 347–354.
- D’Archivio, M., Filesi, C., Varì, R., Scazzocchio, B., & Masella, R. (2010). Bioavailability of the polyphenols: Status and controversies. International Journal of Molecular Sciences, 11(4), 1321–1342.
- Dar, A. A., & Arumugam, N. (2013). Lignans of sesame: Purification methods, biological activities and biosynthesis – A review. Bioorganic Chemistry, 50, 1–10.
- De La Parra, C., Serna-Saldivar, S. O., & Liu, R. H. (2007). Effect of processing on the phyochemical profiles and antioxidant activity of corn for production of masa, tortillas, and tortilla chips. Journal of Agriculture and Food Chemistry, 55(10), 4177–4183.
- Dikeman, C. L., Murphy, M. R., & Fahey, G. C. (2006). Dietary fibers affect viscosity of solutions and simulated human gastric and small intestinal digesta. Journal of Nutrition, 136, 913–919.
- Dueñas, M., Hernández, T., & Estrella, I. (2002). Phenolic composition of the cotyledon and the seed coat of lentils (Lens culinaris L.). European Food Research and Technology, 215, 478–483.
- Elleuch, M., Bedigian, D., Maazoun, B., Besbes, S., Blecker, C., & Attia, H. (2014). Improving halva quality with dietary fibres of sesame seed coats and date pulp, enriched with emulsifier. Food Chemistry, 145, 765–771.
- Elleuch, M., Bedigian, D., Roiseux, O., Besbes, S., Blecker, C., & Attia, H. (2011). Dietary fiber and fiber-rich by-products of food processing: Characterisation, technological functionality and commercial applications: A review. Food Chemistry, 124(2), 411–421.
- Elleuch, M., Besbes, S., Roiseux, O., Blecker, C., & Attia, H. (2007). Quality characteristics of sesame seeds and by-products. Food Chemistry, 103(2), 641–650.
- Gupta, M., Abu‐Ghannam, N., & Gallaghar, E. (2010). Barley for brewing: Characteristic changes during malting, brewing and applications of its by‐products. Comprehensive Reviews in Food Science and Food Safety, 9(3), 318–328.
- Gutiérrez-Uribe, J. A., Rojas-García, C., García-Lara, S., & Serna-Saldívar, S. O. (2010). Phytochemical analysis of wastewater (nejayote) obtained after lime-cooking of different types of maize kernels processed into masa for tortillas. Journal of Cereal Science, 52(3), 410–416.
- Hassan, M. A. (2012). Studies on Egyptian sesame seeds (Sesamum indicum L.) and its products 1-physicochemical analysis and phenolic acids of roasted Egyptian sesame seeds (Sesamum indicum L.). World Journal of Dairy & Food Sciences, 7(2), 195–201.
- Hosseinian, F. S., & Mazza, G. (2009). Triticale bran and straw: Potential new sources of phenolic acids, proanthocyanidins, and lignans. Journal of Functional Foods, 1(1), 57–64.
- Huang, D., Ou, B., Hampsch-Woodill, M., Flanagan, J. A., & Prior, R. L. (2002). High-throughput assay of oxygen radical absorbance capacity (ORAC) using a multichannel liquid handling system coupled with a microplate fluorescence reader in 96-well format. Journal of Agricultural and Food Chemistry, 50(16), 4437–4444.
- Jacobo-Velázquez, D. A., & Cisneros-Zevallos, L. (2009). Correlations of antioxidant activity against phenolic content revisited: A new approach in data analysis for food and medicinal plants. Journal of Food Science, 74(9), R107–R113.
- Jung, M. J., Heo, S. I., & Wang, M. H. (2008). Free radical scavenging and total phenolic contents from methanolic extracts of Ulmus davidiana. Food Chemistry, 108(2), 482–487.
- Kahkonen, M. P., Hopia, A. I., Vuorela, H. J., Rauha, J. P., Pihlaja, K., Kujala, T. S., & Heinonen, M. (1999). Antioxidant activity of plant extracts containing phenolic compounds. Journal of Agricultural and Food Chemistry, 47(10), 3954–3962.
- Kamal-Eldin, A., Lærke, H. N., Knudsen, K. E. B., Lampi, A. M., Piironen, V., Adlercreutz, H., … Åman, P. (2009). Physical, microscopic and chemical characterisation of industrial rye and wheat brans from the Nordic countries. Food & Nutrition Research, 53(1), 1912.
- Kang, M. H., Naito, M., Sakai, K., Uchida, K., & Osawa, T. (1999). Mode of action of sesame lignans in protecting lowdensity lipoprotein against oxidative damage in vitro. Life Sciences, 66(2), 161–171.
- Kumar, G. S., & Krishna, A. G. (2015). Studies on the nutraceuticals composition of wheat derived oils wheat bran oil and wheat germ oil. Journal of Food Science and Technology, 52(2), 1145–1151.
- Kumar, N., & Pruthi, V. (2014). Potential applications of ferulic acid from natural sources. Biotechnology Reports, 4, 86–93.
- Lazarou, D., Grougnet, R., & Papadopoulos, A. (2007). Antimutagenic properties of a polyphenol-enriched extract derived from sesame-seed perisperm. Mutation Research/Genetic Toxicology and Environmental Mutagenesis, 634(1), 163–171.
- Mohamed, H. M. A., & Awatif, I. I. (1998). The use of sesame oil unsaponifiable matter as a natural antioxidant. Food Chemistry, 62(3), 269–276.
- Nandi, I., & Ghosh, M. (2015). Studies on functional and antioxidant property of dietary fibre extracted from defatted sesame husk, rice bran and flaxseed. Bioactive Carbohydrates and Dietary Fibre, 5(2), 129–136.
- Ndolo, V. U., & Beta, T. (2014). Comparative studies on composition and distribution of phenolic acids in cereal grain botanical fractions. Cereal Chemistry, 91(5), 522–530.
- Parfitt, J., Barthel, M., & Macnaughton, S. (2010). Food waste within food supply chains: Quantification and potential for change to 2050. Philosophical Transactions of the Royal Society of London B: Biological Sciences, 365(1554), 3065–3081.
- Ravindran, R., & Jaiswal, A. K. (2016). Exploitation of food industry waste for high-value products. Trends in Biotechnology, 34(1), 58–69.
- Sahuquillo, A., Barberá, R., & Farré, R. (2003). Bioaccessibility of calcium, iron and zinc from three legume samples. Nahrung, 47(6), 438–441.
- Sánchez-Rangel, J. C., Benavides, J. A., Heredia, J., Cisneros-Zevallos, L., & Jacobo-Velázquez, D. A. (2013). The Folin–Ciocalteu assay revisited: Improvement of its specificity for total phenolic content determination. Analytical Methods, 5(21), 5990–5999.
- Schmidt, Š., & Pokorný, J. (2005). Potential application of oilseeds as source of antioxidants for food lipids – a review. Czech Journal of Food Sciences., 23(3), 93–102.
- Schmidt, Š., Pokorný, J., Vajdák, M., Sekretár, S., & Gordon, M. H. (2003). Oilseeds as a source of antioxidants. Bulletin Potravinárskeho Výskumu, 42, 133–149.
- Shahidi, F., & Liyana-Pathirana, C. M. (2005). Antioxidant activity of sesame fractions. In F. Shahidi & C. T. Ho (Eds.), Phenolic compounds in foods and natural health products (Vol. 909, pp. 33–45). Washington, DC: American Chemical Society.
- Shahidi, F., & Naczk, M. (2004). Phenolics in food and nutraceuticals. Boca Raton, FL: CRC Press.
- Sharif, M. K., Butt, M. S., Anjum, F. M., & Khan, S. H. (2014). Rice bran: A novel functional ingredient. Critical Reviews in Food Science and Nutrition, 54(6), 807–816.
- Sukumar, D., Arimboor, R., & Arumughan, C. (2008). HPTLC fingerprinting and quantification of lignans as markers in sesame oil and its polyherbal formulations. Journal of Pharmaceutical and Biomedical Analysis, 47(4), 795–801.
- USDA. (2017, December). Agricultural research service. Food Composition Databases. Retrieved from https://ndb.nal.usda.gov/ndb/
- Yoshida, H., Shigezaki, J., Takagi, S., & Kajimoto, G. (1995). Variations in the composition of various acyl lipids, tocopherols and lignans in sesame seed oils roasted in a microwave oven. Journal of the Science of Food and Agriculture, 68(4), 407–415.
- Yoshida, H., & Takagi, S. (1997). Effects of seed roasting temperature and time on the quality characteristics of sesame (Sesamum indicum) oil. Journal of the Science of Food and Agriculture, 75(1), 19–26.
- Zhou, K., & Yu, L. (2004). Effects of extraction solvent on wheat bran antioxidant activity estimation. LWT-Food Science and Technology, 37(7), 717–721.
- Zhou, L., Lin, X., Abbasi, A. M., & Zheng, B. (2016). Phytochemical contents and antioxidant and antiproliferative activities of selected black and white sesame seeds. BioMed Research International, 8495630..
- Zouari, R., Besbes, S., Ellouze-Chaabouni, S., & Ghribi-Aydi, D. (2016). Cookies from composite wheat–Sesame peels flours: Dough quality and effect of Bacillus subtilis SPB1 biosurfactant addition. Food Chemistry, 194, 758–769.