
 ?Mathematical formulae have been encoded as MathML and are displayed in this HTML version using MathJax in order to improve their display. Uncheck the box to turn MathJax off. This feature requires Javascript. Click on a formula to zoom.
ABSTRACT
Sunflower head (Helianthus annuus, Asteraceae) is a residual by-product generated during the production of sunflower seed oil and contains a considerable amount of bioactive components. The aim of the present study was to determine and optimize extraction conditions for total phenolic content (TPC), antioxidant activities (DPPH, ABTS and FRAP) and xanthine oxidase (XOD) inhibitory activity of SH. The solute solvent ratio showed a significant effect on yield, TPC, antioxidant activities and XOD inhibition. The Box–Behnken design (BBD) was employed for optimization of extraction parameters (yield, TPC and antioxidant activities). The statistical findings for optimized conditions reveal that the best extraction of SH was obtained with the following parameters: ethanol (54.5%), temperature (72.3°C) and time (138.8 min). This present study may help in the industrial extraction process; moreover, further deep studies are required to optimize sequential steps to increase the efficacy.
RESUMEN
La cabeza del girasol (Helianthus annuus, Asteraceae) es un subproducto residual que se genera durante la producción de aceite de semilla de girasol. Contiene una cantidad considerable de componentes bioactivos. El presente estudio se propuso determinar y optimizar las condiciones de extracción para el contenido fenólico total (TPC), las actividades antioxidantes (DPPH, ABTS y FRAP) y la actividad inhibidora de la xantina oxidasa (XOD) propios de la cabeza de girasol (SH). Se comprobó que la ratio de soluto a solvente produce un efecto significativo en el rendimiento, el TPC, las actividades antioxidantes y la inhibición de la XOD. Empleando el diseño Box-Behnken (BBD) se optimizaron los parámetros de extracción (rendimiento, TPC y actividades antioxidantes). Una vez logradas las condiciones optimizadas los resultados estadísticos muestran que la mejor extracción de SH se obtuvo bajo los siguientes parámetros: etanol (54.5%), temperatura (72.3 °C) y duración (138.8 min). El presente estudio puede resultar útil para el proceso de extracción industrial. Sin embargo, se requiere la realización de estudios adicionales a fin de optimizar los pasos secuenciales necesarios para elevar la eficacia.
Abbreviations: TPC: Total phenolic content; DPPH: 2,2-diphenyl-1-picrylhydrazyl; ABTS: 2,2’-azino-bis(3-ethylbenzothiazoline-6-sulphonic acid); FRAP: Ferric reducing ability of plasma; SH: Sunflower head; BBD: Box–Behnken design; XOD: Xanthine oxidase; UA: Uric acid; RSM: Response surface methodology; TPTZ: 2,4,6-tripyridyl-s-triazine; S/L: Solid/Liquid; GAE: Gallic acid; DW: Dry weight; ANOVA: Analysis of variance
1. Introduction
Food waste is discharged, released in all stages of the food life cycle, e.g. agriculture production, industrial manufacturing and processing, etc. Around, 42% of food waste is generated by household activities, 39% from the food manufacturing industry, 5% is waste produce during distribution and another 14% from food service sector, i.e. catering, restaurants and ready to eat food. It is estimated that food waste may be increased up to 126 Mt by 2020, if any prevention measures have not been taken (Kumar, Yadav, Kumar, Vyas, & Dhaliwal, Citation2017; Mirabella, Castellani, & Sala, Citation2014). This could cause serious environmental problems. Food wastes are a valuable source of various functional components such as polyphenols, antioxidants, flavours and stabilizers, etc. Moreover, utilization of these food wastes can help in the reduction of environmental pollution (da Silva et al., Citation2014).
Sunflower head (SH) is a residual byproduct generated during the production of sunflower seed oil. In China, the production of SH reaches around 8–10 × 105 tons every year. SH is a source of various biologically active compounds, such as polyphenols, pectins, polysaccharides, and other organic matters (Zhang, Zhang, Cheng, Shen, & Wang, Citation2016). It has been reported that SH is helpful for the treatment of many chronic diseases. The prophylactic activities of SH are directly linked with the presence of phytochemicals. Previously, Liang, Cui, Li, Liu, and Zhao (Citation2013) and Ye, Liang, Li, and Zhao (Citation2015) reported that sunflower head florets (ray and disc) contain a considerable amount of polyphenolic compounds, e.g. caffeic acid, chlorogenic acid, p-coumaric acid, 3-O-feruloylquinic acid, isoquercitrin and isoferulic acid. Previously, it was reported that these components may decrease the risk of various disorders including hyperuricemia (Mehmood et al., Citation2017).
Hyperuricemia is a disease due to the increase in body UA level and causes numerous diseases, e.g. heart diseases, renal failure, gout, malignant tumours, etc. (Mehmood et al., Citation2017). Briefly, in purine metabolism hypoxanthine and xanthine convert to UA by xanthine oxidase (XOD) enzyme. Human bodies lack an enzyme (uricase) which helps in further catalysis of UA to allantoin.
Therefore, less excretion of UA or UA overproduction aid in the increment of body UA level (Kelley et al., Citation2010; Mittal, Phillips, Loveday, & Windsor, Citation2008). Dietary food plant metabolites possessed significant curative activities for lowering body uric acid level through various ways, such as by suppressing UA synthesis, UA reabsorption and ameliorates renal UA secretion (Mehmood et al., Citation2017).
Biological active components can be recovered by various methods, e.g. supercritical gas or fluid, high-pressure and solvent extraction with or without microwaves or ultra-sonication (Khoddami, Wilkes, & Roberts, Citation2013). Traditionally, solid-liquid solvent extraction is very cost-effective and simple methods which are still employed widely for the extraction of biologically active components. There are many factors influencing extraction efficiency, e.g. temperature, time, solvent, solute/solvent ratio, etc. Therefore, it is mandatory to optimize the extraction conditions of biologically active compounds for maximizing the product yield and minimizing the production cost (Al Farsi & Lee Citation2008; Liu et al., Citation2018; Sarkis, Michel, Tessaro, & Marczak, Citation2014).
Response surface methodology (RSM) is a statistical and mathematical tool applied for the optimization of the chemical process. It predicts the influence of interactions on response and independent variables (Myers & Montgomery, Citation2002).
According to our knowledge, there is no report regarding optimization of bioactive compounds extractions conditions and antioxidant activity in SH. This project was designed to optimize the extraction conditions of phenolic compounds in SH by using RSM and to determine TPC, XOD inhibitory and antioxidant activities in SH extract.
2. Material and method
2.1. Chemicals
Folin–Ciocalteu reagent (F9252, Sigma), xanthine oxidase lyophilized powder (X4376-5UN Sigma), xanthine (X4002-1G, Sigma), sodium carbonate (NaCO3), trolox, methanol, ethanol, FeCl3.6H2O, CH3COONa, CH2COOH, K2S2O8, KCl, NaCl, KH2PO4, NaHPO4.12H2O, 2,2-azinobis (3-ethyl-benzothiazoline-6-sulfonic acid) (ABTS), 2,2-diphenyl picrylhydrazyl (DPPH•), 2,4,6-tripyridyl-s-triazine (TPTZ) and Gallic acid (Shanghai Macklin China) were used. All chemicals used in this study were analytical grade.
2.2. Procurement and preparation of the sample
Sunflower heads (SH) were procured from Inner Mongolia, China. The stems and seeds were removed from SH by hand. The SH was powdered with an electric blender (WJX-A400, China), passed through a sieve of 20-mesh, packed in plastic bags and stored at −20ºC (Figure S2).
2.3. Effect of solute (S)/liquid (L) ratio on the preparation of SH extract
To evaluate the influence of S/L ratio on extraction, six different ratios (SH powder: solvent, g: ml 1:5, 1:10, 1:20, 1:30, 1:40, and 1:50) were used. Briefly, 10 g of SH powder were mixed with aqueous ethanol (50:50, v/v). The extraction was carried out at room temperature in a shaking incubator at 150 rpm for 4 h. After 4 h, the solution was centrifuged at 10000g for 10 min. The supernatant was removed and passed through filter paper. The solvent (ethanol) was removed by using IKA™ RV 10 Digital V Rotatory Evaporator (< 40ºC) under reduced pressure whereas water was removed by using freeze dryer at −80ºC. The yield (g/100g dry weight [DW], TPC, antioxidant [DPPH, FRAP, ABTS] and xanthine oxidase [XOD]) inhibitory activity were evaluated. The best ratio (S/L) was then selected for further optimization purpose.
2.4. Determination of total phenolic contents (TPC)
TPC in SH extract was evaluated by colorimetric Folin–Ciocalteu method (Singleton & Rossi, Citation1965; Zhao, Li, Zhu, & Hao, Citation2015). In detail, 0.1 ml SH extract (0.5–15 mg/ml) was mixed with 5.9 ml double distilled water, 0.5 ml of Folin–Ciocalteu reagent in 10 ml test tube and vortex for 1 min followed by the addition of 1.5 ml Na2CO3 (20% w/v). The volume was made up to 10 ml and incubated at 70ºC for 10 min. Absorbance was measured at a wavelength of 765 nm by using spectrophotometer SpectraMax i3 (Molecular Devices, Silicon Valley, CA, United States). For the quantification of SH extract TPC, a calibration curve was constructed by using gallic acid (mg of GAE/g of DW) with various concentrations.
2.5. Determination of antioxidant activity of SH extract
2.5.1. Determination of DPPH activity
The antioxidant activity was performed by DPPH radical scavenging protocol as reported by Zhao, Luo, Wang, and Ji (Citation2011). A 100 μl of SH extract was mixed with 3.9 ml of DPPH solution (6 × 10⁻⁵ M) and incubated in a dark place for 1 h at room temperature. After 1 h absorbance was determined at 517 nm by using SpectraMax i3 spectrophotometer (Molecular Devices, Sunnyvale, CA, USA). The readings were compared with control, containing 95% ethanol instead of SH extract. The DPPH radical-scavenging activity of the extract was then calculated from the calibration curve of Trolox (μg of Trolox/g DW of SH).
2.5.2. Determination of ABTS activity
The ABTS activity was determined by a previously reported method (Re et al., Citation1999). Briefly, ABTS radical stock solution was prepared by adding ABTS (7 mM) with K2SO8 and this mixture was stored in a dark room for 16 h. The ABTS radical solution was diluted with PBS (pH 7.4) to an absorbance of 0.70 ± 0.02 at 734 nm. 80 μl SH extract was reacted with 3.92 mL of ABTS radical working solution in the dark and absorbance was measured at 734 nm after 6 min. Trolox (μg of Trolox/g DW of SH) and double distilled water were used as a positive control and blank.
2.5.3. Determination of ferric reducing antioxidant power (FRAP)
The FRAP was assessed according to the method proposed by Benzie and Strain (Citation1996). Briefly, free radical solution was prepared by adding 25 mL of 0.3 M acetate buffer (pH 3.6), 2.5 mL of 10 mM TPTZ solution (40 mM HCl) and 2.5 mL FeCl3 · 6H2O (20 mM). A 1000 μl of SH extract was mixed with 3.0 mL of freshly prepared FRAP reagent and 300 μl double distilled water. The mixture was stored at 37ºC in the water bath for 30 min, and absorbance was measured at 595 nm. Double distilled water and Trolox (μg of Trolox/g DW of SH) were used as a blank and positive control.
2.6. Determination of xanthine oxidase (XOD) inhibitory activity
The XOD inhibitory activity was determined according to the method previously reported by Dong et al. (Citation2016) with some alternations. The reaction mixture consists of SH extract (0.5–15 mg/ml), xanthine (0.3 mM), XOD (0.11 U/ml) and PBS (200 mM, pH 7.4) solution. Briefly, 50 μl of SH extract and 50 μl XOD was added into 96 well plates. The reaction was started by the addition of 150 μl xanthine solution. The reaction was performed at 37°C for 8 min. The absorbance was recorded at 292 nm from 0 to 8 min by using SpectraMax i3 (Molecular Devices, Silicon Valley, CA, United States). All the experiments were carried out in triplicate. PBS solution was used as a negative control. XOD inhibitory activity was calculated by using the following formula:
A1 (control with enzyme – control without enzyme), B1 (Sunflower head extract with enzyme – Sunflower head extract without enzyme).
2.7. Response surface methodology (RSM) and statistical analysis
RSM was used for the optimization of yield, phenolic contents and antioxidant activity (DPPH, FRAP and ABTS) of SH. The Box–Behnken design was conducted with three independent variables (X1: ethanol 40–80%, X2: temperature 30–80ºC, X3: time 60-180min) (Table S1). A total of seventeen experiments were carried out, including five replicates (Box & Behnken, Citation1960). Extraction yield, TPC and antioxidant activity of SH were chosen as the responses for the combinations of factors presented in Table S1. The mathematical model corresponding to the Box–Behnken design is given below:
Table 1. Three-factor, three-level face-centered cube design used for RSM.
Tabla 1. Diseño cúbico centrado en las caras de tres factores y tres niveles utilizado para la RSM.
where Y is the dependent variable (extraction yield, TPC and antioxidant activity); β0, βi, βii, and βij are regression coefficients in the intercept, linear, quadratic and interaction terms, respectively; and Xi and Xj are the independent variables. Design-expert software (Design Expert 9.0.3, Stat-Ease Inc.) was used for the experimental and regression analysis of the data. The coefficient of determination (R2) and lack of fit was used for the adequacy of each model and significant coefficient was evaluated by F-test from ANOVA. The 3D graphs were generated by using regression coefficients from software. The subsequently additional experiments were performed for the verification and validity of statistical models.
3. Results and discussion
3.1. Determination of best solute solvent ratio (S/L)
3.1.1. Yield
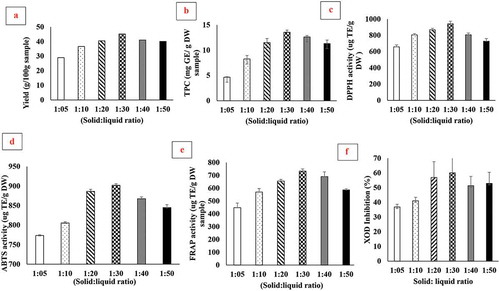
Results for the solute-solvent ratio effect on yield are presented in ). The results showed that yield of SH extracts totally rely upon S/L ratio. The extraction yield increases by increasing the solute-solvent ratio. However, the maximum yield was observed at 1:30 and 1:20, but lower in 1:40 and 1:50 (w/v). Moreover, the results of a yield of SH solute-solvent ratio 1:20 close to 1:30. When the concentration of solvent increases at a specific value, the extraction of phenolic compounds decreases due to change in the polarity of solvent (Feng, Luo, Tao, & Chen, Citation2015; Sai-Ut, Benjakul, Kraithong, & Rawdkuen, Citation2015). Similar results were also reported by Sai-Ut et al. (Citation2015). They reported that by increasing the solute solvent ratio the yield of two mango peels (Nam-Dokmai peel and Tong-Dam peel) increased. The extraction yield of plant materials was influenced by several factors, i.e. solubility, time, temperature, solute-solvent ratio and polarity. Safdar et al. (Citation2017) reported a higher extraction yield of know (Citrus reticulata L.) peel in methanol and ethanol as compared to other solvents. Similarly, an earlier study conducted by Hegazy & Ibrahim claimed an extraction yield of 8.27 to 28.32% in orange peel.
Figure 1. Influence of S/L ratio on (a) yield, (b) TPC, (c) DPPH, (d) ABTS, (e) FRAP and (f) XOD inhibitory activity of SH.
Figura 1. Influencia de la ratio S/L en (a) rendimiento, (b) TPC, (c) DPPH, (d) ABTS, (e) FRAP y (f) actividad inhibidora de la XOD de la SH.
3.1.2. Total phenolic contents
The results regarding TPC are presented in ). The TPC ranged from 4.64 to 13.55 mg GAE/g of DW SH extract. As from the figure, it is clear that TPC increased by increasing solid-to-liquid ratio because solvents facilitate in the extraction of phenolic content. The results are in agreement with the findings of Sai-Ut et al. (Citation2015), which expounded that by increasing the solid–liquid ratio TPC content significantly increased to some extent. A similar trend of increment of TPC was observed by Ćujić et al. (Citation2016) in dried chokeberry. The highest yield of TPC (13.4 mg GAE/g DW) was achieved at (solute/solvent, 1 g:30ml) when extracted with traditional maceration technique (50% ethanolic). Hea et al. (Citation2012) reported that lower solid–liquid ratio aids in the increment of bioactive compounds from pomegranate seed whereas at higher concentration this trend decreases or becomes constant. Moreover, TPC in sunflower florets has been reported at 27.50 mg GEA/g DW (Ye et al., Citation2015). The results of our study did not correlate with the finding of Ye et al. (Citation2015), possibly due to the variation of SH origin. Sunflower disc florets contain a considerable amount of polyphenolic compounds, e.g. caffeic acid, p-coumaric acid, chlorogenic acid and isoquercitrin, etc. (Liang et al., Citation2013; Ye et al., Citation2015).
3.1.2. Antioxidant activities
The significant influence of S/L ratio was observed in DPPH, FRAP and ABTS activity. The DPPH, FRAP and ABTS activities were varied from 657.17 to 942.02, 447.58 to 732.86, and 773.35 to 902.02 μg Trolox/g of DW SH extract (). The maximum antioxidant activity was achieved at 1:30 solid-to-liquid ratio. Previously Ye et al. (Citation2015) also reported that sunflower disc florets possess strong antioxidant activity in DPPH (13,244.5 ± 806.30 μM Trolox/100g of DW), FRAP (18,662.7 ± 687.50 μM TEAC/100g of DW) and ABTS (26,492.10 ± 384.10 μM Trolox/100g of DW) assay. The results of our study did not correlate with Ye et al. (Citation2015) due to a variation of sample, variety, and experimental conditions. Similar results were reported by several authors (Hea et al., Citation2012; Hegazy & Ibrahim, Citation2012; Safdar et al., Citation2017; Sai-Ut et al., Citation2015).
However, exceeding from 1:30 ratio DPPH activity did not increase and tends to decrease. Because antioxidant activity is directly linked with bioactive components and at a higher concentration of S/L ratio trend leaching bioactive compounds decrease which results in decreasing the antioxidant activity.
3.1.3. Xanthine oxidase (XOD) inhibitory activity
XOD is a responsible enzyme which converts hypoxanthine into UA. UA is not further converted into allantoin, so its elevation results in several diseases like hyperuricemia and gout. Therefore, lowering body UA by inhibiting XOD is the first line of treatment (Wang et al., Citation2017). The results of XOD inhibitory activity of SH are depicted in ). As shown in the figure, by increasing solute solvent ratio XOD inhibition increased and maximum XOD inhibition was observed at 1:30 (60.04%) and 1:20 (56.88%) ()). This inhibitory activity is directly linked with the presence of various concentrations of bioactive compounds, e.g. caffeic acid, p-coumaric acid, chlorogenic acid and isoquercitrin, etc. (Liang et al., Citation2013; Ye et al., Citation2015). In our comprehensive review, we figured out that bioactive compounds from numerous dietary food plants (fruits, vegetables, nuts, legumes, coffee and tea, etc.) inhibit XOD (Mehmood et al., Citation2017). In detail, bioactive compounds (luteolin, pyrogallol, kaempferol, genistein, etc.), enter the Mo center of XOD, thwart electron transfer, and alternate the structure of XOD which results in preventing UA synthesis (Honda, Fukuyama, Nishiwaki, Masuda, & Masuda, Citation2017; Mehmood et al., Citation2017; Wang, Zhang, Pan, & Gong, Citation2015; Yan, Zhang, Hu, & Ma, Citation2013; Zhang et al., Citation2016). Similar, the mechanism of XOD inhibition by dietary polyphenols was proposed by numerous researchers (Dong et al., Citation2016; Honda et al., Citation2017; Yan et al., Citation2013).
The solute solvent ratio (1:30 g/ml) could result in a higher value of yield, TPC and antioxidant activities. This ratio was further used for optimization purposes.
3.2. Model fitting
RSM was employed to elucidate the effect of independent variables, i.e. time, temperature, ethanol (%) on TPC, antioxidant activities and yield of an extract of SH (). Seventeen treatments were generated using BBD. The yield (g/100g DW) and TPC (mg/g DW) values ranged from 28.69 to 42.40 and 6.11 to 9.55. The regression coefficients were determined by using multiple regression analysis regarding different parameters. The coefficients of determination (R2) of all the models were higher than 80% in our data, indicating that models are well fitted and could explain the variability of data ( and ).
Table 2. Analysis of variance (ANOVA) for the 2nd order response surface model of extraction yield, TPC, DPPH, FRAP and ABTS for SH extract.
Tabla 2. Análisis de varianza (ANOVA) del modelo de superficies de respuesta de segundo orden para el rendimiento de la extracción, TPC, DPPH, FRAP y ABTS para el extracto de SH.
Table 3. Regression analysis of predicted second order polynomial models for yield, TPC, DPPH, FRAP and ABTS activity.
Tabla 3. Análisis de regresión de los modelos polinomiales de segundo orden para rendimiento, TPC, DPPH, FRAP y actividad ABTS.
3.3. RSM analysis for yield
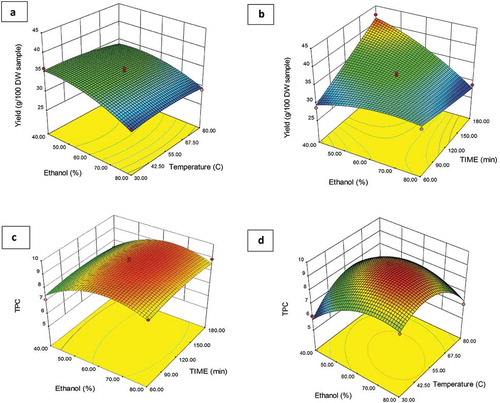
The results of RSM for the yield of SH extract are presented in with regression equation (YieldY = 34.50–2.61X1-0.40X2 + 1.77X3 + 0.45X1X2-4.23X1X3 + 1.13X2X3-1.68X12-0.73X22 + 0.15X32). The p-value and F-value were used for significant coefficient determination. The response for SH extract imparts greater effects at moderate ethanol concentration as a contrast to variable temperature. Moreover, as the extraction temperature increased, the extraction yield was also increased. In plants, phenolic components are distributed in lipophilic or hydrophilic (Sai-Ut et al., Citation2015). So when hydrophilic components dissolve in water, it results in an increase in extraction yield. Additionally, ethanol and temperature impart positive effects while extraction time showed less of an influence on the extraction yield.
Figure 2. RSM figures 3D and regression coefficients (a and c) effect of temperature and ethanol (%) on extraction yield and TPC from SH whereas (b and d) shows the effect of ethanol % and time on yield and TPC from SH.
Figura 2. Figuras en 3D del RSM y coeficientes de regresión (a y c), efecto de la temperatura y el etanol (%) en el rendimiento de extracción y el TPC de SH, mientras que (b y d) muestran los efectos del etanol (%) y la duración en el rendimiento y el TPC de SH.
3.4. RSM analysis for TPC
The results of RSM for TPC of SH extract are depicted in with regression equation (TPCY = 9.35 + 0.51X1-0.23X2 + 0.049X3-0.70X1X2 + 3.00X1X3 + 0.029X2X3-1.07X12-1.48X22-0.26X32). The p-value and F-value were used for significant coefficient determination. The statistical analysis by applying the analysis of variance technique to full regression of model showed a significant effect on TPC. As the ethanol (%), temperature and time increased, the TPC of SH also increased. The TPC was also increased by increasing ethanol concentration, extraction time and temperature (Cacace & Mazza, Citation2003; Dranca & Oroian, Citation2016). Because of longer time and temperature, extraction of TPC was increased. Moreover, increasing the temperature may favor the extraction of phenols by reducing viscosity, thereby increasing the diffusion coefficient and solubility of phenols (Cacace & Mazza, Citation2003). The increased ethanol concentration also influenced positively in the extraction, a behaviour similar to that reported by Luthria and Mukhopadhyay (Citation2006). However, concentrations that exceed the optimum value could cause a slight decrease in the recovery of TPC (Dranca & Oroian, Citation2016). Ćujić et al. (Citation2016) obtained the highest TP (27.82 mg GAE/g DW) with optimized extraction conditions (50%, particle size 0.75 mm, ethanol, S/L 1:20). A positive correlation was observed between methanol concentration and temperature for TPC extraction (Belwa et al., Citation2016).
3.5. RSM analysis for antioxidant activities
In-vitro antioxidant activities were determined by DPPH, ABTS and FRAP assays and the influence of variables (ethanol concentration, time, temperature) were observed to have a significant effect on all tested assays. The two-dimensional contours and three-dimensional response surface graphs obtained from the model are presented in Figure S1(a–f). The model for antioxidant activity (DPPH, ABTS and FRAP) shows a highly significant effect of independent variables on the antioxidant activities.
The similar shapes of antioxidant activities (FRAP, DPPH and ABTS) were noticed for contour plots. The antioxidant activity increased by increasing the ethanol percentage and temperature because temperature increased the extractability of the phenolic compound. However, many authors also reported that polyphenolic compounds are degraded at a higher temperature and result in a decrease in antioxidant activity. Interestingly, opposite results were observed in agro-industrial by-products (Lai et al., Citation2014; Va´zquez et al. Citation2012). Some authors suggest that temperature takes part in decreasing the viscosity, increasing diffusion coefficient and results in increasing the solubility of phenols (Cacace & Mazza, Citation2003). Moreover, the temperature may also break the cell wall of plants and aid in the separation of conjugated phenolic compounds by the solvent (Al Farsi & Lee, Citation2008). Additionally, polyphenolic compounds possess antioxidant activity through various ways such as forming catalytic activity via chelating metal iron, oxidizing and providing the hydrogen ion and inhibiting antioxidant enzymes (Halake, Birajdar, & Lee, Citation2016; Saurav & Kannabiran, Citation2012).
3.6. Optimization and model validation
Each aspect of independent variables suggests different optimized levels. The best optimization condition was with ethanol (54.54%), temperature (72.25°C) and time (138.78 min).
4. Conclusion
In this study, RSM was observed as the best tool to discriminate the interactive effects of independent variables (ethanol, temperature, time). The solute solvent ratio has a significant effect on yield, TPC, XOD, and antioxidant activities (DPPH, ABTS and FRAP) at (1:30 g/ml). As the concentration of solute-solvent increases, the bioactive compounds and antioxidant activities were also dose-dependently increased; however after 1:30 it showed a decreasing trend. An optimized condition for maximum yield, TPC and antioxidants (DPPH, ABTS and FRAP) was determined as the following conditions: ethanol (54.54%), temperature (72.25°C) and time (138.788 min). This present study may be helpful for the industrial extraction process; moreover, further deep studies are required to optimize sequential steps to increase efficacy.
Supplemental Material
Download MS Word (709.7 KB)Disclosure statement
No potential conflict of interest was reported by the authors.
Supplementary material
Supplemental data for this article can be accessed on the publisher's website.
Additional information
Funding
Related Research Data
References
- Al-Farsi, M. A., & Lee, C. Y. (2008). Optimization of phenolics and dietary fibre extraction from date seeds. Food Chemistry, 108, 977–985.
- Belwal, T., Dhyani, P., Bhatt, I. D., Rawal, R. S., & Pande, V. (2016). Optimization extraction conditions for improving phenolic content and antioxidant activity in Berberis asiatica fruits using response surface methodology (RSM). Food Chemistry, 207, 115–124.
- Benzie, I. F., & Strain, J. J. (1996). The ferric reducing ability of plasma (FRAP) as a measure of “antioxidant power”: The FRAP assay. Analytical Biochemistry, 239, 70–76.
- Box, G. E. P., & Behnken, D. W. (1960). Simplex-sum designs: A class of second order rotatable designs derivable from those of first order. The Annals of Mathematical Statistics, 31, 838–864.
- Cacace, J. E., & Mazza, G. (2003). Mass transfer process during extraction of phenolic compounds from milled berries. Journal of Food Engineering, 59, 379–389.
- Ćujić, N., Šavikin, K., Janković, T., Pljevljakušić, D., Zdunić, G., & Ibrić, S. (2016). Optimization of polyphenols extraction from dried chokeberry using maceration as traditional technique. Food Chemistry, 194, 135–142.
- da Silva, L. M. R., De Figueiredo, E. A. T., Ricardo, N. M. P. S., Vieira, I. G. P., De Figueiredo, R. W., Brasil, I. M., & Gomes, C. L. (2014). Quantification of bioactive compounds in pulps and by-products of tropical fruits from Brazil. Food Chemistry, 143, 398–404.
- Dong, Y., Huang, H., Zhao, M., Sun-Waterhouse, D., Lin, L., & Xiao, C. (2016). Mechanisms underlying the xanthine oxidase inhibitory effects of dietary flavonoids galangin and pinobanksin. Journal of Functional Foods, 24, 26–36.
- Dranca, F., & Oroian, M. (2016). Optimization of ultrasound-assisted extraction of total monomeric anthocyanin (TMA) and total phenolic content (TPC) from eggplant (Solanum melongena L.) peel. Ultrasonics Sonochemistry, 31, 637–646.
- Feng, S., Luo, Z., Tao, B., & Chen, C. (2015). Ultrasonic-assisted extraction and purification of phenolic compounds from sugarcane (Saccharum officinarum L.) rinds. LWT-Food Science and Technology, 60(2), 970–976.
- Halake, K., Birajdar, M., & Lee, J. (2016). Structural implications of polyphenolic antioxidants. Journal of Industrial and Engineering Chemistry, 35, 1–7.
- Hea, L., Zhanga, X., Xua, H., Xua, C., Yuana, F., Knezb, Ž., … Gao, Y. (2012). Subcritical water extraction of phenolic compounds from pomegranate (Punica granatum L.) seed residues and investigation into their antioxidant activities 424 with HPLC–ABTS assay. Food and Bioproducts Processing, 90, 215–223.
- Hegazy, A., & Ibrahim, M. (2012). Antioxidant activities of orange peel extracts. World Applied Sciences Journal, 2012(18), 684e8.
- Honda, S., Fukuyama, Y., Nishiwaki, H., Masuda, A., & Masuda, T. (2017). Conversion to purpurogallin, a key step in the mechanism of the potent xanthine oxidase inhibitory activity of pyrogallol. Free Radical Biology and Medicine, 106, 228–235.
- Kelley, E. E., Khoo, N. K., Hundley, N. J., Malik, U. Z., Freeman, B. A., & Tarpey, M. M. (2010). Hydrogen peroxide is the major oxidant product of xanthine oxidase. Free Radical Biology and Medicine, 48, 493–498.
- Khoddami, A., Wilkes, M. A., & Roberts, T. H. (2013). Techniques for analysis of plant phenolic compounds. Molecules, 18, 2328–2375.
- Kumar, K., Yadav, A. N., Kumar, V., Vyas, P., & Dhaliwal, H. S. (2017). Food waste: A potential bioresource for extraction of nutraceuticals and bioactive compounds. Bioresources and Bioprocessing, 4, 18.
- Lai, T. N. H., André, C. M., Chirinos, R., Nguyen, T. B. T., Larondelle, Y., & Rogez, H. (2014). Optimization of extraction of piceatannol from Rhodomyrtus tomentosa seeds using response surface methodology. Separation and Purification Technology, 134, 139–146.
- Liang, Q., Cui, J., Li, H., Liu, J., & Zhao, G. (2013). Florets of Sunflower (Helianthus annuus L.): Potential new sources of dietary fiber and phenolic acids. Journal of Agricultural and Food Chemistry, 61, 3435–3442.
- Liu, Y., Luo, X., Lan, X., Tang, J., Zhao, P., & Kan, H. (2018). Ultrasonic-assisted extraction and antioxidant capacities of flavonoids from Camellia fascicularis leaves. CyTA - Journal of Food, 16(1), 105–112.
- Luthria, D. L., & Mukhopadhyay, S. (2006). Influence of sample preparation on assay of phenolic acids from eggplant. Journal of Agricultural and Food Chemistry, 54, 41–47.
- Mehmood, A., Zhao, L., Wang, C., Nadeem, M., Raza, A., Ali, N., & Shah, A. A. (2017). Management of hyperuricemia through dietary polyphenols as a natural medicament: A comprehensive review. Critical Reviews in Food Science and Nutrition, 1–23. doi:10.1080/10408398.2017.1412939
- Mirabella, N., Castellani, V., & Sala, S. (2014). Current options for the valorization of food manufacturing waste: A review. Journal of Cleaner Production, 65, 28–41.
- Mittal, A., Phillips, A. R., Loveday, B., & Windsor, J. A. (2008). The potential role for xanthine oxidase inhibition in major intra-abdominal surgery. World Journal of Surgery, 32, 288–295.
- Myers, R. H., & Montgomery, D. C. (2002). Response surface methodology: Process and product optimization using designed experiments (2nd ed.). Wiley: New York.
- Re, R., Pellegrini, N., Proteggente, A., Pannala, A., Yang, M., & Rice-Evans, C. (1999). Antioxidant activity applying an improved ABTS radical cation decolorization assay. Free Radical Biology and Medicine, 26, 1231–1237.
- Safdar, M. N., Kausar, T., Jabbar, S., Mumtaz, A., Ahad, K., & Saddozai, A. A. (2017). Extraction and quantification of polyphenols from kinnow (Citrus reticulate L.) peel using ultrasound and maceration techniques. Journal of Food and Drug Analysis, 25, 488–500.
- Sai-Ut, S., Benjakul, S., Kraithong, S., & Rawdkuen, S. (2015). Optimization of antioxidants and tyrosinase inhibitory activity in mango peels using response surface methodology. LWT-Food Science and Technology, 64, 742–749.
- Sarkis, J. R., Michel, I., Tessaro, I. C., & Marczak, L. D. F. (2014). Optimization of phenolics extraction from sesame seed cake. Separation and Purification Technology, 122, 506–514.
- Saurav, K., & Kannabiran, K. (2012). Cytotoxicity and antioxidant activity of 5-(2, 4-dimethylbenzyl) pyrrolidin-2-one extracted from marine Streptomyces VITSVK5 spp. Saudi Journal of Biological Sciences, 19, 81–86.
- Singleton, V. L., & Rossi, J. A. (1965). Colorimetry of total phenolics with phosphomolybdic-phosphotungstic acid reagents. American Journal of Enology and Viticulture, 16, 144–158.
- Vázquez, G., Fernández-Agulló, A., Gómez-Castro, C., Freire, M. S., Antorrena, G., & González-Álvarez, J. (2012). Response surface optimization of antioxidants extraction from chestnut (Castanea sativa) bur. Industrial Crops and Products, 35(1), 126–134.
- Wang, Y., Zhang, G., Pan, J., & Gong, D. (2015). Novel insights into the inhibitory mechanism of kaempferol on xanthine oxidase. Journal of Agricultural and Food Chemistry, 63, 526–534.
- Wang, Z., Kwon, S. H., Hwang, S. H., Kang, Y. H., Lee, J. Y., & Lim, S. S. (2017). Competitive binding experiments can reduce the false positive results of affinity-based ultrafiltration-HPLC: A case study for identification of potent xanthine oxidase inhibitors from Perilla frutescens extract. Journal of Chromatography B, 1048, 30–37.
- Yan, J., Zhang, G., Hu, Y., & Ma, Y. (2013). Effect of luteolin on xanthine oxidase: Inhibition kinetics and interaction mechanism merging with docking simulation. Food Chemistry, 141, 3766–3773.
- Ye, F., Liang, Q., Li, H., & Zhao, G. (2015). Solvent effects on phenolic content, composition, and antioxidant activity of extracts from florets of sunflower (Helianthus annuus L.). Industrial Crops and Products, 76, 574–581.
- Zhang, Y.-J., Zhang, J.-X., Cheng, F., Shen, X.-L., & Wang, Z. (2016). Isolation and structural characterization of a low-molecular-weight pectic polysaccharide SHPPB-1 isolated from sunflower heads. Journal of Carbohydrate Chemistry, 35, 273–285.
- Zhao, L., Li, S., Zhu, Y., & Hao, T. (2015). Antioxidant activities and major bioactive components of consecutive extracts from blue honeysuckle (Lonicera Caerulea L.) cultivated in China. Journal of Food Biochemistry, 39, 653–662.
- Zhao, L., Luo, Y. C., Wang, C. T., & Ji, B. P. (2011). Antioxidant activity of protein hydrolysates from aqueous extract of velvet antler (Cervus elaphus) as influenced by molecular weight and enzymes. Natural Product Communications, 6, 1683–1688.