
 ?Mathematical formulae have been encoded as MathML and are displayed in this HTML version using MathJax in order to improve their display. Uncheck the box to turn MathJax off. This feature requires Javascript. Click on a formula to zoom.
ABSTRACT
The effects of honey type (X1), liquefaction temperature (X2) and timing (X3), prefiltering (X4), sample weight (X5), dilution volume (X6), Carrez I (X7) and Carrez II volume (X8), final filtering (X9), polarimeter tube length (X10) and reading system (X11) on the determination of the specific optical rotation (SOR, R1) determination were investigated using the fractional experimental design . X1 and X11 showed strong influence as key factors. Although X1 differentiate blossom from honeydew honey, X11 can mistake the determination of this parameter and thus the classification of honeys. This study sets an uncertain interval (−5º to +5º) of overlapping between the SOR of blossom and honeydew honeys. Automatic polarimeter system showed lower variability than manual. Factors affecting pH (R2) and electrical conductivity (EC, R3) of working solutions were identified as X4, X6, X8, X11; and X4, X7, X8, X11, respectively.
RESUMEN
Los efectos del tipo de miel (X1), temperatura (X2) y tiempo de licuefacción (X3), prefiltración (X4), peso de la muestra (X5), dilución del volumen (X6), volumen de solución de Carrez I (X7) y de Carrez II (X8), filtrado final (X9), longitud del tubo del polarímetro (X10) y sistema de lectura (X11) se investigaron durante la determinación de la rotación óptica específica (ROE, R1) según un diseño experimental fraccional , mostrando X1 y X11 una fuerte influencia como factores clave. Aunque X1 permite distinguir entre miel de flores y mielato, X11 puede confundir la determinación de este parámetro y, por tanto, la clasificación de las mieles. Este estudio establece un intervalo incierto (−5º a + 5º) de superposición entre la ROE de las mieles florales y los mielatos. El sistema polarimétrico automático mostró una menor variabilidad que el sistema polarimétrico manual. Los factores que afectan al pH (R2) y la conductividad eléctrica (CE, R3) de las soluciones de trabajo se identificaron como X4, X6, X8, X11; y X4, X7, X8, X11, respectivamente.
1. Introduction
Honey is defined as a natural sweet substance produced by Apis mellifera bees. Regarding the original raw plant, honey can have two different botanical origins, being classified as blossom honey or honeydew honey. Blossom or floral honey is produced by bees from nectar of flowers of blossoming plants. Honeydew honey is obtained from secretions produced by certain trees and other plants (genera Pinus, Abies, Castanea, and Quercus, among others) or excretions of plant-sucking insects, mainly from the family Aphididae, on the living parts of plants (Pita-Calvo & Vázquez, Citation2017). Honey is a complex food composed of carbohydrates (70–80% w/w), water (10–20% w/w), and a large number of minor components. Carbohydrates comprise about 95% w/w by dry weight of honey. The major carbohydrates are glucose and fructose. Minor components include, among others, organic acids, amino acids, enzymes, proteins, vitamins, polyphenols and minerals (Pita-Calvo, Guerra-Rodríguez, & Vázquez, Citation2017).
The specific optical rotation (SOR), is a physical property of honey and can be defined as the angle of rotation of polarized light at the wavelength of the sodium D line at 20ºC, of an aqueous solution with 1-dm depth and containing 1 g/mL of the substance. Honey can rotate the polarization plane of polarized light, and the obtained SOR value depends mainly on types and relative proportions of sugars in honey, such as fructose (
= −92.4º) or glucose (
= +52.7º). Honeydew honey is usually somewhat lower in fructose content and contains melezitose (
= +88.2º) or erlose (
= +121.8º) (Ivanov, Citation1986). As general criteria, blossom honey is levorotatory and honeydew honey (or adulterated blossom honey) is usually dextrorotatory (Dinkov, Citation2003; Nikolova, Panchev, Sainov, Gentscheva, & Ivanova, Citation2012).
In this way, the measurement of specific rotation is currently used in Greece, Italy, and UK to distinguish between blossom and honeydew honeys, because most honeydew honeys have a positive specific rotation (Persano Oddo, Piazza, Sabatini, & Accorti, Citation1995; Piazza & Persano Oddo, Citation2004), whereas blossom honeys have negative values (Battaglini & Bosi, Citation1973; Nanda, Sarkar, Sharma, & Bawa, Citation2003; Persano Oddo et al., Citation1995; Piazza & Persano Oddo, Citation2004). Furthermore, the SOR has been used for honeys characterization (Al-Khalifa & Al-Arify, Citation1999; Krpan et al., Citation2009). Among the blossom honeys, Rhododendron and Rosmarinus honeys have the lowest negative values (−6º on average), while Thymus has the highest (−20º on average). However, among the different types there are considerable overlaps. Therefore, Dimins, Kuka, and Cakste (Citation2008) conclude that SOR cannot be used to identify types of blossom honey. On the other hand, honeydew honey has positive values, ranging from +4º to +30º. Taking all this into account, further research is necessary to meet a consensus on the usefulness of SOR in honey classification. Whether this method is suitable to differentiate between blossom and honeydew honeys in other geographic regions remains to be examined in future studies (Bogdanov et al., Citation1999b; Nanda et al., Citation2003). Theoretically, the differences in the SOR values are due to considerable differences between the sugar spectra of blossom and honeydew honeys, the latter containing a higher amount of oligosaccharides, mainly the trisaccharides melezitose and raffinose, both absent in blossom honeys (Bogdanov, Citation2011).
Thus, the fructose/glucose ratio is a useful parameter, together with others, to differentiate between blossom and honeydew honeys. However, it is not a good criterion, by itself, for differentiation the two types of honeys. The specific sugar spectrum yields also information on honey authenticity and sugar adulteration (Bogdanov et al., Citation1999b).
The SOR analytical determination proposed by the International Honey Commission (Bogdanov, Martin, & Lullmann, Citation2002) might be affected by several factors. The optimization of this method on those affecting factors might improve its precision and accuracy and thus, its capability of discriminating between honeys.
The aim of this paper is to determine the key factors affecting the SOR analytical determination and to discuss their capability for differentiating between blossom and honeydew honeys and their mixtures.
2. Material and methods
2.1. Factorial experimental design
After a review of the scientific literature, our own experience, and a brainstorming session of the authors, 11 factors were identified as apparent critical factors (ACFs). shows the factors and levels studied in the experimental design. The main premises to be examined were as follows: (1) to screen how ACFs may affect the SOR for the honey assay, and (2) because the ACF number is high and the screening full-factorial experimental design includes a very high run number (211 = 2.048), an adequate experimental design must be used, considering that the purpose of screening the experimental design is to identify and separate factors that demand further investigation.
Table 1. Eleven apparent critical factors (ACFs) considered for two levels of fold-over experimental design at resolution IV level, and experimental ranges expressed in coded and actual units.
Tabla 1. Once factores críticos aparentes (FCA) para los dos niveles del diseño experimental de resolución IV y rangos experimentales expresados en unidades codificadas y reales.
To simplify the process, an 2k−p fractional experimental design appeared the most adequate experimental tool, specifically an (
fractional factorial experimental design). IV resolution means that main effects are not confounded by two-factor interactions (Robinson, Citation2000), and thus, the primary effects are clearly identified.
For each ACF, we generated an Xi coded independent variable (being i = 1–11) because it is advisable to transform natural variables into coded variables. These coded variables are usually defined as dimensionless, with a mean of zero and the same spread or standard deviation (Myers & Montgomery, Citation1995). Each ACF (independent variables) were coded according to the equation , where Xi is the coded value of the ith independent variable, xi is the uncoded value of the ith independent variable, xi* is the uncoded value of the ith independent variable at the central point and Δxi is the step-change value (Myers & Montgomery, Citation1995). Finally, runs () were performed in random order (trial order), because randomization allows the experimenter to avoid erroneous conclusions due to extraneous sources of variability (Joglekar & May, Citation1987; Robinson, Citation2000). A fractional experimental design was generated, and results were analyzed using the Statistica Academic v 13 software package (Dell Inc., Citation2015).
Table 2. Results obtained for SOR (R1), pH (R2) and EC (R3) of working solutions in each experimental trial.
Tabla 2. Resultados obtenidos para la ROE (R1), pH (R2) y CE (R3) de las soluciones de trabajo en cada prueba experimental.
2.2. Honey samples
2.2.1. Samples used in the exploratory experiment
The honey source (ACF X1) considered a blossom honey (multifloral) sample to have a low level, and a honeydew honey (oak) sample as a high level.
2.2.2. Samples used in the confirmation experiment
Using the fractional factorial experimental design results, 38 samples (32 blossom and 6 honeydew honeys) were used to determine the SOR value using readings from both automatic and manual systems and both 10-cm and 20-cm tube lengths. All blossom and honeydew honeys were purchased in the market and their botanic origin was confirmed from melissopalynological analysis following Louveaux, Maurizio, and Vorwohl (Citation1978).
2.3. SOR determination
SOR was determined according to the Harmonized Methods of the European Honey Commission, as described by Bogdanov et al. (Citation1997). Changes to the method were realized according to the fixed ACFs following the experimental design considered as follows.
Sample preparation included liquefaction and pre-filtration. Since the method does not set standard operating procedures, liquefaction temperature (30ºC and 40ºC) and liquefaction timing (30 and 60 min) were selected as low and high levels for the X2 and X3 factors of the experimental design, respectively. The pre-filtration (factor X3), step was considered the high level, and no such step was considered as a low level.
Determination was performed using a 10-g and 13-g samples at low and high levels (factor X5), respectively, by dissolving it in distilled water (X6: 25 and 75 mL as low and high levels, respectively). Carrez I solution (10.6 g of potassium hexacyanoferrate in distilled water and diluted to 100 mL) was added (as factor X7: 5 and 10 mL as low and high levels, respectively) and mixed for 30 s. Next, the Carrez II solution (24 g of zinc acetate in distilled water [X6] and 3 g of glacial acetic acid, diluted to 100 mL) was added as factor X8 (5 and 10 mL as the low and high levels, respectively). This mixture was mixed again for 30 s and diluted in a 100-mL volumetric flask with distilled water.
The next day, the solution was filtered (X9: 10–12 and 2–3 µ of the pore diameter for low and high levels, respectively). A clean polarimeter tube was rinsed and filled with solution (X10: 10 and 20 cm as low and high levels, respectively) and the measurements of angular rotation (α) were taken at 20ºC in both manual (Lan Optics model WXG-4) and automatic (Zuzi model No.412) polarimeters, i.e. the low and high levels, respectively, for X11 factor. Calculation of SOR: = α × 100/l × p, where α = angular rotation found; l = length in decimeters of the polarimeter tube and p = grams of dry matter taken.
The responses considered were SOR (R1), pH (R2) and EC (R3) of the working solutions.
3. Results and Discussion
The results obtained from the experimental design and the effects of ACFs on the responses are shown in and , respectively. The pH values found in blossom and honeydew honeys were 3.94 and 4.97, respectively, and the EC values 0.33 and 0.81 mS/cm, respectively. The effect of honey type (X1) on SOR was 8.29, which means that the difference in SOR between both blossom (low level) and honeydew (high level) honey was 8.29º. The SOR values obtained in blossom honeys ranged from −0.25 to −20.63º (−9.62 ± 4.44º) and in honeydew honeys from +5.65 to +16.25º (+10.45 ± 4.14º). These results agreed with others previously reported for Bulgarian blossom and honeydew honey (19º) by Dinkov (Citation2003) and for Algerian honeys (10º) by Ouchemoukh, Louaileche, and Schweitzer (Citation2007). Dinkov (Citation2003) reported small differences in SOR between honeydew (+4.2 ± 1.3º) and blossom (−14.8 ± 4.9º) honeys. Persano Oddo et al. (Citation1995) found SOR between −2.3º and −24.9º in 12 unifloral honey types (Arbutus, Castanea, Citrus, Erica, Eucalyptus, Hedysarum, Helianthus, Rhododendron, Robinia, Taraxacum, Thymus, and Tilia). A wide range of SOR values (+2.5º to +30.0º) was also found in honeydew honeys (Abies and Metcalfa). Kirkwood, Mitchell, and Smith (Citation1960) obtained an efficient discriminant function composed of pH, and percentages of ash and reducing sugars as factors to be considered to differentiate between floral and honeydew honeys with certainty. However, Kirkwood, Mitchell, and Ross (Citation1961) stated that all honeydew honeys were dextrorotatory and blossom honeys were levorotatory. Thus, SOR determination is a compelling parameter to discriminate blossom honeys from honeydew honeys. These authors analyzed 28 honey samples obtaining positive angles of SOR (+2.87º to +12.48º) for the 11 honeydew samples.
Table 3. Effects in terms of coded factors for each response obtained on SOR (R1), pH (R2) and EC (R3) of working solutions. A strong effect was considered when p < 0.15 and the factor was considered an apparent critical factor (ACF).
Tabla 3. Efectos en términos de factores codificados para cada respuesta obtenida en la ROE (R1), pH (R2) y CE (R3) de las soluciones de trabajo. Se consideró un efecto fuerte cuando p < 0.15 y el factor se consideró factor crítico aparente (FCA).
Furthermore, Primorac, Flanjak, Kenjeric, Bubalo, and Topolnjak (Citation2011) concluded that for honeys with similar fructose and glucose contents such as black locust and chestnut honeys, SOR is a discriminant parameter, due to the higher disaccharide and trisaccharide contents in black locust honey.
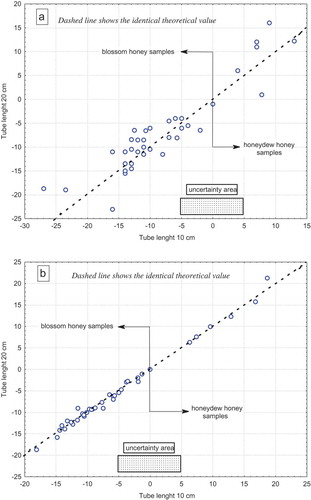
Our confirmation experiment, including 38 honey samples, shows that the botanical origin was identified independently of the polarimeter reading system and tube length used for the measurement of SOR (). However, the −5º to +5º range may be defined as an uncertainty interval. The effect of X11 on R2 and R3 was significant (, p ≤ 0.00), and thus, the results in were expected. Nevertheless, both figures show interesting information such as using an automatic system provides with higher SOR values (SD = 2.73) than a manual system (SD = 4.35). However, show visually that for the length of the tube no statistical significance was found (p ≤ 0.76); although no strong effect of the tube length on SOR value (R1) was observed (), two very interesting facts may be identified: first, using the manual system, a 20-cm polarimeter tube provides significantly higher SOR values than a 10-cm tube (, p ≤ 0.05), and for this reason, tube length is a critical factor using the manual reading system. The second is that this effect is not critical using the automatic system, and tube length is not a critical factor. A strong correlation (r2 = 0.99; p ≤ 0.01) between the SOR values obtained with both polarimeter tube lengths was found for the automatic system, as seen in .
Figure 1. SOR values obtained for both manual (a) and automatic (b) systems.
Figura 1. Valores de la ROE obtenidos usando los sistemas manual (a) y automático (b).
In addition, different steps of the analytical procedure such as pre-filtering (X4), dilution volume (X6), and Carrez I (X7) and Carrez II addition (X8) appear to be critical parameters to control, because significant effects (p ≤ 0.05, ) were detected for R2 (X4, X6, X8 and X11) and for R3 (X4, X7, X8 and X11).
When SOR was measured using the automatic reading system and a 20-cm polarimeter tube, significant relationships were obtained between R1 and R2 (r = 0.48, p ≤ 0.00) and R1 and R3 (r = 0.62, p ≤ 0.00), which means that strong control of these parameters must be monitored during the procedure to obtain adequate analytical method development.
The rotation of freshly prepared solutions of many sugars steadily changes at a rate characteristic of unimolecular reactions, to a permanent state where no further change in optical rotation occurs (Joslyn, Citation1950). Sugars in honey can exist in solution in several physical forms, which may have different optical rotations. Usually, a sugar exists in one form in the crystal. However, fructose in honey is more soluble and tends to remain in solution for a longer period, whereas glucose is the crystallizing sugar in the honey due to its relative lower solubility (Gleiter, Horn, & Isengard, Citation2006). This phenomenon could explain why changes in SOR might occur during aging, and thus, a reasonable hypothesis is that the aging effect on SOR may overlap with the effect of botanical origin. Upon dissolution, equilibrium is reached between the several forms, and during equilibration the optical rotation of the solution changes. This is known as mutarotation (multirotation). Its extent is quite characteristic of specific sugars (White, Citation1975) and appears to be a potential factor that can influence the resulting SOR readings. Although this phenomenon is known, the mechanism in honey is not fully understood and further research is necessary.
Honey, although completely liquid, exhibits a slow change in optical rotation after dilution. In Browne and Young (Citation1908) analyses, 92 samples of levorotatory honeys showed a change of −3.5º after standing for 20 h. The change is not brought on the difference in specific rotation of the sugars due to the concentration change; this would be in the opposite direction and largely due to fructose. A pronounced mutarotation would be expected when the honey being dissolved contains glucose crystals. Even when the honey is entirely liquid, the net change in optical rotation in the solution is in the direction of glucose mutarotation, not that of fructose. Furthermore, fructose mutarotation is approximately 12 times as rapid as that of glucose. It appears likely that glucose is involved in honey mutarotation. We know of no studies of the cause or mechanism of honey mutarotation. However, Isbell and Frush (Citation1951) stated that the mutarotation of sugars is catalyzed more strongly by bases than by acids, and it is possible that a direct relationship exists between the concentrations of alpha and beta isomers and optical rotation regardless of the presence of more or less acid. Notably, these authors long ago confirmed the importance of the pH of working solutions and their selection as critical factors.
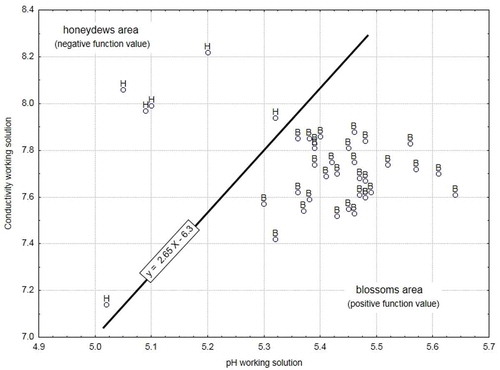
The effect of the polarimeter reading system X11 () on SOR was 8.97, meaning that the differences in the SOR values obtained with both manual (low level) and automatic reading systems was 8.97º. X11 appears as a critical parameter in determining the SOR, because the general criteria for blossom honey is levorotatory and for honeydew honey is usually dextrorotatory, which may be modified when a manual polarimeter is used. The final decision to classify the honey in Greece, Italy, and UK may be wrong. Based on these results, SOR mean values for both honey types must be defined according to the polarimeter reading system used. The SOR values in honey require the same polarimetric system to be compared. For this reason, and according to the results obtained in this study, the determination of the SOR in honey under certain conditions may imply uncertainty when used to classify honey samples as from honeydew or nectar. This occurs mainly when values are close to zero, such as from −5 (levorotatory) to +5 (dextrorotatory), as shown in . Hence, negative or positive values within this interval (between −5º and +5º) are not enough to distinguish blossom from honeydew honey. This uncertainty interval is set according to the available information and scientific expertise from the authors. To provide greater accuracy within this range, the expression y = 2.65x − 6.3 is proposed to discriminate blossom honey from honeydew honey, where x is the pH of the working solution and y its EC. This expression matches the line equation which separates both honey types according to the pH and EC of the work solutions studied in the confirmatory experiment and allows the correct classification whenever there are doubts. Negative values of SOR were obtained for blossom and positive values for honeydew honey samples. shows a clearer separation of blossom honey and honeydew honey than that obtained exclusively based on the SOR value (). These results reveal SOR as conclusive parameter to classify honey types according to their botanical origin: Blossom or honeydew honeys.
Figure 2. Linear combination proposed to classify blossom and honeydew honeys.
Figura 2. Combinación lineal propuesta para clasificar las mieles de flores y mielatos.
4. Conclusion
To evaluate the critical effect of SOR to identify blossom and honeydew honeys, an experiment was designed. In summary, the critical effects (p ≤ 0.05) affecting SOR identified to screen the experimental design were the botanical origin (X1) and polarimeter reading system (X11). This means that SOR always differentiated between blossom and honeydew honeys, regardless of the reading system used (manual or automatic). However, the polarimeter tube length was critical when the manual system was used. The effect of the tube length was minimum when SOR was measured using the automatic reading system. A strong correlation between the SOR values obtained with both polarimeter tube lengths was found for the automatic reading system. Therefore, the automatic reading system is recommended when SOR is used to differentiate between blossom and honeydew honeys. In addition, a linear combination as y = 2.65x − 6.3 is proposed to classify honeys when SOR values are within the range from −5º to 5º. Monitoring of both the pH and EC of working solutions (once Carrez reagents have been added) allows the confirmation for honey botanical origin according to their SOR values. Several critical factors affected pH and EC during the analytical procedure: X4, X6, X8 and X11 for the pH of the work solutions; and X4, X7, X8 and X11 for their EC.
Conflict of Interest
The authors declare that they have no potential conflict of interest in relation to the study in this paper.
Authors Contribution
SS, IR and FR conceived this research and designed experiments, participated in the design and interpretation of the data and wrote the paper and participated in the revisions of it; IR and RM performed experiments and analysis. All authors read and approved the final manuscript.
Acknowledgments
Authors want to thank Plan Andaluz de Investigación, Desarrollo e Innovación (Research Group AGR-202) for the financial support of research presented in this article.
Additional information
Funding
References
- Al-Khalifa, A. S., & Al-Arify, I. A. (1999). Physicochemical characteristics and pollen spectrum of some Saudi honeys. Food Chemistry, 67, 21–25. doi:10.1016/S0308-8146(99)00096-5
- Battaglini, M., & Bosi, G. (1973). Caratterizzazione chimico-fisica dei mieli monofloral sulla base dello spettro glucidico e del potere rotatorio specifico. Scienza e Tecnologia degli alimenti, 3, 217–221.
- Bogdanov, S., 16 other members of the International Honey Commission. (1997). Harmonised methods of the European Honey Commission. Apidologie, (extra issue), 1–59.
- Bogdanov, S. 21 other members of the International Honey Commission. (1999b). Honey quality and international regulatory standards: Review by the International Honey Commission. Bee World, 80(2), 61–69. doi:10.1080/0005772X.1999.11099428
- Bogdanov, S. (2011). Composition of honey. Retrieved from www.bee-hexagon.net
- Bogdanov, S., Martin, P., & Lullmann, C. (2002). Harmonised methods of the International Honey Commission. FAM, Liebefeld: Swiss Bee Research Centre.
- Browne, C. A., & Young, W. J. (1908). Chemical analysis and composition of American honeys, including a microscopical study of honey pollen. Bulletin U.S. Department of Bureau of Chemistry, 110, 70–93.
- Dell Inc. (2015). Statistica package software (Academic 13th version). Austin, TX.
- Dimins, F., Kuka, P., & Cakste, I. (2008). Content of carbohydrates and specific rotation angle of honeys. 3rd Baltic Conference on Food Science and Technology FOODBALT-2008, 121–125. Conference Proceedings. doi:10.1177/1753193408090120
- Dinkov, D. (2003). A scientific note on the specific optical rotation of three honey types from Bulgaria. Apidologie, 34, 319–320. doi:10.1051/apido:2003017
- Gleiter, R. A., Horn, H., & Isengard, H. D. (2006). Influence of type and state of crystallization on the water activity of honey. Food Chemistry, 96(3), 441–445. doi:10.1016/j.foodchem.2005.03.051
- Isbell, H. S., & Frush, H. L. (1951). Mechanisms for the mutarotation and hydrolysis of the glycosylamines and mutarotation of the sugars. Journal of Research of the National Bureau of Standards, 46(2), 132–144. doi:10.6028/jres.046.020
- Ivanov, T. (1986). Quality, standardisation and qualification of honey products (pp. 7–31). Sofia, Bulgaria: Survey Agricultural Academic.
- Joglekar, A. M., & May, A. T. (1987). Product excellence through design of experiments. Cereal World, 32, 857–868.
- Joslyn, M. (1950). Methods in food analysis applied to plant products. New York, NY: Academic Press Inc., Publishers.
- Kirkwood, K. C., Mitchell, T. J., & Ross, I. C. (1961). An examination of the occurrence of honeydew in honey. Part II. Analyst, 86, 164–165. doi:10.1039/an9618600164
- Kirkwood, K. C., Mitchell, T. J., & Smith, D. (1960). An examination of the occurrence of honeydew in honey. Analyst, 85, 412–416. doi:10.1039/an9608500412
- Krpan, M., Marković, K., Šarić, G., Skoko, B., Hruškar, M., & Vahčić, N. (2009). Antioxidant activities and total phenolics of acacia honey. Czech Journal of Food Science, 27, 245–247. doi:10.17221/1112-CJFS
- Louveaux, J., Maurizio, A., & Vorwohl, G. (1978). Methods of melissopalynology by International Commission for bee botany of IUBS. Bee World, 59, 139–157. doi:10.1080/0005772X.1978.11097714
- Myers, R. H., & Montgomery, D. C. (1995). Introduction to response surface methodology. In G. E. P. Box & D. W. Montgomery (Eds.), Response surface methodology. Process and product optimization using designed experiments (pp. 1–16). New York, NY: John Wiley & Sons Inc.
- Nanda, V., Sarkar, B. C., Sharma, H. K., & Bawa, A. S. (2003). Physico-chemical properties and estimation of mineral content in honey produced from different plants in Northern India. Journal of Food Composition and Analysis, 16(5), 613–619. doi:10.1016/S0889-1575(03)00062-0
- Nikolova, K., Panchev, I., Sainov, S., Gentscheva, G., & Ivanova, E. (2012). Selected physical properties of Lime bee Honey in order to discriminate between pure honey and honey adulterated with glucose. International Journal of Food Properties, 15(6), 1358–1368. doi:10.1080/10942912.2010.521965
- Ouchemoukh, S., Louaileche, H., & Schweitzer, P. (2007). Physicochemical characteristics and pollen spectrum of some Algerian honeys. Food Control, 18, 52–58. doi:10.1016/j.foodcont.2005.08.007
- Persano Oddo, L., Piazza, M. G., Sabatini, A. G., & Accorti, M. (1995). Characterization of unifloral honeys. Apidologie, 26, 453–465. doi:10.1051/apido:19950602
- Piazza, M. G., & Persano Oddo, L. (2004). Bibliographical review of the main European unifloral honeys. Apidologie, 35, S94–S111. doi:10.1051/apido:2004046
- Pita-Calvo, C., Guerra-Rodríguez, M. E., & Vázquez, M. (2017). Analytical methods used in the quality control of honey. Journal of Agricultural and Food Chemistry, 65(4), 690–700. doi:10.1021/acs.jafc.6b04776
- Pita-Calvo, C., & Vázquez, M. (2017). Differences between honeydew and blossom honeys: A review. Trends in Food Science and Technology, 59, 79–87. doi:10.1016/j.tifs.2016.11.015
- Primorac, L., Flanjak, I., Kenjeric, D., Bubalo, D., & Topolnjak, Z. (2011). Specific rotation and carbohydrate profile of Croatian unifloral honeys. Czech Journal of Food Sciences, 29(5), 515–519. doi:10.17221/164/2010-CJFS
- Robinson, G. K. (2000). Design the experiment. In V. Barnett (Ed.), Practical strategies for experimenting (pp. 143–188). New York, NY: John Wiley & Sons.
- White, J. W., Jr. (1975). Physical characteristics of honey. In C. E. Heinemann (Ed.), Honey: A comprehensive survey (pp. 157–206). London, UK.