
 ?Mathematical formulae have been encoded as MathML and are displayed in this HTML version using MathJax in order to improve their display. Uncheck the box to turn MathJax off. This feature requires Javascript. Click on a formula to zoom.
ABSTRACT
Few studies have investigated sensory quality in multi-varietal fruit brands due to challenges in making comparisons between varieties harvested sequentially throughout the season. Sensory data are collected in crisp form and analysed using a great amount of numerical data. However, human perception is vague and an assessor’s opinion comes in linguistic form. The purpose was to assess the sensory quality of branded apricot using a novel statistical approach. Physicochemical and sensory attributes were determined for two consecutive commercial seasons. Univariate and multivariate models were applied in order to assess quality stability and to create a prediction model. The brand was affected by the presence of different cultivars and the multiple factor analysis demonstrated aroma and juiciness as the most differentiated parameters, while univariate analysis highlighted hardness and mealiness. Use of expert knowledge mixed with information from sample data enabled the development of a fuzzy model. Investigation with consumer test is needed.
RESUMEN
Pocos estudios han investigado la calidad sensorial en marcas de frutas de múltiples variedades debido a las dificultades para realizar comparaciones entre variedades cosechadas de forma secuencial a lo largo de una temporada. Generalmente, los datos sensoriales se recopilan de forma precisa y se analizan utilizando una gran cantidad de datos numéricos. Sin embargo, la percepción humana suele ser vaga y la opinión del evaluador se presenta en forma lingüística. El propósito del presente estudio fue evaluar la calidad sensorial del albaricoque [durazno] de marca empleando un enfoque estadístico novedoso. Así, durante dos temporadas comerciales consecutivas se determinaron los atributos fisicoquímicos y sensoriales de los albaricoques. Para ello se aplicaron modelos univariados y multivariados con el fin de evaluar la estabilidad de la calidad y crear un modelo de predicción. Se constató que la marca se vio afectada por el uso de diferentes cultivares; en este sentido el análisis factorial múltiple demostró que el aroma y la jugosidad son los parámetros de la fruta que más se diferencian, mientras que el análisis univariado destacó la dureza y la consistencia harinosa de la fruta. El uso de conocimiento experto combinado con la información proveniente de los datos de muestra permitió desarrollar un modelo difuso. Es necesario realizar investigaciones que incluyan pruebas entre consumidores.
PALABRAS CLAVE:
1. Introduction
Retail branded products have been successfully commercialized in recent years (Geyskens, Keller, & Dekimpe, Citation2018) in developed markets such as Europe and North America. However, there is still a huge variation on private-label development, with Italy presenting only 17% of the share, which is nearly half the amount of Switzerland (45%) (Report, Citation2014). Different categories of food may create differences in market shares along EU countries. Private-label success is known to be the strongest in commodity-driven areas where consumers perceive little or no differentiation (Report, Citation2014). Thus, to improve the demand of branded products, retailers must have a keen understanding of local market dynamics and consumer response to different categories of food, especially with fresh products.
Among fresh products, the brand has been scarcely applied to fruit (Rickard, Schmit, Gómez, & Lu, Citation2013) due to its high variability, creating a challenge for quality standardization and marketing strategies. Currently, there are few successful exceptions, such as apples, bananas and kiwifruit, whereby a single variety is usually marketed during the entire season and usually takes the place of a brand’s name (Rickard et al., Citation2013). In apples, for example, variety names are used to allude to sensorial perception and are employed in order to communicate quality of the brand (e.g. Honeycrisp) (Rickard et al., Citation2013). However, this approach is not feasible for summer perishable crops, such as stone fruit and apricots. In this case, more varieties need to be employed on a brand since each of them are present in the market for a short period, making it difficult for consumer loyalty to a specific phenotype. Moreover, this situation cannot be resolved only by importing a specific variety, especially due to the short postharvest life of the species (Gatti, Defilippi, Predieri, & Infante, Citation2009). Using different varieties in a single brand in order to meet the retail requirements of a longer shelf life might lead to inconsistent quality within the brand. Therefore, the only solution to promote and retain consumer loyalty is to select similar varieties related to aesthetic and sensorial qualities.
Relatively few studies have investigated sensorial perception issues in multi-varietal brands, due to the difficulty of making comparisons between varieties that are harvested sequentially throughout the season. Sensory analysis plays a very important role on quality assessment (Alonso, Paquin, & Mangin, Citation2002) but sensory data are usually collected in crisp form and analysed statistically using a great amount of numerical data. This might not be effective since human perception is always vague and the assessor’s opinion by nature comes in linguistic form. Therefore, it is more realistic to carry out linguistic assessments using linguistic variables instead of numerical values (Mukhopadhyay, Majumdar, Goswami, & Mishra, Citation2013). According to earlier studies, fuzzy logic is a useful tool that can be employed when conducting analyses on sensory data of many food products (Tahsiri, Niakousari, Khoshnoudi‐Nia, & Hosseini, Citation2017). It takes into account uncertainty since it allows a crisp value to be in a state other than a binary position (true or false) by attaching a credibility that it belongs to a set of elements (fuzzy set) (Bouyssou, Dubois, Pirlot, & Prade, Citation2006). Fuzzy logic also deals with linguistic variables since fuzzy rules are set in natural language that will be converted into numerical data by applying the fuzzy set theory (Kaushik, Gondi, Rana, & Srinivasa Rao, Citation2015). By doing that, relationships between linguistic variables and acceptance, or rejection of a product, may be assessed (Kaushik et al., Citation2015) without neglecting uncertainty derived from an assessor not being able to find an exact value for a variable. This includes firmness or overall liking, which may be expressed as “high”, “medium” or “low”, rather than with numbers.
Therefore, the purpose of this work was to assess the ongoing quality of a retail branded apricot, characterized by three different sequentially harvested varieties during two seasons. This was performed by using univariate and the novel multivariate approach.
2. Materials and methods
Retail branded apricots coming from the same northern Italian supplier, from Emilia Romagna, were analysed during two consecutive commercial seasons (Year 1 and Year 2), from the end of July to the beginning of August. The brands were composed of Lady Cot (LC), Faralia (FR) and Farbaly (FB) varieties due to their similarities in colour and shape but different by time of harvesting. Two consecutive samplings were made for each variety, totalling six samples (LC_1, LC_2, FR_1, FR_2, F_B1 and FB_2) for Year 1 and Year 2. Samples were analysed for physicochemical parameters, colour indexes, and sensorial analysis.
2.1. Physicochemical parameters and colour indexes
Twenty replicates for each sample were analysed with a universal sizer (Turoni srl - universal calibrator). Total solid solubles (Brix) and firmness were determined for 20 replicates according to OECD guidelines (OECD guideline, Citation2009) with a digital refractometer (Atago, mod. PAL-1) and a fruit texture analyser (Turoni srl, mod. 53220). The titratable acidity (TA) of apricot juice was determined in triplicate by titration with 0.1 N NaOH to pH 8.1 and expressed as g/100 g of malic acid. The ratio of Brix and TA (Ratio B.S.) was calculated, as well as BrimA index as proposed by Stanley and others (Citation2014). Colour was measured with a colorimeter (Konica Minolta, mod. CR-400) upon two sides (the more colourful and the less coloured side) in the equatorial zone of 20 fruits. The L*, a* and b* were recorded with Konica Minolta software (SpectraMagic NX software). According to earlier studies, the red colour of apricots seemed to catch consumer’s eyes and contributed to visual appearance (Fan, Zhao, Wang, Cao, & Jiang, Citation2017). Therefore, deriving from L*, a* and b*, other colour indexes previously tested were calculated in order to enhance sensitiveness of colour evaluation (Cristina, Citation2014; Manera et al., Citation2013; Pathare, Opara, & Al-Said, Citation2013):
▪
▪
▪ CI:
▪ MIC:
▪ COL:
▪ H index:
2.2. Sensorial analysis
Ten panellists from Sata srl (Alessandria, Italy) were selected and trained in sensory evaluation of apricots as recommended by ISO 8586 (ISO, Citation2012). Panellists were trained by discussing the definition of quality parameters selected for sensory evaluation, explaining the score sheet and method of scoring. The analyses were done between 3pm and 5pm. Two different continuous scales compliant to ISO 4121-2003 (ISO, Citation2003) were used: a hedonic scale with one end, “dislike extremely”, and the opposite end, “ like extremely”, for an overall liking assessment. A continuous intensity scale with one end, “extremely low intensity”, and the opposite end, “extremely high intensity”, was used to assess descriptive sensory attributes from apricot samples during the two seasons. In this work, panellists were asked to not consider aspects and colour of the product, but only to focus on taste, texture and aroma. For the overall liking assessment, panellists were trained to use the variety, Orange rubis, as a reference standard, which is known to be a benchmark of excellence among modern Italian produce without disappointing storability expectations (Piagnani & Bassi, Citation2013). Other than the overall liking assessment, the descriptive sensory analysis was assessed in terms of hardness, mealiness, juiciness, sweetness, sourness, and aroma. Panellists were presented with eight apricot slices from four different fruits.
2.3. Statistical analysis
All data sets were analysed with R software (R Core Team, Citation2018) using “FactoMiner” (Le, Josse, & Husson, Citation2008) and “sets” (Meyer & Hornik, Citation2009) packages for the multivariate analysis, and “nlme” (Pinheiro, Bates, DebRoy, Sarkar, & R Core Team, Citation2018) and “lsmeans” (Lenth, Citation2016) packages for the univariate analysis. A linear-mixed model was used to analyse data, using samples as a fixed effect, and panellists as a random effect. Data were expressed as means. Results were considered to be significant at the level of p < 0.05. All parameters were analysed with the Multiple Factor Analysis (MFA) in order to evaluate more complex relationships between parameters and to identify which of them were better related to overall liking. Twenty-one different parameters were scaled and grouped into new continuous sets of data named “physicochemical”, “colour” and “sensorial attributes”. Overall liking was scaled and classified separately from sensorial data as a continuous supplementary group and two more supplementary categorical groups named “Varieties” and “Year” were added to group samples (observations) by variety and year in order to obtain their centroids. A scree plot was produced in order to decide how many dimensions keep in the model.
Two different models were created based on the Fuzzy logic in order to predict Overall Liking. One model (fuzzy model 1) was based only on distinctive sensorial descriptors and parameters better related to Overall Liking on MFA analysis, while the second model (fuzzy model 2) was based on MFA results but also considers the most significant parameters of univariate analysis.
Fuzzy models are particularly useful in the cases where human knowledge is available and where there is not enough information to feed traditional mathematical models (Tagarakis et al., Citation2014). In this work, the fuzzy inference system was applied for the classification of 12 samples. The Mamdani method first converts process states into linguistic variables and uses them as inputs to create rules (Alavi, Citation2013). In order to create linguistic variables, selected parameters and overall liking were converted into membership functions (fuzzy sets). The number of fuzzy subsets chosen is problem dependent but usually, they are three or five and are almost always an odd number (Eberhart & Shi, Citation2007). Therefore, membership functions were set using three different levels: “scarce/low”, “ok/intermediate” and “excellent/high”, and numerical values (fuzzy subsets) were assigned to each level: scarce/low = 1, good/intermediate = 5 and excellent/high = 9, as suggested by experts. It is worth remembering that fuzzy subsets have overlap regions with neighbouring classes (Papageorgiou, Aggelopoulou, Gemtos, & Nanos, Citation2018) and, in this work, overlap regions were determined by standard deviations of measured data. Membership functions were normalized, meaning that the highest part of each function equals to one (Eberhart & Shi, Citation2007).
Many studies have investigated how to formulate rules but expert knowledge is still the most commonly used system (Alavi, Citation2013). Thus, the shape of membership function and IF-THEN rules were established based on expert knowledge on quality evaluation from Sata srl and the Department of Agricultural, Forest and Food Sciences (DISAFA) at the University of Turin.
In order to determine the degree of credibility of propositions (e.g. overall liking is high), an implication process must take place. After rules were set, fuzzy data provided by the fuzzification step were subjected to the Mamdami inference engine, which implication method uses MIN operator and aggregates all fuzzy sets obtained with MAX operator. When a rule is evaluated with the MIN operator, the minimum membership value of the antecedent’s parts is chosen. While with the MAX operator, the outputs of each rule are mixed to obtain a single fuzzy (the resulting fuzzy sets of each activated rule are summed) (Papageorgiou et al., Citation2018). Defuzzification was done with the centre of gravity method (Alavi, Citation2013) in order to convert the fuzzy output set to a crisp number.
In order to evaluate goodness of both fuzzy models, predicted data were compared with real data (overall liking scores) and R2 determination coefficient was determined, along with the Pearson coefficient and its significance at the level of p < 0.05. A Multiple Linear Regression (MLR) model was applied to the same parameters of both fuzzy models. R2, Adjusted R2 and significance at the level of p < 0.05 were assessed. Coefficients of both MLR and developed fuzzy models were compared. Existence of multi-collinearity on MLR models was evaluated by calculating the Variance Inflation Factor (VIF), where values greater than 5 will indicate the existence of multi-collinearity and values greater than 10 will indicate severe problems of multi-collinearity (Dias, Peres, Barcelos, Sá Morais, & Machado, Citation2011). Cook’s distance, which is the most well-established method for assessing the influence of individual data cases, was also calculated.
3. Results and discussion
3.1. Sensorial evaluation of samples
There were significant differences between samples on overall liking scores during Year 1 (), with FR1 being appreciated more than FB2, while during Year 2 there were no significant differences. Overall liking scores were generally low for both years, indicating poor taste and aroma quality of fruit. LC, FR and FB are modern apricot cultivars, which are distinguished by their large size, intense orange skin colour and red blush. In the last years, the improvement of the aesthetic characteristics occurred to the detriment of the flavour (taste and aroma) (Piagnani & Bassi, Citation2013), leading to increased consumer dissatisfaction. In this work, sensory descriptive attributes and physicochemical characteristics were important to have a better understanding of the poor quality of samples.
Figure 1. Overall liking scores of apricot samples Lady cot (LC_1 and LC_2), Faralia (FR_1 and FR_2) and Farbaly (FB_1 and FB_2) during Year 1 and Year 2.
* Different lower-case letters (a–b) show significant differences among treatments (P ≤ 0.05). Capital letters (N.S).show absence of significant differences (P ≤ 0.05) within treatment.
Figura 1. Puntuaciones generales de agrado de muestras de albaricoque Lady cot (LC_1 y LC_2), Faralia (FR_1 y FR_2) y Farbaly (FB_1 y FB_2) durante el año 1 y el año 2.
* Las diferentes letras minúsculas (a – b) muestran la presencia de diferencias significativas entre los tratamientos (P ≤ 0.05). Letras mayúsculas (N.S) indican la ausencia de diferencias significativas (P ≤ 0.05) entre los tratamientos.
Several attributes of FB and LC samples were significantly different from FR samples (). For both years FB samples presented lower scores of hardness and higher scores of mealiness, while in Year 1 FB_2 samples presented also lower scores of aroma. LC samples were characterized by lower scores of sweetness and higher scores of sourness during Year 1. Juiciness seemed to also be a distinctive factor for both FB and LC varieties: FB samples presented lower scores for both years when compared to at least one of the FR samples, while LC_1 sample was considered less juicy than FR in the first year. The lowest scores found for LC samples regarding sweetness in this work may have had an important impact on overall liking since this attribute is related with product taste (Fan et al., Citation2017). However, even though sweetness is known to correlate well with overall fruit quality, taste and acceptability (Infante, Meneses, & Defilippi, Citation2008), other studies suggested that texture properties altered by chilling injury (Stanley et al., Citation2014) or due to unripen stage (Valentini, Mellano, Antonioni, & Botta, Citation2006) may have a greater impact on apricot quality than sweetness. It is well documented that apricots develop chilling injury symptoms when stored below 7°C, such as mealiness, loss of juiciness or gel breakdown (Stanley, Prakash, Marshall, & Schröder, Citation2013), and unripe fruit are considered harder and less juicy (Valentini et al., Citation2006). In , it is possible to identify which sensorial parameters were the sample’s biggest differentiators by assessing p-values resulted from the analysis of variance of mixed models. In this work, hardness and mealiness presented lower p-values, meaning the assessor’s average scores were more variable among samples for texture attributes than taste or aroma.
Figure 2. Hardness (1), mealiness (2), juiciness (3), aroma (4), sweetness (5) and sourness (6) scores obtained from sensory analysis of apricot samples Lady cot (LC_1 and LC_2), Faralia (FR_1 and FR_2) and Farbaly (FB_1 and FB_2) during Year 1 and Year 2.
* Different lower-case letters (a–b) show significant differences among samples (P ≤ 0.05). Capital letters (N.S).show absence of significant differences (P ≤ 0.05) within treatment.
Figura 2. Puntuaciones de dureza (1), harinosidad (2), jugosidad (3), aroma (4), dulzor (5) y acidez (6) obtenidas a partir del análisis sensorial de muestras de albaricoques Lady cot (LC_1 y LC_2), Faralia (FR_1 y FR_2) y Farbaly (FB_1 y FB_2) durante el año 1 y el año 2.
* Las diferentes letras minúsculas (a – b) indican la presencia de diferencias significativas entre las muestras (P ≤ 0.05). Las letras mayúsculas (N.S) indican la ausencia de diferencias significativas (P ≤ 0.05) entre los tratamientos.
Table 1. p-Values of analysis of variance of sensorial descriptors mixed model.
Tabla 1. Valores p de análisis de varianza de descriptores sensoriales del modelo mixto.
From sensorial results, it is suggested that the presence of different varieties could have led to different perceptions of fruit quality traits. Other than variety, quality is also influenced by maturity (Fan et al., Citation2017), especially with regards to texture and other attributes, such as hardness, juiciness and crispness (Piagnani & Bassi, Citation2013) since those attributes are related to the cell wall structure and degradation during the ripening period (Bianchi et al., Citation2016). With regards to apricots, there are some contrasts on whether orchard practices and crop load can affect consumer preference and how harvest maturity may influence a fruit’s acceptability. However, there is great evidence in the literature that both maturity and crop management might alter the total soluble solid content and other physicochemical parameters that are related to sensorial quality (Stanley et al., Citation2014).
3.2. Multiple factor analysis
MFA was carried out in order to show more complex relationships between physicochemical, colour, sensorial parameters, and overall liking. A scree plot showed that the first two dimensions accounted for most of all meaningful variance, with both presenting almost 60% of the total variance explained (59,23%).
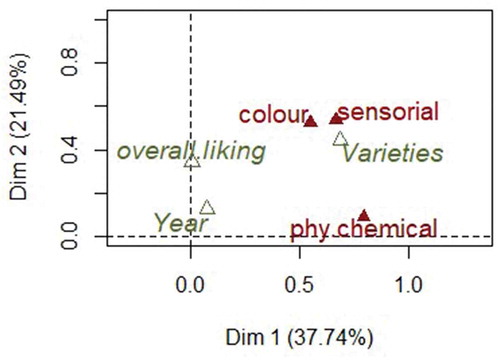
MFA contribution plot () showed that the group of physicochemical, colour, sensory parameters and varieties group were well correlated with first dimension, while only colour and sensory parameters were well correlated with the second dimension, along with overall liking. Supplementary variables have no influence on MFA dimensions, and they are used to help with interpretation of the analysis. In this work, it is suggested that varieties were better described or discriminated, especially by colour and sensory parameters, demonstrated by their proximity on the MFA contribution plot (), and same attributes were also better quality indicators compared to physicochemical parameters due to their larger variance explanation on the second dimension.
Figure 3. Contributions plot. Biplot of sets of variables on the dimensions 1 and 2 after analysis on physicochemical (represented by phy.chemical), colour and sensory attributes of all apricot samples. Active groups (physicochemical, colour and sensory variables) are represented by red colour, while supplementary variables (overall.liking and Varieties) are represented by grey colour.
Figura 3. Gráfico de contribuciones. Biplot de conjuntos de variables en las dimensiones 1 y 2 después del análisis de los atributos fisicoquímicos (representados por phy.chemical), de color y sensoriales de todas las muestras de albaricoques. Los grupos activos (variables fisicoquímicas, de color y sensoriales) se representan en color rojo, mientras que las variables complementarias (overall.liking and Varieties) se representan en color gris.
By looking at the biplot of original variables (), it is also possible to observe how complex indexes Ratio B.S. and BrimA were not better indicators than °Brix. This is in contrast with Valentini et al. (Citation2006), which highlighted that most appreciated apricots had a well-balanced Ratio B.S. It is known that composition of acids and sugar may affect this relationship which might lead to different flavour perceptions. Moreover, equal values of Ratio B.S could be derived from different concentrations of Brix and TA (Samukelo & Linus, Citation2015). In order to properly evaluate the relationship between Brix and TA, the BrimA index, which takes into account differences in ratios of acids and sugars in different species by introducing a k coefficient (Arendse, Fawole, & Opara, Citation2014; Samukelo & Linus, Citation2015; Stanley et al., Citation2014), was applied to different species in literature, such as apricots, pomegranates, citrus and grapes (Samukelo & Linus, Citation2015; Stanley et al., Citation2014). The main idea is that the human tongue perceives sugar and acids with differing sensitivities; thus, this index allows smaller amounts of acid to make the same numerical change to BrimA, as well as sugar (Jaya & Das, Citation2007), and the k coefficient may vary between species depending on most their representative acid. In the MFA biplot of original variables, BrimA and overall liking were almost orthogonal to each other, indicating a poor relationship with quality of this parameter. This is in contrast with Stanley et al. (Citation2014), where BrimA had a significant effect on consumer liking, even though this was only demonstrated with Univariate statistics.
Figure 4. Biplot of physicochemical, colour and sensory original variables on the dimensions 1 and 2 after analysis on physicochemical, colour and sensorial attributes of apricot samples.
Figura 4. Biplot de variables fisicoquímicas, de color y sensoriales originales en las dimensiones 1 y 2 después del análisis de los atributos fisicoquímicos, de color y sensoriales de muestras de albaricoques.
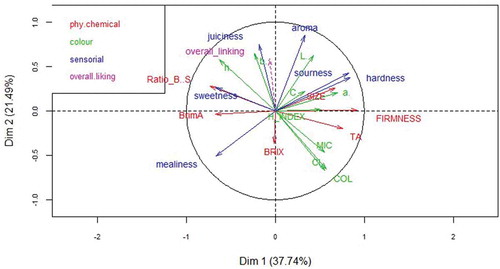
It is also evident that °Brix was negatively correlated with overall liking, which is not expected for fruit products. This is probably due to the fact that, with exception of FR_1 Year 1 (13.2° Brix), samples with higher Brix values presented defects on texture properties, highlighted by the sensory analysis. °Brix values of samples (not shown), ranged from 10.0 to 13.3, with both samples LC from Year 2 presenting 13.3° Brix, and FB both samples from Year 1 presenting 13.2 and 13.1° Brix, respectively.
Firmness was orthogonal to overall liking, demonstrating that this attribute was not a good quality indicator of apricots. This result shows how analysing texture by only assessing firmness may not be exhaustive to have a better understanding on how this multicomponent attribute affects quality. Thus, more complex instruments should have been used in order to improve instrumental quality evaluation.
With regard to colour indexes, the most correlated parameters with a second dimension and thus, overall liking, were: L* and h*, positively and CI, COL negatively. Even though Index b* was very close to overall liking, it was not considered since its quality representation (data not shown) on the global axis was very low with a coefficient cos2 lower than 0,50. Both CI and COL indexes were previously applied to citrus and tomatoes to evaluate the de-greening and ripening stage, respectively (Cristina, Citation2014; Pathare et al., Citation2013). This represents the changing from green-yellow to orange-red colour, while the enhancing of h* values would indicate a yellowish colour of samples (Infante et al., Citation2008). Even though orange/red colour is indirectly related to the apricot ripening stage, the negative relationship between CI, COL and overall liking, along with the positive relationship between h* and overall liking, suggested that orange-red flushed apricots were not the most appreciated fruit. These results are not in agreement with Cristina’s work (Citation2014) where h*, COL and CI were considered to be good ripening indicators of different varieties of apricots. However, it confirms that variety selection based on aesthetic issues may contribute to consumer disappointment (Piagnani & Bassi, Citation2013).
In summary, it is clear how sensorial parameters are better related to overall liking than any other single parameter illustrated in . This is true especially for those parameters that were not directly measured by any instrumental analysis such as aroma and juiciness. Juiciness is a very important quality attribute for fruit, depending on cultivar and ripening stage, and it enhances the perception of sweetness (Melgarejo et al., Citation2013). In fact, juiciness and sweetness correlated positively on the MFA biplot of variables, while aroma was positively correlated to sourness, which is found to be essential in fruit as a regulatory factor to obtain an optimal flavour (Huang et al., Citation2018). For what concerns mealiness, contradictory results came from multivariate and univariate statistics. Multivariate did not show an important relationship between mealiness and overall liking (mealiness’s correlation coefficient on second dimension was not significant) while univariate analysis indicated significant differences for this attribute between most appreciated (FR_2 Year 1) and less appreciated (FB_1 Year 1) samples. This is probably due to the non-linear relationship that might exist between sensory attributes in some cases (Lombardo, Citation2011), and may not be detected by MFA analysis, which relies on linear combinations of original parameters when producing global axes (dimensions) that maximize the global data variance (Vilor-Tejedor et al., Citation2018).
Some authors may state that mealiness and loss of juiciness represent the same condition, while others may emphasise the difference between the presence of soft and dry fibre (woolliness) and a sandy texture (mealiness) (Stanley et al., Citation2013). However, development of both parameters is highly dependent on cultivar physiology and how it responds to storage temperature (Stanley et al., Citation2010), while aroma is influenced by pre and postharvest factors and determined genetically (Gatti et al., Citation2009). Overall, varieties were well discriminated, especially in terms of sensorial parameters. This should be taken into account when creating a branded product marketing image.
With the exception of LC samples, MFA biplot of scores and centroids () shows that samples FB and FR were globally more similar among each other when compared with LC. These results were expected since generally late varieties present lower values of firmness and TA and higher values of brix, which might then influence sensorial parameters (Amoriello, Ciccoritti, Paliotta, & Carbone, Citation2018).
Figure 5. Biplot of the scores and confidence ellipses plotted on the first 2 dimensions after analysis on physicochemical, colour and sensorial attributes of all apricot samples. Samples of Lady Cot (LC_1 and LC_2), Faralia (FR_1 and FR_2) and Farbaly (FB_1 and FB_2) of Year 1 and Year 2 are indicated with dots. 95% Confidence intervals were calculated around centroids of factor scores for each variety (Lady Cot, Faralia and Farbaly).
Figura 5. Biplot de las puntuaciones y elipses de confianza representados en las 2 primeras dimensiones después del análisis de los atributos fisicoquímicos, de color y sensoriales de todas las muestras de albaricoques. Las muestras de Lady Cot (LC_1 y LC_2), Faralia (FR_1 y FR_2) y Farbaly (FB_1 y FB_2) del año 1 y el año 2 se indican con puntos. Los intervalos de confianza del 95% se calcularon alrededor de los centroides de las puntuaciones de los factores para cada variedad (Lady Cot, Faralia y Farbaly).
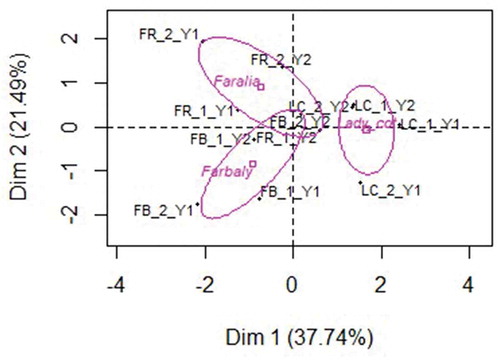
In both MFA biplots of scores and variables, it is evident that the most appreciated samples came from FR samples, being centroid of this sample significantly correlated with dimension 2 and placed near to overall liking. Farbaly samples are positioned very close to mealiness and in the opposite side of hardness, meaning that those varieties were distinguished by being mealy and soft, while LC samples are better described by higher values of hardness and sourness, as well as their instrumental indicators, TA and firmness. These results are in accordance with the univariate analysis.
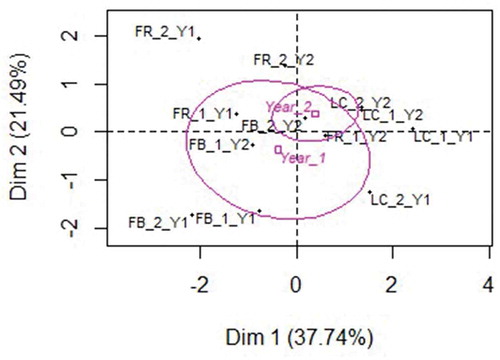
In , it is possible to observe that overall, brand quality represented by all varieties was similar among Year 1 and Year 2, even though it is clear that variability during Year 1 was greater than Year 2. It is also suggested that the brand had a greater overall quality during Year 2, demonstrated by its positive v-test value of 1,169 (Lebart, Morineau, & Piron, Citation1995).
Figure 6. Biplot of the scores and confidence ellipses plotted on the first 2 dimensions after analysis on physicochemical, colour and sensorial attributes of all apricot samples. Samples of Lady Cot (LC_1 and LC_2), Faralia (FR_1 and FR_2) and Farbaly (FB_1 and FB_2) of Year 1 and Year 2 are indicated with dots. 95% Confidence intervals were calculated around centroids of factor scores for each Year (Year_1 and Year_2).
Figura 6. Biplot de las puntuaciones y elipsis de confianza representados en las 2 primeras dimensiones después del análisis de los atributos fisicoquímicos, de color y sensoriales de todas las muestras de albaricoques. Las muestras de Lady Cot (LC_1 y LC_2), Faralia (FR_1 y FR_2) y Farbaly (FB_1 y FB_2) del año 1 y el año 2 se indican con puntos. Los intervalos de confianza del 95% se calcularon alrededor de los centroides de las puntuaciones de los factores para cada año (año_1 y año_2).
3.3. Fuzzy model
Two different Fuzzy models were developed. Fuzzy model 1 considered only the two most correlated (juiciness and aroma) to overall liking variables provided by MFA analysis. Fuzzy model 2 considered the results of the univariate analysis. Thus, for fuzzy model 2, hardness was chosen as the input variable other than juiciness and aroma since this descriptor presented a lower p-value on the univariate analysis. Unlike mealiness, it is more informative, taking into account both softening caused by chilling injuries and undesired firmness values due to the unripen stage. The shape of membership functions was chosen to be gaussian for input variables and triangular for overall liking for both models ( and ). Rules were set as described in for fuzzy model 1 and for fuzzy model 2.
Figure 7. Developed membership functions of Overall liking, aroma and juiciness of fuzzy model 1.
Figura 7. Funciones de membresía desarrolladas de gusto general, aroma y jugosidad del modelo difuso 1.
Figure 8. Developed membership functions of Overall liking, hardness, aroma and juiciness of fuzzy model 2.
Figura 8. Funciones de membresía desarrolladas de gusto general, dureza, aroma y jugosidad del modelo fuzzy 2.
Table 2. Fuzzy rules developed for aroma and juiciness of fuzzy model.
Tabla 2. Reglas difusas desarrolladas para el aroma y la jugosidad del modelo difuso.
Table 3. Fuzzy rules developed for hardness, aroma and juiciness of fuzzy model 2.
Tabla 3. Reglas difusas desarrolladas para la dureza, el aroma y la jugosidad del modelo fuzzy 2.
Determination of membership functions in terms of shape, overlapping regions and boundaries has a great impact on a model’s output and is problem dependent. One way to improve a model’s accuracy is to relate to sample statistics such as averages and standard deviations (Alavi, Citation2013) and to consider the sample’s nature. Triangular and trapezoidal are commonly used for membership functions since they are simple (Papageorgiou et al., Citation2018). However, using triangular or trapezoidal functions for agriculture products may not be suitable since these products have higher variability within the sample (Alavi, Citation2013). Thus, gaussian membership functions for input variables might have contributed to enhance the accuracy of fuzzy model. In this study overlapping regions were determined by standard deviations of input variables given by panellists on sensory evaluation while boundaries were determined by combining expert knowledge with sensorial data from this study.
From and , it is possible to observe that both fuzzy models classified FR samples from Year 1 with the highest predicted overall liking score, which is in accordance with real data from panellists. At the same way, FB samples from Year 1 presented the lowest scores.
Table 4. Data from aroma, juiciness and overall liking from sensorial evaluation and data from predicted fuzzy model 1 of apricot samples Lady cot (LC_1 and LC_2), Faralia (FR_1 and FR_2) and Farbaly (FB_1 and FB_2) from Year 1 and Year 2.
Tabla 4. Datos de aroma, jugosidad y gusto general de la evaluación sensorial y datos del modelo 1 difuso pronosticado para muestras de albaricoques Lady Cot (LC_1 y LC_2), Faralia (FR_1 y FR_2) y Farbaly (FB_1 y FB_2) del año 1 y del año 2.
Table 5. Data from hardness, aroma, juiciness and overall liking from sensorial evaluation and data from predicted fuzzy model 2 of apricot samples Lady cot (LC_1 and LC_2), Faralia (FR_1 and FR_2) and Farbaly (FB_1 and FB_2) from Year 1 and Year 2.
Tabla 5. Datos de dureza, aroma, jugosidad y gusto general de la evaluación sensorial y datos del modelo difuso predicho 2 de muestras de albaricoques Cuna Lady (LC_1 y LC_2), Faralia (FR_1 y FR_2) y Farbaly (FB_1 y FB_2) de año 1 y año 2.
The correlation study between predicted values of fuzzy model 1 and real data presented a significant Pearson’s coefficient of 0.75 (p-value < 0.01) (), and a determination coefficient R2 of 0.57. This value was only slightly higher than the multiple linear regression (MLR1) that considered the same parameter’s juiciness and aroma as input variables, which has presented an R2 of 0.54, an adjusted R 2 of 0.44, and the model was significant (p-value 0.028). However, the MLR1 model did not comply with the MLR model considering the same parameters of hardness, juiciness and aroma (MLR2) was not improved by additional hardness. The MLR2 presented an R2 of 0.56, an adjusted R2 of 0.39 and was not significant (p-value 0.075).
Figure 9. Scatterplot with Pearson coefficient and p-value of correlation analysis of predicted values from fuzzy model 1 and Real_ values (overall liking scores) from sensorial evaluation of all samples.
Figura 9. Diagrama de dispersión empleando el coeficiente de Pearson y valor p del análisis de correlación de los valores pronosticados para el modelo 1 difuso y los valores reales (puntajes generales de agrado) de la evaluación sensorial de todas las muestras.
Figure 10. Scatterplot with Pearson coefficient and p-value of correlation analysis of predicted values from fuzzy model 2 and Real_ values (overall liking scores) from sensorial evaluation of all samples.
Figura 10. Diagrama de dispersión empleando el coeficiente de Pearson y valor p del análisis de correlación de los valores pronosticados para el modelo 2 difuso y los valores reales (puntajes generales de agrado) de la evaluación sensorial de todas las muestras.
MLR models require that dependent and independent variables satisfy many assumptions. Globally the data must have a linear behaviour and the independent variables should not show multicollinearity. Additionally, the model errors should follow a normal distribution, present homogeneity of variances and an independent strong autocorrelation between both input parameters may inflate the R2 coefficient (Dias et al., Citation2011). In this work, VIF values of MLR1 and MLR2 models were 2.20 and 2.26, which do not indicate problems of multi-collinearity of data, although Cook’s distance of both models indicates that sample FR_2_Year 2 was an influential point, meaning that residuals have patterns. It is well known that non-compliancy of MLR assumptions are probably related to the presence of outliers or existence of a non-linear relationship between dependent and independent variables (Bruce & Andrew, Citation2017). Use of different models to overcome non-linear relationships between sensorial data is widespread in literature (Di Natale et al., Citation2001; Stanley et al., Citation2013) since many sensorial systems display non-linear behaviour that may not be reliably modelled by using linear regression techniques (Lombardo, Citation2011). Among them, artificial neural networks are powerful techniques to deal with non-linear data (Dong et al., Citation2014) although they require large data sets for training data (Papageorgiou et al., Citation2018). Therefore, using the fuzzy model enabled the development of a classification model that might be useful when dealing with small samples without leaving aside non-linearity of data. In this work, even though R and R2 values of fuzzy model 2 were not high, it is interesting to observe how it was possible to obtain an improvement of the first fuzzy model by adding the hardness parameter, which presented a different relationship with overall liking compared to juiciness and aroma (). In fact, hardness presented a clear non-linear relationship, since higher and lower values of this parameter impacted negatively on overall liking scores, as shown in . In particular, higher values of hardness impacted more negatively than lower values of hardness on the assessor’s overall liking score. The possibility to describe different relations by setting specific rules for each input parameter enabled fuzzy model 2 to improve fuzzy model 1. This was not observed when applying MLR, which requires that the relationship between dependent and independent variables is the same and linear. Therefore, the fuzzy model might be a useful tool when the collection of large datasets is limited and expert-knowledge is available to set the model’s rules.
4. Conclusions
In this study, quality of retail branded apricots resulted variable during commercial life in two consecutive seasons due to the presence of different cultivars. This reveals how important the management of fresh produce is in multivarietal brands. Failure in quality stability was successfully demonstrated by univariate and multivariate analyses. Univariate analysis showed significant differences, especially for what concerns textural properties and aroma, while MFA analysis demonstrated an overall significant difference among Lady cot and late varieties Faralia and Farbaly. New quality indexes such as COL and CI parameters, as well as sensory attributes related to texture, were better related to overall liking. The Multiple Factor Analysis was efficient in interpreting relationships among almost all variables, although it is suggested that relation between mealiness and overall liking was not highlighted due to the existence of non-linearity relationship among those variables. Use of expert knowledge mixed with information from sample data enabled development of Linguistic variables and rules of two different fuzzy models. Correlation studies between real and predicted data showed a higher R2 coefficient, especially for fuzzy model 2. MRL1 did not comply with regression assumptions while MRL2 was not significant. Therefore, the fuzzy model might be a valuable tool to evaluate non-linear and small data from fruit sensorial studies if expert-knowledge is available. Moreover, the possibility to describe different relations by setting specific rules for each input parameter enables the use of the fuzzy model in complex situations. It is model-free by nature and it allows a certain degree of uncertainty, which may properly reproduce the way humans can think. For what concerns apricot brand quality, it is suggested that results of the sensory analysis might be extended also to the consumer level. Additionally, the use of proper ordination analysis is needed in order to highlight the non-linearity of data that possibly exists among quality parameters and overall liking.
Acknowledgments
We would like to thank all professionals and operators of Sata srl who actively participated in the research project.
Disclosure statement
No potential conflict of interest was reported by the authors.
References
- Alavi, N. (2013). Quality determination of Mozafati dates using Mamdani fuzzy inference system. Journal of the Saudi Society of Agricultural Sciences, 12, 137–142.
- Alonso, M. A. S., Paquin, J.-P., & Mangin, J.-P. L. (2002). Modelling perceived quality in fruit products. Journal of Food Products Marketing, 8, 29–48. doi:10.1300/J038v08n01_03
- Amoriello, T., Ciccoritti, R., Paliotta, M., & Carbone, K. (2018). Classification and prediction of early-to-late ripening apricot quality using spectroscopic techniques combined with chemometric tools. Scientia Horticulturae, 310–317. doi:10.1016/j.scienta.2018.06.031
- Arendse, E., Fawole, O. A., & Opara, U. L. (2014). Influence of storage temperature and duration on postharvest physico-chemical and mechanical properties of pomegranate fruit and arils. CyTA – Journal of Food Science, 12, 389–398. doi:10.1080/19476337.2014.900114
- Benjamini, Y., & Hochberg, Y. (1995). Controlling the false discovery rate: A practical and powerful approach to multiple testing. Journal of the Royal Statistical Society, 57, 289–300.
- Bianchi, T., Guerrero, L., Gratacós-cubarsí, M., Claret, A., Argyris, J., Garcia-mas, J., & Hortós, M. (2016). Scientia horticulturae textural properties of different melon (Cucumis melo L .) fruit types: Sensory and physical-chemical evaluation. Scientia Horticulturae (Amsterdam), 201, 46–56. doi:10.1016/j.scienta.2016.01.028
- Bouyssou, D., Dubois, D., Prade H., Pirlot M. (2006). Concepts et méthodes pour l'aide à la décision. 1, outils de modélisation. Paris: Lavoisier.
- Bruce, P., & Andrew, B. (2017). Practical statistics for data scientists. O’Reilly Media.
- Cristina, P. (2014). Assessment of apricot color and quality changes using color indices. The Journal of Horticultural Science and Biotechnology, 18, 70–73.
- Di Natale, C., Macagnano, A., Martinelli, E., Proietti, E., Paolesse, R., Castellari, L., … D’Amico, A. (2001). Electronic nose based investigation of the sensorial properties of peaches and nectarines. Sensors Actuators B Chemistry, 77, 561–566. doi:10.1016/S0925-4005(01)00705-5
- Dias, L. G., Peres, A. M., Barcelos, T. P., Sá Morais, J., & Machado, A. A. S. C. (2011). Semi-quantitative and quantitative analysis of soft drinks using an electronic tongue. Sensors Actuators B Chemistry, 154, 111–118. doi:10.1016/j.snb.2010.01.005
- Dong, J. J., Li, Q. L., Yin, H., Zhong, C., Hao, J. G., Yang, P. F., … Jia, S. R. (2014). Predictive analysis of beer quality by correlating sensory evaluation with higher alcohol and ester production using multivariate statistics methods. Food Chemistry, 161, 376–382. doi:10.1016/j.foodchem.2014.03.095
- Eberhart, R. C., & Shi, Y. (2007). Computational intelligence: Concepts to implementations. San Francisco, CA: Morgan Kaufmann.
- Fan, X., Zhao, H., Wang, X., Cao, J., & Jiang, W. (2017). Sugar and organic acid composition of apricot and their contribution to sensory quality and consumer satisfaction. Scientia Horticulturae (Amsterdam)., 225, 553–560. doi:10.1016/j.scienta.2017.07.016
- Gatti, E., Defilippi, B. G., Predieri, S., & Infante, R. (2009). Apricot (Prunus armeniaca L .) quality and breeding perspectives Apricot (Prunus armeniaca L .) quality and breeding perspectives. Journal of Food, Agriculture & Environment, 7, 3–4.
- Geyskens, I., Keller, K. O., & Dekimpe, M. G. (2018). How to brand your private labels. Bus Horizons, 61, 487–496. doi:10.1016/j.bushor.2018.01.015
- Huang, Z., Hu, H., Shen, F., Wu, B., Wang, X., Zhang, B., … Wu, T. (2018). Scientia horticulturae relatively high acidity is an important breeding objective for fresh juice- speci fi c apple cultivars. Scientia Horticulturae (Amsterdam), 233, 29–37. doi:10.1016/j.scienta.2018.01.026
- Infante, R., Meneses, C., & Defilippi, B. G. (2008). Effect of harvest maturity stage on the sensory quality of ‘Palsteyn’ apricot (Prunus armeniaca L.) after cold storage. Journal of Horticultural Science and Biotechnology, 83, 828–832. doi:10.1080/14620316.2008.11512468
- ISO. (2003). Sensory analysis. Guidelines for the use of quantitative response scales. Geneva, Switzerland: Author.
- ISO. (2012). Sensory analysis. General guidance for selection, training and monitoring of assessors and expert sensory assessors. Geneva, Switzerland: Author.
- Jaya, S., & Das, H. (2007). Sensory evaluation of mango drinks using fuzzy logic. Journal of Sensory Studies, 18, 163–176. doi:10.1111/j.1745-459X.2003.tb00382.x
- Kaushik, N., Gondi, A. R., Rana, R., & Srinivasa Rao, P. (2015). Application of fuzzy logic technique for sensory evaluation of high pressure processed mango pulp and litchi juice and its comparison to thermal treatment. Nnovative Food Science and Emerging Technologies, 32, 70–78. doi:10.1016/j.ifset.2015.08.007
- Le, S., Josse, J., & Husson, F. (2008). FactoMineR: An R package for multivariate analysis. Journal of Statistical Software, 25(1), 1–18. doi:10.18637/jss.v025.i01
- Lebart, L., Morineau, A., & Piron, M. (1995). Statistique exploratoire multidimensionnelle. Paris: Dunod..
- Lenth, R. V. (2016). Least-squares means: The R package lsmeans. Journal of Statistical Software, 69(1), 1–33. doi:10.18637/jss.v069.i01
- Lombardo, R. (2011). The analysis of sensory and chemical–Physical variables via multivariate additive PLS splines. Food Quality and Preference, 22, 714–724. doi:10.1016/j.foodqual.2011.06.002
- Manera, F. J., Legua, P., Melgarejo, P., Brotons, J. M., Hernández, F., & Martínez, J. J. (2013). Determination of a colour index for fruit of pomegranate varietal group “ Mollar de Elche .”. Scientia Horticulturae (Amsterdam)., 150, 360–364. doi:10.1016/j.scienta.2012.11.036
- Melgarejo, P., Calín-Sánchez, Á., Carbonell-Barrachina, Á. A., Martínez-Nicolás, J. J., Legua, P., Martínez, R., & Hernández, F. (2013). Antioxidant activity, volatile composition and sensory profile of four new very-early apricots (Prunus armeniaca L.). Journal of the Science of Food and Agriculture, 94, 85–94. doi:10.1002/jsfa.6201
- Meyer, D., & Hornik, K. (2009). Generalized and customizable sets in R. Journal of Statistical Software, 31(2), 1–27. doi:10.18637/jss.v031.i02
- Mukhopadhyay, S., Majumdar, G. C., Goswami, T. K., & Mishra, H. N. (2013). Fuzzy logic (similarity analysis) approach for sensory evaluation of chhana podo. LWT - Food Science and Technology, 53, 204–210. doi:10.1016/j.lwt.2013.01.013
- OECD guideline. (2009). OECD fruit and vegetables scheme.
- Papageorgiou, E. I., Aggelopoulou, K., Gemtos, T. A., & Nanos, G. D. (2018). Development and evaluation of a fuzzy inference system and a neuro-fuzzy inference system for grading apple quality. Applied Artifical Intelligence, 32, 253–280. doi:10.1080/08839514.2018.1448072
- Pathare, P. B., Opara, U. L., & Al-Said, F. A.-J. (2013). Colour measurement and analysis in fresh and processed foods: A review. Food and Bioprocess Technology, 6, 36–60. doi:10.1007/s11947-012-0867-9
- Piagnani, C. M., & Bassi, D. (2013). Fruit quality evaluation of diverse apricot cultivars. In Gerald B, Michelle F, Richard H & Robert (Eds.), Fruits and roots: A celebration and forward look. Kent: East Malling Research.
- Pinheiro, J., Bates, D., DebRoy, S., Sarkar, D., & R Core Team. (2018). nlme: Linear and Nonlinear Mixed Effects Models. R package version 3.1–140, https://CRAN.R-project.org/package=nlme.
- R Core Team. (2018). R: A language and environment for statistical computing. Vienna, Austria: R Foundation for Statistical Computing.
- Report, N. (2014, November). The state of private label around the world-where its growing, where its not and what the future holds.
- Rickard, B. J., Schmit, T. M., Gómez, M. I., & Lu, H. (2013). Developing brands for patented fruit varieties: does the name matter? Agribusiness, 29, 259–272. doi:10.1002/agr.v29.3
- Samukelo, L., & Linus, U. (2015). Analytical methods for determination of sugars and sweetness of horticultural products — A review. Scientia Horticulturae (Amsterdam)., 184, 179–192. doi:10.1016/j.scienta.2015.01.001
- Stanley, J., Feng, J., & Olsson, S. (2014). Crop load and harvest maturity effects on consumer preferences for apricots. Journal of the Science of Food and Agriculture, 95, 752–763. doi:10.1002/jsfa.6850
- Stanley, J., Marshall, R., Ogwaro, J., Feng, R., Wohlers, M., & Woolf, A. B. (2010). Postharvest storage temperatures impact significantly on apricot fruit quality. Acta Horticulturae, 880, 525–532. doi:10.17660/ActaHortic.2010.880.63
- Stanley, J., Prakash, R., Marshall, R., & Schröder, R. (2013). Effect of harvest maturity and cold storage on correlations between fruit properties during ripening of apricot (Prunus armeniaca). Postharvest Biology and Technology, 82, 39–50. doi:10.1016/j.postharvbio.2013.02.020
- Tagarakis, A., Koundouras, S., Papageorgiou, E. I., Dikopoulou, Z., Fountas, S., & Gemtos, T. A. (2014). A fuzzy inference system to model grape quality in vineyards. Precision Agriculture, 15, 555–578. doi:10.1007/s11119-014-9354-9
- Tahsiri, Z., Niakousari, M., Khoshnoudi‐Nia, S., & Hosseini, S. M. H. (2017). Sensory evaluation of selected formulated milk barberry drinks using the fuzzy approach. Food Science and Nutrition, 5, 739–749. doi:10.1002/fsn3.491
- Valentini, N., Mellano, M. G., Antonioni, I., & Botta, R. (2006). Chemical, physical and sensory analysis for evaluating quality of apricot cultivars. Acta Horticulturae, 701, 559–564. doi:10.17660/ActaHortic.2006.701.97
- Vilor-Tejedor, N., Alemany, S., Cáceres, A., Bustamante, M., Mortamais, M., Pujol, J., … González, J. R. (2018). Sparse multiple factor analysis to integrate genetic data, neuroimaging features, and attention-deficit/hyperactivity disorder domains. International Journal of Methods in Psychiatric Research, 27, e1738. doi:10.1002/mpr.v27.3